
 ?Mathematical formulae have been encoded as MathML and are displayed in this HTML version using MathJax in order to improve their display. Uncheck the box to turn MathJax off. This feature requires Javascript. Click on a formula to zoom.
Abstract
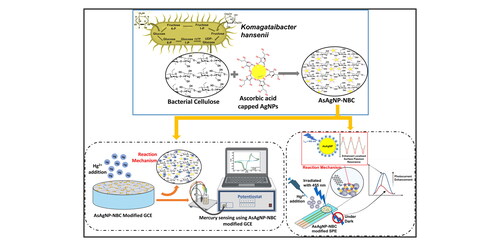
Global health and ecosystem concerns over mercury pollution require stringent monitoring. Herein, we showcase a novel approach for detecting trace Hg2+ ions in water using cyclic voltammetry (CV). Our approach involves modifying glassy carbon electrode (GCE) and screen printed electrode (SPE) surfaces with a nanocomposite of ascorbic acid-capped silver nanoparticles (AsAgNPs) embedded in nanocrystalline bacterial cellulose (AsAgNP-NBC). Analytical techniques confirmed the nanocomposite’s stability and morphological characteristics, exhibiting high accuracy within a linear range of 10 nM to 1 µM Hg2+ and a low limit of detection (LOD) of 3.531 nM. Additionally, on irradiation with 455 nm light source, AsAgNP-NBC modified SPE displayed a remarkable 9.6 times enhanced photocurrent, achieving an LOD of 3.95 pM, and enhanced photoresponsivity of 55.2 mA W−1, showcasing its potential for ultra-trace level detection. This cost-effective and biocompatible nanocomposite presents a promising alternative to conventional analytical methods for selective detection of trace Hg2+ ions in environmental samples.
Graphical Abstract
1. Introduction
Extensive growth in industrialization has led to an increase in heavy metal pollution in natural water sources. Heavy metals such as mercury, lead, arsenic, cadmium, and chromium pose substantial threats to human health when present in elevated concentrations in consumable water sources [Citation1]. Notably, mercury stands out as one of the most toxic and volatile heavy metals in the environment [Citation1]. A few centuries ago, the concentration of mercury in water was within permissible limits i.e. 2 ppb as recommended by the US Environmental Protection Agency (EPA) and 6 µg/L by the World Health Organization (WHO) [Citation2,Citation3]; nevertheless, due to extensive anthropogenic activities the concentration of mercury in environment has exceeded this limit [Citation4] European Water Framework Directive has listed mercury as a precarious dangerous pollutant. Mercury, particularly toxic and volatile, requires sensitive detection methods such as Inductively Coupled Plasma Mass Spectroscopy (ICP-MS) and Atomic Absorption Spectroscopy (AAS) due to its low concentration in environmental samples. However, these traditional methods are costly and labor-intensive, prompting exploration into alternative approaches. In this context, nanomaterial-based sensors have been researched and developed extensively in the last decade as a substitute for traditional detection methods [Citation5]. Nanomaterial-based electrochemical detection of trace amount of mercury is being successfully used. Anodic Stripping Voltammetry (ASV) is a recommended method by the EPA [Citation6]. Electrochemical detection methods have proven advantageous by being simpler, sensitive, and cost-effective compared with conventional analytical techniques. Electrochemical techniques such as voltammetry and amperometry have been successfully employed for the detection and recovery of the toxic heavy metal ion, hexavalent chromium from water samples by using a novel, biologically inspired microcyclic molecule [Citation7] (ref). Gold/Titanium/chitosan nanoparticles modified electrode has been reported for mercury detection with an LOD value of 1nM [Citation8]. Additionally, different metal nanomaterial (e.g. Silver nanoparticles) based nanocomposites with carbon nanotubes are also increasingly being used for the detection of different analytes electrochemically [Citation9,Citation10] (refs). Different natural polymers like cellulose and chitosan are also being explored for designing platforms for heavy metal detection. Cellulose-based platforms are being reported for the detection of heavy metals recently [Citation11].
Bacterial cellulose (BC) is a nanoscale biopolymer produced by certain bacterial species. It has an added advantage over plant cellulose as it is free from impurities like hemicellulose and lignin. Further, BC possesses numerous features like high crystalline nature [Citation12], a high degree of polymerization [Citation13] and a high specific area [Citation14]. Further BC also offers high thermal stability and chemical and mechanical defiance. BC has foreshadowed synthetic polymers due to its biocompatibility and biodegradability [Citation15]. Thus, the excellent properties of BC permit its use in paper-based sensors with electrochemical detection methods [Citation16,Citation17]. Electrochemical sensors are being implemented in environmental monitoring [Citation18], clinical monitoring and food-quality checks [Citation19]. The electrochemical detection technique utilizes disposable, imprintable, low-cost electrodes, with features that allow rapid detection and high sensitivity [Citation20]. The electrochemical analysis is based on measurable signals namely voltammetric, impedimetric, potentiometric and amperometric [Citation21]. Advances in electrochemical techniques highlight the exploration of innovative working electrodes or their alterations with different nanomaterials [Citation22]. In recent times, screen-printed electrodes (SPEs) have gained popularity over glassy carbon electrodes (GCE) as they offer several advantages such as cost-effectiveness, small size, ease of transport, disposable nature and capability for mass production [Citation23]. Silver nanoparticles (AgNPs) have demonstrated remarkable electrocatalytic activity for various analytes due to their unique electronic and catalytic properties arising from their size-dependent quantum effects [Citation19,Citation24,Citation25].
SWS voltametric application with GCE was used in the detection of pencycuron fungicide in commercial formulation. Further its selectivity was reported to be satisfactory in the presence of other interfering molecules like other pesticides [Citation26]. Additional report on the detection of the ophthalmic drug,proparacaine using multiwalled carbon nanotube paste electrode by square wave stripping voltametry, werein proparacaine has exhibited a single anodic irreversible peak at around +900mV, with a detection limit of 0.11 mg/L [Citation10]. Furthermore, a novel electrochemical detection method wherein cobalt(II) tetramide beniziamidizole phthalocyanine on GCE was used in the detection of mercury(II) in nanomolar concentration, in which polymeric film electrode depicted sensitivity of 1.2178 µA nM−1 cm−2 for the detection of Hg2+ in the linear range 10–300 nM [Citation27].
This study introduces a novel electrochemical sensor using a composite material of ascorbic acid-functionalized silver nanoparticles (AsAgNPs) and nanocrystalline bacterial cellulose (NBC) for detecting Hg2+ ions in water. The incorporation of AsAgNPs into the NBC matrix enhances mercury sensing capabilities. BC crosslinked with AsAgNPs forms water-insoluble complexes capable of binding and reducing mercury, facilitating its electrochemical detection at significantly lower concentrations than conventional methods. The oxidation-reduction process is monitored electrochemically, with visible light irradiation further enhancing the photocatalytic activity of AsAgNPs for mercury detection on AsAgNP-NBC modified screen-printed electrode chips. Results indicate a 1.9-fold increase in current compared to non-irradiated electrodes, suggesting potential applications for detecting ultra-trace levels of mercury in environmental samples.
The change in this oxidation-reduction process is monitored electrochemically. Additionally, the detection process is replicated on AsAgNP-NBC modified screen-printed electrode chips with irradiation using visible light (455 nm) to enhance the photocatalytic activity of the AsAgNPs towards the detection of mercury. The results demonstrate a 1.9-fold enhancement in the current as compared to non-irradiated electrodes. This phenomenon can be further explored for the detection of ultra-trace levels of mercury from environmental samples.
2. Experimental section
2.1. Materials and reagents
High-purity analytical grade chemicals and Milli-Q grade water were used throughout the experiments. Sodium hydroxide (NaOH), Sulphuric acid (H2SO4), Mercuric Chloride (HgCl2), Silver nitrate (AgNO3) and L-Ascorbic Acid (Vitamin-C) were purchased from Sigma Aldrich and used without further purification unless otherwise specified. All the glassware used during the experiments was of borosilicate material and were thoroughly cleaned with aqua regia and distilled water before use.
2.2. Methodology
2.2.1. Fermentative production of bacterial cellulose
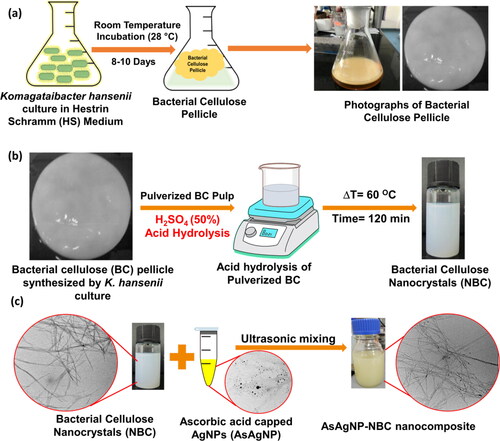
The bacterial strain viz., Komgataeibacter hansenii MCM B-967 was cultivated in Hestrin-Schramm agar (HS) medium for 3 d at room temperature (25 ± 3 °C). A single colony of K. hansenii was transferred to sterile HS media (2.0% D-glucose, 0.5% peptone, 0.5% yeast extract, 0.27% Na2HPO4, and 0.115% citric acid, pH 5.0). The culture flask was incubated at room temperature (25 ± 3 °C) under static conditions for 8–10 d. The bacterial cellulose (BC) pellicles formed at the air-liquid interface were separated from the culture media after the incubation period. Further, the pellicle was treated with 2% NaOH at 100 °C for 30 min. The pellicle was then repeatedly washed with hot distilled water until the pH of the water was neutral. Pellicles were then stored in 0.2% sodium azide solution in a refrigerator until further use [Citation28].
2.2.2. Synthesis of nanocrystalline bacterial cellulose
For the synthesis of nanocrystalline bacterial cellulose (NBC), the BC pellicles were disintegrated in a blender and subjected to acid hydrolysis. For acid hydrolysis, 40 g BC (wet weight) was hydrolyzed in 200 mL of 50% H2SO4 according to a previous report [Citation29]. The temperature of the mixture was maintained at 75 °C under constant stirring conditions for 2 h until a turbid homogenous mixture was formed. The reaction was instantaneously terminated by adding ten volumes of deionized water to the hydrolysis mixture and kept on a cooling ice bath until room temperature (25 ± 3 °C) was achieved [Citation30]. The residual acid component of the reaction was removed by centrifugation at 13,000 rpm for 15 min. Washing-centrifugation cycles were repeated until neutral pH was attained. The NBC was lyophilized to obtain a dry powder.
2.2.3. Synthesis of ascorbic acid capped silver nanoparticles
The protocol for the synthesis of silver nanoparticles was adopted as described by Pandey et al. [Citation31]. The synthesis was carried out by dissolving 5 mM AgNO3 in 100 mL milli-Q water under constant stirring conditions (500 rpm) at 25 ± 3 °C. To this mixture, 1 mL of freshly prepared methanolic neem chlorophyll extract was added dropwise until the color of the solution turned from colorless to pale green. At this stage, the temperature of the reaction mixture was gradually increased to 60 °C and maintained for 2 h, till a pale yellow color appeared, indicating the reduction of silver nitrate to silver nanoparticles by the chlorophyll present in the neem extract. To this mixture, 0.5 mM of freshly prepared L-ascorbic acid solution was rapidly added to provide capping and stability to the prepared silver nanoparticles [Citation32]. The reaction mixture was kept under stirring conditions until a yellow-brown color was obtained, indicating the formation of ascorbic acid-capped silver nanoparticles, henceforth referred to as AsAgNPs. Dark conditions were maintained throughout the reaction process to prevent the photodegradation of as-synthesized AsAgNPs. The AsAgNPs were stored at 4 °C.
2.2.4. Preparation of AsAgNP-NBC nanocomposite
The physical adsorption method as illustrated in was adopted for the preparation of AsAgNP-NBC nanocomposite [Citation33]. NBC powder was weighed and dispersed in milli-Q water with ultrasonication to achieve a final concentration of 100 mg/mL and the as-synthesized AsAgNPs were added to the slurry of NBC in a ratio of 1:2 and the vial was subjected to mixing (for 18 h) for optimum adsorption of the AsAgNps onto the NBC fibers. The mixture was centrifuged at 6000 rpm for 10 min to remove the unadsorbed AsAgNps and washed with deionized water twice. The dried AsAgNP-NBC nanocomposite was resuspended in milli-Q water to get a final concentration of 1 mg/mL for all further studies.
Figure 1. Schematic illustration of Bacterial cellulose production, acid hydrolysis and Nanocomposite formation.
2.2.5. Preparation of modified electrode
The glassy carbon electrode (GCE) was cleaned by mechanical polishing on a soft polish pad using a slurry of alumina powder of sizes 1, 0.3, and 0.05 µm and ultrasonicated to remove the residual alumina powder, followed by repeated rinsing with deionized water. The GCE was modified by drop-casting 5 µL of the AsAgNP-NBC nanocomposite (1 mg/mL) onto the cleaned electrode surface and drying the electrode at RT under vacuum for 30 min. After drying, the GCE was immediately used to carry out optimization and sensing experiments.
For modification of screen-printed electrode (SPE), a similar procedure was implemented. The working area of the SPE was cleaned with 70% ethanol and 5 µL of the AsAgNP-NBC composite (concentration 1 mg/mL) was drop-cast on the surface. The SPE was dried under a vacuum for 30 min and was immediately used for measurement. A freshly prepared SPE was used for each set of experiments.
2.3. Characterization
The optical properties of the synthesized BC, NBC, AsAgNPs and AsAgNP-NBC nanocomposite were studied using a Jasco V-750 UV-visible spectrophotometer in the range of 190-900 nm. Particle size distribution and zeta potential analysis were performed on the Lite sizer500 (Anton Parr, GmbH) instrument. Nanoparticle shape, size, morphology, and distribution were confirmed by performing transmission electron microscopy (TEM) using a Tecnai 12 G2 Spirit Biotwin instrument. Additionally, chemical structure and functional groups in BC, NBC and Ag-NBC composite were confirmed by Fourier Transform Infrared Spectroscopy (FT-IR) using Shimadzu IRAffinity-1 spectrophotometer with a diamond ATR accessory at room temperature. To assess the thermal stability of the prepared cellulose and nanocomposite materials, Thermogravimetric analysis (TGA) using a TGA802 Thermogravimetric analyzer coupled with Differential Scanning Calorimetry (DSC) was performed.
2.4. Electrochemical measurements
All electrochemical measurements were carried out at room temperature (25 ± 3 °C) using an electrochemical workstation. The measurements were performed using (a) a three-electrode system comprising of a glass carbon working electrode (WE), platinum wire counter electrode (CE) and a standard Ag/AgCl reference electrode (RE) and; (b) carbon Screen Printed Electrodes (SPE- DRP 110) procured from Metrohm DropSens Pvt. Ltd. The GCE has an outer diameter of 6.35 mm and electrode diameter of 3 mm. The disposable SPEs consisted of a ceramic substrate of dimensions 3.4 × 1.0 × 0.4 cm with a WE (4 mm dia); silver as RE and carbon as the auxiliary material. Cyclic Voltammetry (CV) measurements were performed at a varying potential range applied in both forward and reverse directions between −1.0 to +1.0 V to the modified GCE system with a time interval of 0.05 s and a scan rate of 50 mV s−1. Similarly, Differential Pulse Voltammetry (DPV) measurements were performed between a potential of 0–0.3 V with a step size of 0.003 V and amplitude of 0.01 V. A pulse width of 0.05 s was adopted over a period of 0.1 s.
2.4.1. Mercury sensing on GCE
The interaction of Hg2+ with the AsAgNP-NBC modified GCE was measured in terms of the oxidation and reduction peak currents in Cyclic Voltammetry (CV). Working standard solutions of mercury were prepared in the concentration range of 0.025 nM–1 µM and electrochemical measurements were performed for each concentration. All the reactions were performed in a phosphate buffer with pH 8. A fresh modified electrode was prepared by the drop-casting method described in Section 2.2.5 for each set of measurements.
2.4.2. Photocurrent enhancement with modified SPE
Peak current responses for mercury sensing using the AsAgNP-NBC modified SPE were also analysed under illumination with single wavelength visible light (455 nm). CV and DPV voltammograms were recorded with and without irradiation at room temperature and the current and voltage responses were measured.
3. Results and discussion
3.1. Characterization of BC, NBC, AsAgNP and AsAgNP-NBC composite
shows the characterization data for the prepared BC, NBC, AsAgNPs and AsAgNP-NBC nanocomposite. The UV-visible spectra of the prepared NBC (black), AsAgNPs (blue) and AsAgNP-NBC nanocomposite (orange) are depicted in . There is an absence of spectral bands in the NBC sample, however, after the physical adsorption of AsAgNPs onto the NBC matrix, the spectral features of the AsAgNP-NBC nanocomposite change [Citation34]. A broad hump appears in the region of 400-430 nm in the AsAgNPs-NBC nanocomposite spectra. The slight shift and suppression in the absorbance peak of silver nanoparticles can be attributed to the adsorption of AsAgNPs on the NBC matrix. The as-synthesized AsAgNPs (blue dotted) show a typical, sharp SPR peak with an absorption maxima at 426 nm, which indicated the formation of polydispersed, spherical silver nanoparticles in the range of 10–20 nm. Ascorbic acid plays a major role in the size reduction and stabilization of silver nanoparticles [Citation34]. Additionally, the absorption peak present between 220 and 230 nm in both AsAgNPs and AsAgNP-NBC nanocomposite is the characteristic peak for dehydroascorbic acid which is the oxidized form of ascorbic acid indicating the surface functionalization of AgNPs with ascorbic acid [Citation35].
Figure 2. Bacterial cellulose, nanomaterials and composite characterization (a) UV-Visible absorbance spectra;(b) FTIR spectra, TEM Micrographs of (c) NBC (Inset: unhydrolyzed Bacterial cellulose (BC)), and (d) AsAgNP-NBC blend (Inset: Zoomed in image of embedded AsAgNPs in the NBC matrix).
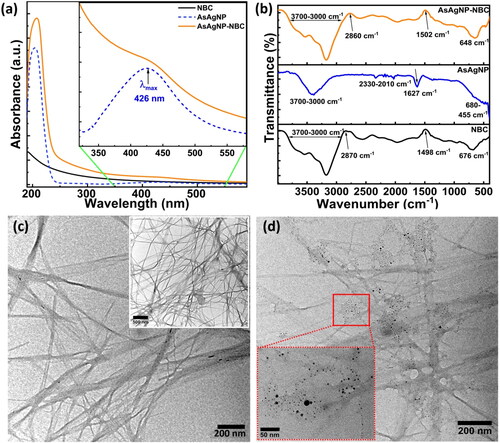
The FT-IR spectra of AsAgNPs (blue), NBC (black) and AsAgNPs-NBC (orange) is represented in . As depicted in the NBC spectrum, there are leading signals in the range of 3200–3500cm−1 that indicate stretching of intermolecular and intermolecular hydrogen bonds and hydroxyl groups. Peaks at 3242 cm−1 and 750 cm−1 depict the characteristic allomorphic form of cellulose with Iα and Iβ respectively [Citation1]. The transmittance range of 2870–2900 cm−1 is assigned to C-H stretching, 680–620 cm−1 depicts OH stretching [Citation12]. Further, the FTIR spectra of AsAgNPs shows a characteristic peak at 3400 cm−1 and 1627 cm−1 for O–H and C = C stretching, respectively [Citation36]. Additionally ascorbic acid has a hydroxyl (-OH) group which is represented in the range 3526–2916 cm−1 and the carboxyl group of ester bond (C = O) at 1753 cm−1 are present in which indicates the presence of ascorbic acid on AsAgNPs surface. The FTIR analysis of composite AsAgNP-NBC depicts a prominent broad-spectrum peak in the range of 3200–3500 cm−1 that has a characteristic resemblance to bacterial cellulose. In the AsAgNP-NBC spectrum, a slight shift in the peak (3320 cm−1) is observed, possibly due to silver nanoparticles interfering with the NBC network [Citation14]. The subsequent peaks observed at 3526–2916 cm−1 represents the presence of a capping agent i.e. ascorbic acid. The additional peak observed at 2860 cm−1 can be accredited to symmetrical and asymmetrical stretching of the C-H bond in cellulose [Citation36]. The absorption at wavenumber 1502 cm−1 represents the N-O stretching. FTIR pattern of NBC and AsAgNP-NBC is approximately identical indicating that there is no significant change in NBC chemical structure. Both NBC and AsAgNP-NBC have a broad absorption peak at 3700–3000 cm−1 representing -OH stretching. However, there is a shift in the wavenumber of NBC due to the presence of AsAgNPs.
TEM micrographs of NBC and AsAgNP-NBC composite are represented in respectively, wherein the diameter for NBC fibrils was found to be approximately 20–40 nm. The morphology of BC fibrils as illustrated in the inset of , is smooth with an interlinked network. AsAgNP-NBC shows fragmented fibers and a rough surface, which can be ascribed to the presence of silver nanoparticles binding on the surface (). The length and diameter of the NBC fibers are reduced in comparison to BC fibers (S1 (a–d)). The inset of and S1 (e & f) represents the formation of spherical AgNPs uniformly distributed over the nanocellulose fiber with diameters of approximately 12 ± 2.8 nm. The small size of the AsAgNPs may be attributed to reduction with the neem extract [Citation31]. In addition, ascorbic acid plays the dual role of further reducing the silver nanoparticles to a uniform, small size, their capping and stabilization [Citation37].
Thermal stability and the heat capacity of the AsAgNP-NBC composite are illustrated in S2 (a) & (b) respectively. The plot in black features NBC whereas the plot in orange color represents the AsAgNP-NBC composite. The initial stage of minor weight loss started at 100 °C, possibly due to residual moisture in the NBC matrix [Citation13]. Further major degradation between 240 °C and 450 °C is attributed to nano cellulose and carbonic residue degradation [Citation38]. AsAgNP-NBC plot depicts the initial weight loss at 390 °C which may be due to the degradation of cellulosic and organic content present in the composite, further, the major weight loss was obtained at 800 °C, ascertaining greater thermal stability due to the addition of ascorbic acid-functionalized silver nanoparticles over NBC [Citation15,Citation39].
3.2. Mercury sensing using AsAgNP-NBC modified GCE
Hg2+ ions were monitored by recording the changes in oxidation-reduction peaks arising from AsAgNP-NBC-modified GCE with increasing mercury concentrations. depicts the schematic representation of the electrode modification process by the AsAgNP-NBC nanocomposite. Various aspects of the redox process, the presence of reaction intermediates, quantification of analyte levels, and the assessment of the stability of reaction products were investigated with the AsAgNP-NBC modified GCE. To achieve the best performance in detecting Hg2+, studies were conducted to establish the relationship between the oxidation peak current and various experimental factors such as pH, analyte concentration and scan rate as represented in Figure S3.
Figure 3. Optimization on three electrode system(a) Schematic of the 3-electrode system/set-up and electrode modification, (b) CV depicting detection of Hg2+ by the AsAgNP-NBC modified GCE at varying Hg2+ concentration from 10 nM to 2 µM, (c) Anodic region zoomed showing a shift in the anodic peak on interaction with increasing concentrations of mercury.
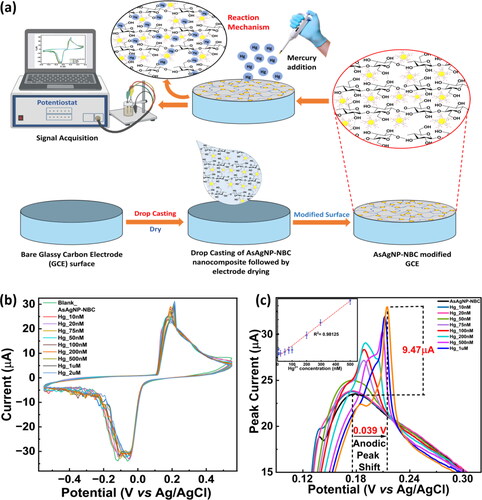
For the detection of Hg2+ a varying potential range was applied to the modified GCE system between −1.0 to +1.0 V in both forward and reverse directions with a time interval of 0.05 s and a scan rate of 50 mV s−1. A sharp anodic peak was observed at 0.176 V which is caused by the oxidation of Hg0 to Hg2+ which reacts with AsAgNP-NBC in the PBS forming an Ag-Hg amalgam, whereas, a broad cathodic peak was observed between −0.05 and −0.12 caused by the reduction of Hg2+ to Hg [Citation40,Citation41]. According to the literature survey, it was found that at alkaline pH, the oxidation-reduction reaction taking place at the modified GCE surface is a two-step reaction with the following probable reaction mechanism [Citation42,Citation43]:
During this process, changes in the measured current as well as a shift in the anodic peak were observed from 0.176 V to 0.215 V as the electrode was exposed to different concentrations of Hg2+. Notably, the peak at 0.176 V diminished with a gradual increase in the peak at 0.215 V while the current increased progressively with increasing Hg2+ concentration. Since Hg2+ has a higher potential value (0.85 V) than silver nanoparticles, Hg can alter the surface plasmon characteristics of the AgNPs, resulting in the formation of an Ag-Hg amalgam [Citation40]. The higher potential value of Hg2+ is also responsible for the observed peak shift in the CV voltammogram.
A calibration plot, as shown in the inset of , revealed a strong linear relationship between the electrochemical response and Hg2+ concentrations ranging from 10 nM to 1 µM, with a coefficient of regression (R2) of 0.98125. The limit of detection (LOD) for Hg2+ ions was found to be 3.531 nM and it was determined by the LOD = 3.3σ/S calculation from the calibration plot generated from the cyclic voltammogram.
3.3. Mercury sensing using AsAgNP-NBC modified SPE
Detection of mercury on the AsAgNP-NBC nanocomposite-modified SPE was carried out by keeping all the experimental parameters similar to those described in Section 2.3. (potential range: −1.0 to +1.0 V; scan rate: 0.5 mV s−1 and time interval: 0.05 s). However, the linear dynamic range of mercury standards was kept at 0.025 nM–10 nM. The results of mercury sensing using AsAgNP-NBC modified SPE with and without irradiation are shown in . After the deposition of the AsAgNP-NBC nanocomposite, the anodic peak current value at 0.073 V was found to be 2.29 µA, which gradually increased with an increase in the Hg2+ ion concentration. The presence of AsAgNPs-NBC nanocomposite matrix immobilized on the electrode surface was found to improve the electrochemical response towards mercury sensing [Citation43]. After the addition of Hg2+ ions from 0.025 nM to 10 nM the current response between 0.08 and 0.116 V increased linearly from 3.53 to 35.43 µA. Upon calculation using the LOD = 3.3σ/S formula, the limit of detection for non-irradiated samples was found to be 0.009741 nM (9.741 pM) within a linear range of 0.025 nM–0.5 nM.
Figure 4. Photocurrent enhancement on modified SPE: (a) Schematic representation of the modified SPE and Photocurrent enhancement experiment; (b) CV measurements on AsAgNP-NBC modified SPE chip irradiated with 455 nm light source (Inset: Calibration plot representing oxidation signals measured on SPE irradiated with 455 nm light source with varying Hg2+ concentration (0.025–10 nM); (c) Comparative CV measurement of10nM Hg2+ on AsAgNP-NBC modified SPE chip with (Blue color) and without (Green color) irradiation, and (d) Anodic and Cathodic peak current comparison showing enhancement in peak currents after irradiation with 455 nm light.
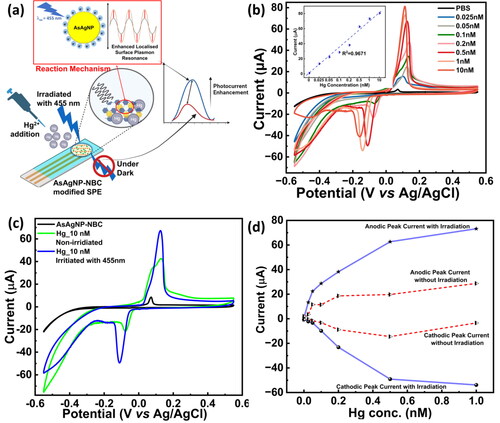
To study the effect of irradiation on the sensing capability of the AsAgNP-NBC modified SPE, it was illuminated with a light source of wavelength 455 nm as shown by the schematic in . It was observed that the anodic peak current showed a significant enhancement under illuminated conditions. As depicted in , the peak current value of the irradiated modified SPE at 0.072 V was found to be 3.38 µA and on addition of Hg2+ ions from 0.025 nM to 10 nM the current response between 0.08 to 0.116 V increased linearly from 15.42 to 81.23 µA with R2 = 0.9671. By using the protocol for irradiation of the AsAgNP-NBC modified SPE with a light source we achieved a significant improvement in the limit of detection, which was found to be 0.00395 nM (3.95 pM) within the prescribed linear range. depicts the change in current for the detection of Hg2+ at 10 nM without and with irradiation. The peak current values for the highest Hg2+ concentration of 10 nM for non-irradiated and irradiated conditions were found to be 42.62 and 81.23 µA respectively, which indicated a 1.9-fold enhancement in the peak current. elucidates the comparative anodic and cathodic peak current values without and with irradiation by visible light (455 nm). The photocurrent enhancement phenomenon taking place in the AsAgNPs contributes to the improvement in LOD. The photocurrent enhancement can be possibly explained by taking into consideration the surface plasmon resonance properties of AgNPs and the photochemical properties of ascorbic acid. The irradiation of AsAgNPs with 455 nm light can enhance the photocurrent due to the excitation of localized plasmons on the nanoparticle surface, creating electron-hole pairs and leading to increased flow/movement of electrons in the photo-electrochemical system [Citation44,Citation45]. Additionally, ascorbic acid used to functionalize AgNPs also acts as an electron donor promoting charge transfer between the AgNPs and Hg2+.
Additionally, the photoresponsivity of the detection system was calculated as described in the supplementary file [Citation46,Citation47]. The comparison between photoresponsivity values of bare and AsAgNP-NBC modified SPE is shown in . The photoresponsivity of bare SPE was found to be 8.7 × 10⁻² mA W−1 whereas, AsAgNP-NBC modified SPE demonstrated an amplified photoresponsivity value of 55.2 mA W−1 which is quite comparable with other nanomaterial modified SPE detection systems [Citation47,Citation48] The photoresponsivity values correlate with the photocurrent enhancement values on bare and modified SPE with a 9.6-fold increase in photocurrent for AsAgNP-NBC modified SPE. The amplification in photocurrent and photoresponsivity is presumably due to the localised surface plasmonic field of the silver nanoparticles and high light scattering which results in the superior performance of the AsAgNP-NBC modified SPE detection system [Citation49]. This enhanced photocurrent and photoresponsivity phenomena can be harnessed to fabricate a portable electrochemical sensor device with improved detection and quantification limits towards ultra-trace level detection (Pico to Femto Molar range) of environmental pollutants.
Table 1. Comparison between anodic peak current, photocurrent enhancement and photoresponsivity of bare and modified SPE.
3.4. Differential pulse voltammetric measurements and effect of interfering ions
The analytical performance of the AsAgNP-NBC modified electrodes was further evaluated using DPV, which is a highly sensitive electrochemical method, as depicted in . The modified electrodes displayed a narrow linear correlation between the stripping peak current and Hg2+ ion concentration under optimized working experimental conditions. The method demonstrated a reasonably good limit of detection (LOD), estimated as three times the signal-to-noise ratio [Citation50]. Without irradiation, the sensing system exhibited a gradual increase in peak current with an increase in the Hg2+ concentration. and the peak current showed a linear response within a lower linear range of 25 pM–500 pM. The LOD for non-irradiated samples was found to be 5.899 pM. However, when the same experiments were conducted under illumination with 455 nm light source, the AsAgNP-NBC modified SPE as illustrated in , there was a significant enhancement in the analytical performance. The modified SPEs exhibited good sensitivity in two linear ranges as 25–1000 pM and 1–50 nM. The LOD value was found to be 2.727 pM for the 25–1000 pM range, which was two times lower, and a 2.5-fold increase in the peak current signalling higher sensitivity of detection. The comparative analytical performance of the AsAgNP-NBC modified systems (GCE & SPE) with and without illumination is documented in . Furthermore, the calibration plots for DPV measurements are provided in the Figure S4 of the supplementary dataset.
Figure 5. DPV measurements and selectivity experiments: (a) DPV measurements on AsAgNP-NBC modified SPE chip irradiated with 455 nm light source (Linear Range: 25 pM–50 nM) (b) DPV measurements on AsAgNP-NBC modified SPE chip without irradiation (Linear Range: 25 pM–50 nM), and (c) CV measurements conducted for interfering ions (Interfering metal ions concentration- 100 nM; Hg2+ concentration- 10 nM).
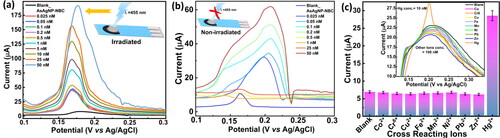
Table 2. Analytical data of the proposed sensing system with respect to CV and DPV measurements.
We believe that the improved linearity at lower Hg2+ ion concentration and the enhanced LOD achieved with AsAgNP-NBC modified electrodes can be attributed to an increased amount of surface-bound ligands, facilitating Hg2+ adsorption [Citation51,Citation52]. This, in turn, leads to enhanced stripping currents, aligning the findings from CV & DPV as discussed in the previous sections. Furthermore, this improvement in linearity at higher analyte concentrations without electrode fouling is due to the additional stability provided by the nanocrystalline bacterial cellulose matrix. However, saturation above the prescribed limits in the SPE may be attributed to the saturation of surface sites, and the availability of lesser reaction area in the SPE’s, a well-known factor that can cause deviations from linearity [Citation51].
To evaluate the selectivity, we assessed the susceptibility of the sensor to interference from various species when detecting Hg2+. Specifically, we examined the influence of common interfering ions typically present alongside Hg2+ in water samples, including Co2+, Cu2+, Cr6+, Pb2+, Ni2+, Fe2+, Mn2+ and Zn2+. As evident from , it can be concluded that none of these ions had a noticeable impact on the Hg2+ detection process. The results explicitly demonstrate that the AsAgNP-NBC modified GCE exhibits outstanding selectivity towards the determination of Hg2+ ions. In practical terms, the selectivity of the sensor remains robust, allowing for reliable Hg2+ determination in the presence of various coexisting ions commonly found in water samples.
4. Conclusion
We have established a methodology to identify exceedingly low concentrations of Hg2+ ions in aqueous solutions through cyclic voltammetry, employing an AsAgNP-NBC modified glassy carbon electrode. Additionally, the AsAgNP-NBC modified screen-printed electrode has also been employed with photocurrent enhancement to increase the portability and applicability of the sensing model for on-site samples. This method is well-suited for regular environmental surveillance and evaluating the quality of drinking water, utilizing a single-use screen-printed electrode. Our approach boasts a remarkable limit of detection, registering at 3.95 pM using CV measurements under irradiation within a linear range of 0.025 nM–1 µM and an LOD of 2.717 pM using DPV with a linear range of 0.025–50 nM. The reported LOD values are lower than the permissible limit of 10 nM for inorganic mercury in drinking water as prescribed in the US-EPA guidelines, signifying that the proposed sensing system can be efficiently used for the selective electrochemical detection of mercury from water and wastewater sources.
CRediT author statement
Pooja Deshpande: Conceptualization, data curation & interpretation, draft writing, and draft editing. Shashwati Wankar: Conceptualization, experimental design & study, data curation, visualization & interpretation, original draft writing. Rutuja Gumathannavar: Experimental study, data interpretation. Snehal Kulkarni: Resources, draft editing. Yogesh Jadhav: Experimental design, draft writing, proof reading and editing. Yogesh Patil: Review of draft. Jyutika Rajwade: Resources, data validation, final review, and draft editing. Atul Kulkarni: Conceptualization, project administration, resources, data validation, final review, and draft editing.
Supplementary information.docx
Download MS Word (3.9 MB)Acknowledgements
The authors wish to thank Symbiosis International (Deemed University) for financial support.
Disclosure statement
No potential conflict of interest was reported by the author(s).
Data availability statement
Data will be made available upon request.
Additional information
Notes on contributors
Pooja Deshpande
Pooja Deshpande has 8 years of experience with specialization in nano materials and pharmaceutical finished products specifically in quality control. She has completed her Master’s in biotechnology and currently pursuing her PhD in nanotechnology. She has published a patent for nanoparticle synthesis with unique features. She was actively involved in development of a device based on microcontroller processing for detection of heavy metals. She is currently working as a business analyst with Pfizer on Clinical Supplies and Distribution Platform. She has profound knowledge in clinical data management and clinical trial documentation.
Shashwati Wankar
Shashwati Wankar has 6 years of experience in the field of environmental microbiology and environmental monitoring with specialization in environmental impact assessment (EIA) studies. She completed her Master’s in microbiology and pursuing PhD in interdisciplinary sciences from Symbiosis Centre for Nanoscience and Nanotechnology (SCNN), Symbiosis International (Deemed University). Her research interests are towards development of novel nano-biopolymeric platforms for the detection and remediation of environmental pollutants.
Rutuja Gumathannavar
Rutuja Gumathannavar is a Research Assistant with Symbiosis Centre for Nanoscience and Nanotechnology (SCNN), Symbiosis International (Deemed University). Her research interests are towards the utilization of novel nanofabrication techniques, to develop Functional Nanostructures for diverse biomedical diagnostic applications.
Snehal Kulkarni
Snehal Kulkarni completed her Master’s in Microbiology from the Government Institute of Science, Aurangabad. She was a lecturer (CHB) at Shivchhatrapati College, Aurangabad and Badrinarayan Barwale College, Jalna. After the award of the DBT-JRF fellowship and GATE, she joined Agharkar Research Institute, Pune, on a DBT-sponsored project in 2020. Currently, she is pursuing PhD under the guidance of Dr. Jyutika M. Rajwade in the Nanobioscience group at ARI. Her current research focuses on the development of rapid point of care devices for the detection of antibiotic resistant bacteria.
Yogesh Jadhav
Yogesh Jadhav is currently working as Assistant Professor at Symbiosis Centre for Nanoscience and Nanotechnology (SCNN), Symbiosis International (Deemed University), Pune. He was awarded with DST INSPIRE Fellowship for Pursuing his Ph.D. in Physical Chemistry (2018) from SPPU, Pune. He has worked as Scientist C in National Centre for Nanoscience and Nanotechnology Mumbai University, (2019). His research is focused on Semiconductor Nanocrystals/Quantum dot Synthesis, Biomedical studies, Healthcare POCs, Biosensors, Bioimaging, Electrochemistry for energy harvesting and storage devices.
Yogesh Patil
Yogesh Patil holds a Ph.D. in Microbial Sciences from Agharkar Research Institute, Pune, and the University of Pune, India. With over 20 years of expertise in Environmental Science, he specializes in biodetoxification, bioreduction, and biosorption of hazardous materials. His research delves into resource recovery from waste, life cycle assessment, water quality, and sustainable waste management strategies. He’s published 60+ papers in renowned journals, authored books, and edited works on bioremediation and climate change’s impact on water management. Notable for three patents, he’s led multiple research projects funded by UGC, IFS Sweden, and OPCW. Recipient of prestigious awards like DST-JRF, CSIR-SRF, and UGC-Post Doctoral Fellowship, he serves as a reviewer for Scopus and SCI indexed journals. Currently, as Professor and Head of Research at SCRI, SIU, he continues to drive impactful environmental research and publications.
Jyutika Rajwade
Jyutika Rajwade is currently working as Scientist F in ARI, Pune and, also associated with Symbiosis International (Deemed) University, Lavale Pune, as a member of the Research Advisory Committee in Biotechnology. Post completion of her Master’s in Industrial Microbiology she joined MACS for doctoral studies, worked on metal-microbe interactions, and was awarded a Ph.D. in 1997. After completing her doctoral studies, she worked as a CSIR research associate at Agharkar Research Institute, Pune and as a teaching research associate at the Department of Biotechnology, Pune University. For the past 17 years, she has been working as a research scientist in the Nanobioscience group in applications of Microbiology and Biotechnology in Nanobioscience, medicines, agriculture and the environment. Working with Ph.D. scholars has led to patents and research publications in scientific journals of international repute. She is a member of professional societies like the Biotech Research Society of India (BRSI), the Indian Society for Cell Biology (ISCB), Association of Microbiologists of India (AMI).
Atul Kulkarni
Atul Kulkarni presently serves as the Research Professor and Director at Symbiosis Centre for Nanoscience and Nanotechnology (SCNN), part of Symbiosis International (Deemed University) in India. Previously, he held positions at Sungkyunkwan University (SKKU), South Korea, under Brain Korea Plus (BK21+) and Brain Pool fellowships. He earned his MS in 1995 from the University of Pune’s Department of Instrumentation Science and completed his Ph.D. in Physics from the same university in 2005. With over 17 years of industrial experience pre-Ph.D., he embarked on a postdoctoral fellowship at SKKU in December 2006. Dr. Kulkarni’s research centers on multidisciplinary Nano biosensor development and boasts a portfolio of over 90 published papers in international journals alongside 13 patents across Korean, US, and PCT jurisdictions.
References
- Sheikhzadeh E, Naji-Tabasi S, Verdian A, et al. Equipment-free and visual detection of Pb2+ ion based on curcumin-modified bacterial cellulose nanofiber. J Iran Chem Soc. 2022;19(1):283–290. doi: 10.1007/s13738-021-02305-w.
- Souza-Araujo J, Giarrizzo T, Lima MO, et al. Mercury and methyl mercury in fishes from bacajá river (Brazilian amazon): evidence for bioaccumulation and biomagnification. J Fish Biol. 2016;89(1):249–263. doi: 10.1111/jfb.13027.
- Anderson C, Kath H, Colquhoun D. 4P-0951 recommended fish intake is potentially dangerous due to high methylmercury content of certain fish. Atheroscler Suppl. 2003;4(2):283. doi: 10.1016/S1567-5688(03)91209-8.
- Lisha, K. P., Pradeep, T., Anshup. Towards a practical solution for removing inorganic mercury from drinking water using gold nanoparticles.Gold Bull. 2009;42(2):144–152. doi: 10.1007/BF03214924.
- Xu X, Yang S, Wang Y, et al. Nanomaterial-based sensors and strategies for heavy metal ion detection. Green Anal Chem. 2022;2:100020. doi: 10.1016/j.greeac.2022.100020.
- CD-ROM. 7472-2 Revision 0. 1996. https://www.epa.gov/sites/default/files/2015-12/documents/7472.pdf
- Aralekallu S, Palanna M, Hadimani S, et al. Biologically inspired catalyst for electrochemical reduction of hazardous hexavalent chromium. Dalton Trans. 2020;49(42):15061–15071. doi: 10.1039/d0dt02752a.
- Zhou L, Xiong W, Liu S. Preparation of a gold electrode modified with Au–TiO2 nanoparticles as an electrochemical sensor for the detection of mercury(II) ions. J Mater Sci. 2014;50(2):769–776. doi: 10.1007/s10853-014-8636-y.
- Anshori I, Nuraviana Rizalputri L, Rona Althof R, et al. Functionalized multi-walled carbon nanotube/silver nanoparticle (f-MWCNT/AgNP) nanocomposites as non-enzymatic electrochemical biosensors for dopamine detection. Nanocomposites. 2021;7(1):97–108. doi: 10.1080/20550324.2021.1948242.
- Demir E, İnam O, İnam R. Determination of ophthalmic drug proparacaine using multi-walled carbon nanotube paste electrode by square wave stripping voltammetry. Anal Sci. 2018;34(7):771–776. doi: 10.2116/analsci.17P589.
- Langari MM, Antxustegi MM, Labidi J. Nanocellulose-based sensing platforms for heavy metal ions detection: a comprehensive review. Chemosphere. 2022;302:134823. doi: 10.1016/j.chemosphere.2022.134823.
- Czaja W, Romanovicz D, Brown R M Structural investigations of microbial cellulose produced in stationary and agitated culture. Cellulose. 2004;11(3/4):403–411. doi: 10.1023/b:cell.0000046412.11983.61.
- Watanabe K, Tabuchi M, Morinaga Y, et al. Structural features and properties of bacterial cellulose produced in agitated culture. Cellulose. 1998;5(3):187–200. doi: 10.1023/A:1009272904582.
- Kim DY, Nishiyama Y, Kuga S. Surface acetylation of bacterial cellulose. Cellulose. 2002;9(3/4):361–367. doi: 10.1023/A:1021140726936.
- Panaitescu DM, Frone AN, Chiulan I, et al. Structural and morphological characterization of bacterial cellulose nano-reinforcements prepared by mechanical route. Mater Des. 2016;110:790–801. doi: 10.1016/j.matdes.2016.08.052.
- Wang P, Wang M, Zhou F, et al. Development of a paper-based, inexpensive, and disposable electrochemical sensing platform for nitrite detection. Electrochem Commun. 2017;81:74–78. doi: 10.1016/j.elecom.2017.06.006.
- Cinti S, Basso M, Moscone D, et al. A paper-based nanomodified electrochemical biosensor for ethanol detection in beers. Anal Chim Acta. 2017;960:123–130. doi: 10.1016/j.aca.2017.01.010.
- D’Halluin M, Rull-Barrull J, Bretel G, et al. Chemically modified cellulose filter paper for heavy metal remediation in water. ACS Sustainable Chem Eng. 2017;5(2):1965–1973. doi: 10.1021/acssuschemeng.6b02768.
- Aravind A, Sebastian M, Mathew B. Green synthesized unmodified silver nanoparticles as a multi-sensor for Cr(iii) ions. Environ Sci. 2018;4(10):1531–1542. doi: 10.1039/C8EW00374B.
- El-Raheem HA, Hassan RYA, Khaled R, et al. New sensing platform of poly(ester-urethane)urea doped with gold nanoparticles for rapid detection of mercury ions in fish tissue. RSC Adv. 2021;11(50):31845–31854. doi: 10.1039/d1ra03693a.
- Chang BY, Park SM. Electrochemical impedance spectroscopy. Annu Rev Anal Chem. 2010;3(1):207–229. doi: 10.1146/annurev.anchem.012809.102211.
- Yousf N, Ouda E, Magar HS, et al. Synthesis, characterization, and electrochemical sensing applications of bimetallic oxide/carbon nanomaterials hybrids. J Electrochem Soc. 2022;169(4):047518. doi: 10.1149/1945-7111/ac6458.
- García-Miranda Ferrari A, Rowley-Neale SJ, Banks CE. Screen-printed electrodes: transitioning the laboratory in-to-the field. Talanta Open. 2021;3:100032. doi: 10.1016/j.talo.2021.100032.
- Qin Y, Ji X, Jing J, et al. Size control over spherical silver nanoparticles by ascorbic acid reduction. Colloids Surf A Physicochem Eng Asp. 2010;372(1-3):172–176. doi: 10.1016/j.colsurfa.2010.10.013.
- Aravind A, Sebastian M, Mathew B. Green silver nanoparticles as a multifunctional sensor for toxic cd(ii) ions. New J Chem. 2018;42(18):15022–15031. doi: 10.1039/C8NJ03696A.
- Acer S, Demir E, İnam R. Square wave voltammetric determination of pencycuron fungicide and application to commercial formulation. Food Measure. 2020;14(4):2099–2107. doi: 10.1007/s11694-020-00457-6.
- Palanna M, Aralekallu S, Keshavananda Prabhu CP, Sajjan VA, Mounesh, Sannegowda LK. Nanomolar detection of mercury(II) using electropolymerized phthalocyanine film. Electrochim Acta. 2021;367:137519. doi: 10.1016/j.electacta.2020.137519.
- Kumbhar JV, Rajwade JM, Paknikar KM. Fruit peels support higher yield and superior quality bacterial cellulose production. Appl Microbiol Biotechnol. 2015;99(16):6677–6691. doi: 10.1007/s00253-015-6644-8.
- Arserim-Uçar DK, Korel F, Liu LS, et al. Characterization of bacterial cellulose nanocrystals: effect of acid treatments and neutralization. Food Chem. 2021;336:127597. doi: 10.1016/j.foodchem.2020.127597.
- Khan H, Kadam A, Dutt D. Studies on bacterial cellulose produced by a novel strain of lactobacillus genus. Carbohydr Polym. 2020;229:115513. doi: 10.1016/j.carbpol.2019.115513.
- Pandey P, Deshpande P, Shirolkar MM, et al. Augmented Listeria monocytogenes biofilm architecture disruption and synergistic effect of antibiotics on bacterial species by biosynthesized silver nanoparticles. ChemistrySelect. 2021;6(8):1782–1786. doi: 10.1002/slct.202004687.
- Chekin F, Ghasemi S. Silver nanoparticles prepared in presence of ascorbic acid and gelatin, and their electrocatalytic application. Bull Mater Sci. 2014;37(6):1433–1437. doi: 10.1007/s12034-014-0093-3.
- Srivastava P, Lakshmi GBVS, Sri S, et al. Potential of electrospun cellulose acetate nanofiber mat integrated with silver nanoparticles from azadirachta indica as antimicrobial agent. J Polym Res. 2020;27(11):350. doi: 10.1007/s10965-020-02308-w.
- Song S, Liu Z, Abubaker MA, et al. Antibacterial polyvinyl alcohol/bacterial cellulose/nano-silver hydrogels that effectively promote wound healing. Mater Sci Eng C Mater Biol Appl. 2021;126:112171. doi: 10.1016/j.msec.2021.112171.
- Gómez Ruiz B, Roux S, Courtois F, et al. Spectrophotometric method for fast quantification of ascorbic acid and dehydroascorbic acid in simple matrix for kinetics measurements. Food Chem. 2016;211:583–589. doi: 10.1016/j.foodchem.2016.05.107.
- Audtarat S, Hongsachart P, Dasri T, et al. Green synthesis of silver nanoparticles loaded into bacterial cellulose for antimicrobial application. Nanocomposites. 2022;8(1):34–46. doi: 10.1080/20550324.2022.2055375.
- Ghosh S, Mondal A. Aggregation chemistry of green silver nanoparticles for sensing of Hg2+ and Cd2+ ions. Colloids Surf A Physicochem Eng Asp. 2020;605:125335. doi: 10.1016/j.colsurfa.2020.125335.
- Ito H, Sakata M, Hongo C, et al. Cellulose nanofiber nanocomposites with aligned silver nanoparticles. Nanocomposites. 2018;4(4):167–177. doi: 10.1080/20550324.2018.1556912.
- Zhang H, Zou G, Liu L, et al. Synthesis of silver nanoparticles using large-area arc discharge and its application in electronic packaging. J Mater Sci. 2017;52(6):3375–3387. doi: 10.1007/s10853-016-0626-9.
- Rameshkumar P, Manivannan S, Ramaraj R. Silver nanoparticles deposited on amine-functionalized silica spheres and their amalgamation-based spectral and colorimetric detection of Hg(II) ions. J Nanopart Res. 2013;15(5):1639. doi: 10.1007/s11051-013-1639-9.
- Suherman AL, Ngamchuea K, Tanner EEL, et al. Electrochemical detection of ultratrace (picomolar) levels of Hg2+ using a silver nanoparticle-modified glassy carbon electrode. Anal Chem. 2017;89(13):7166–7173. doi: 10.1021/acs.analchem.7b01304.
- Shtepliuk I, Vagin M, Yakimova R. Insights into the electrochemical behavior of mercury on graphene/SiC electrodes.C. 2019;5(3):51. doi: 10.3390/c5030051.
- Ivanišević I. The role of silver nanoparticles in electrochemical sensors for aquatic environmental analysis. Sensors. 2023;23(7):3692. doi: 10.3390/s23073692.
- Jeong NC, Prasittichai C, Hupp JT. Photocurrent enhancement by surface plasmon resonance of silver nanoparticles in highly porous dye-sensitized solar cells. Langmuir. 2011;27(23):14609–14614. doi: 10.1021/la203557f.
- Liu Y, Liu CH, Debnath T, et al. Silver nanoparticle enhanced metal-organic matrix with interface-engineering for efficient photocatalytic hydrogen evolution. Nat Commun. 2023;14(1):541. doi: 10.1038/s41467-023-35981-8.
- Moh SH, Kulkarni A, San BH, et al. Photocurrent enhancement of SiNW-FETs by integrating protein-shelled CdSe quantum dots. Nanoscale. 2016;8(4):1921–1925. doi: 10.1039/c5nr07901b.
- Ayhan ME, Kalita G, Kondo M, et al. Photoresponsivity of silver nanoparticles decorated graphene-silicon Schottky junction. RSC Adv. 2014;4(51):26866–26871. doi: 10.1039/C4RA02867H.
- Yu H, Qu L, Zhang M, et al. Achieving high responsivity of photoelectrochemical solar-blind ultraviolet photodetectors via oxygen vacancy engineering. Adv Opt Mater. 2023;11(4):2202341. doi: 10.1002/adom.202202341.
- Linnet J, Walther AR, Albrektsen O, et al. Enhanced photoresponsivity in organic field effect transistors by silver nanoparticles. Org Electron. 2017;46:270–275. doi: 10.1016/j.orgel.2017.04.019.
- Shakeel S, Talpur FN, Anwar N, et al. Xanthan gum-mediated silver nanoparticles for ultrasensitive electrochemical detection of Hg2+ ions from water. Catalysts. 2023;13(1):208. doi: 10.3390/catal13010208.
- Xu D, Yu S, Yin Y, et al. Sensitive colorimetric Hg2+ detection via amalgamation-mediated shape transition of gold nanostars. Front Chem. 2018;6:566. doi: 10.3389/fchem.2018.00566.
- Nguyen TTK, Luu HT, Vu LD, et al. Determination of total mercury in solid samples by anodic stripping voltammetry. J Chem. 2021;2021:1–8. doi: 10.1155/2021/8888879.