
 ?Mathematical formulae have been encoded as MathML and are displayed in this HTML version using MathJax in order to improve their display. Uncheck the box to turn MathJax off. This feature requires Javascript. Click on a formula to zoom.
Abstract
The present paper addresses the multi-objective optimization of the filling stage of the Resin Infusion manufacturing process. The optimization focuses on the selection of an optimal temperature profile which addresses the tradeoff between filling time and the risk of impeding the flow of resin due to excessive curing. The methodology developed combines a numerical solution of the coupled Darcy’s flow and heat conduction problem with a Genetic Algorithm (GA). The methodology converges successfully to a final Pareto set for the case of a C-stiffener which is 130 mm high, 60 mm wide and lies on a skin 280 mm wide. The results highlight the efficiency opportunities available compared to standard industrial manufacturing practice. Reductions in filling time up to 66% and up to 15% in final degree of cure are achieved compared to standard solutions.
Graphical Abstract
1. Introduction
The need for reliable and efficient composites manufacturing processes is currently driven by the simultaneous increase in complexity, production volumes and component size demands in composite materials applications. Liquid composite molding (LCM) processes have been recognized as an attractive alternative to conventional autoclave based processing of high specification parts due to their relatively lower capital cost and scope for automation. Full exploitation of the potential benefits of this family of processing techniques requires the development of methodologies addressing both cost effective operation and minimization of process failures and defects.
The filling stage of LCM processes aims to achieve a satisfactory impregnation of the dry reinforcement. Unsuitable selection of process design parameters, such as gate and vent locations and filling temperature profile may lead to process failures manifested as dry spots and increased micro/macro voids content [Citation1, Citation2]. Minimizing the process duration is a major consideration of filling process design in the context of increasing production rates and reducing process cost. Predictive simulation tools coupled with numerical optimization methodologies offer an effective way to select process design parameters resulting in efficient combinations of product quality and process duration.
The focus of optimization studies of LCM processes has been on satisfying quality and cost related objectives. Single objective optimization of Resin Transfer Molding (RTM) and Resin Injection under Flexible Tooling (RIFT) has addressed quality related objectives concentrating on minimization of micro/macro voids and dry spots. Optimizing injection flow rate can lead to a reduction of void content to values below 2% [Citation3], while optimizing the location of gates and vents can produce improvements in the filling pattern and elimination of dry spots [Citation4–6]. Cost driven single objective investigations of the RTM process have focused on the minimization of filling time through optimization of gate and vent locations. These works have shown that a search for gate locations needs to be addressed with a zero order strategy, such as a GA, due to the presence of many local minima. Reduction in filling time of about 15% can be achieved compared to empirical gate location selections [Citation7–9]. An optimization methodology based on Centroidal Voronoi Diagram has been implemented to minimize filling time by optimal gate placement showing a 93% reduction in required simulations compared to GA [Citation10]. However, this approach is likely to get trapped in local minima when applied to symmetric geometries. Efforts to combine quality and cost related considerations in a more comprehensive treatment of the problem have been based on using a weighted average of the different objectives as an optimization target [Citation11–18]. The optimization of gate and vent locations has been carried out in this way, using a minimization objective combining filling time and dry spots resulting in reductions of up to 90% in the aggregate objective [Citation15–18].
A similar approach including the number of gates and vents in the minimization problem can lead to further improvement due to the flexibility offered by the variable number of ports in the injection setup [Citation11–14]. Optimal solution by means of weighted fitness function have been sought among optimal isothermal filling temperature and injection resin temperature to minimize filling time and temperature gradient through thickness [Citation19]. A true multi-objective setup for optimizing RTM gate locations to minimize simultaneously filling time and void content has shown that it is feasible to determine an improved efficient front of the process, including a number of optimal solutions with respect to both objectives [Citation20].
The present paper addresses the filling stage of Resin Infusion using a flow medium using a full multi-objective optimization setting in which the objectives are minimized simultaneously and treated independently. In this way the design space can be explored without implying the benefits of each objective a priori (i.e. using weighted fitness function). It should be noted that in the context of composites manufacturing the infusion process using a flow medium to facilitate the filling is also known as VARTM or SCRIMPTM. The two objectives selected, filling time and maximum degree of cure at the end of filling, produce a minimum-minimum optimization problem related to cost and quality aspects of the final component. The process design parameters are the gate locations, the filling temperature profile and the convection coefficient. Minimizing the filling time has a direct effect on process cost, while minimizing the maximum degree of cure has a dual role; ensuring a better flow pattern and wettability of fibers which means minimizing formation of voids, and avoiding an overall failure of the process due to the formation of macroscopic dry spots. Furthermore, the nature of the objectives leads to a tradeoff problem which makes treatment in a true multi-objective fashion highly relevant.
2. Coupled filling-curing simulation
The Darcy’s flow problem of the filling stage of the Resin Infusion manufacturing process coupled with heat transfer and cure kinetics has been modeled using the finite element solver PAMRTM® 2013 [Citation21]. The materials used for the study were a pseudo unidirectional carbon fabric (Hexcel G1157 [Citation22]) and a high temperature aerospace grade epoxy (Hexcel RTM6 [Citation23]). The cure kinetics, thermal material properties as specific heat and thermal conductivity and viscosity models were implemented in PAMRTM® using user defined tables.
The simulation of the cure kinetics of the RTM6 epoxy resin follows the model developed by Karkanas and Partridge [Citation24, Citation25]. The reaction rate depends on temperature and degree of cure as follows:
(1)
(1)
where is the degree of cure, m,
and
are reaction orders for the n-th order and autocatalytic terms,
,
are pre-exponential factors, b is a fitting parameter,
,
are the activation energies of the Arrhenius functions,
are the rate constants for chemical reaction and diffusion respectively; T is the absolute temperature, R is the universal gas constant and f the equilibrium fractional free volume, which depends on instantaneous glass transition temperature, while w and g are constants. The glass transition temperature model follows the Di Benedetto equation [Citation26]:
(6)
(6)
Here and
are the glass transition temperatures of the fully cured and uncured material respectively and
is a fitting parameter governing the convexity of the dependence. reports the fitting parameters of the cure kinetics and glass transition temperature development models [Citation25, Citation26].
Table 1. Fitting parameters values for the cure kinetics and glass transition temperature material sub-models of the RTM6 epoxy resin system [Citation25, Citation26].
The specific heat capacity of the composite is obtained by computing the specific heat of the carbon fibers and RTM6 epoxy resin using the rule of mixtures. The specific heat capacity of fiber, resin and composite are represented as follows [Citation27]:
(7)
(7)
where and
are fitting parameters of the linear dependence of fiber specific heat capacity on temperature,
and
are constants expressing the linear dependence of the specific heat capacity of the uncured epoxy on temperature and
,
and σ are the strength, width and temperature shift of the step transition occurring at resin vitrification. In the rule of mixture formulation, EquationEquation (9)
(9)
(9) ,
stands for the weight fiber fraction. reports the fitting parameters for the specific heat capacity material model for both the resin and carbon fibers used in this study [Citation27].
Table 2. Parameter values for material property sub-model of the coupled filling-curing simulation [Citation24–28, Citation30, Citation32].
The thermal conductivity of the composite is computed by accounting the contributions from both resin and carbon fibers. The resin contribution is isotropic, while the carbon fiber contribution is anisotropic. Consequently, the thermal conductivity of the composite is anisotropic with a longitudinal component () and a transverse component (
) which can be expressed as follows [Citation28, Citation29]:
(10)
(10)
where is the fiber volume fraction,
and
are the longitudinal and transverse thermal conductivities of carbon fibers and
the resin thermal conductivity which are modeled as follows [Citation30]:
(12)
(12)
Here ,
describe the longitudinal thermal conductivity of carbon fibers and
the transverse and
,
,
,
,
and
are coefficients of the polynomial function describing the resin thermal conductivity dependence on temperature and degree of cure. The fitting parameters of the thermal conductivity sub-models [Citation28–30] are reported in .
The viscosity model used for the resin system of this study has been proposed by Karkanas and Partridge [Citation31]. Viscosity is considered to be a function of temperature and instantaneous glass transition temperature as follows:
(15)
(15)
where is a reference viscosity equal to
Pas,
is the viscosity,
is a reference temperature,
,
are temperature dependent parameters defined as follows for the resin system of this study:
(16)
(16)
The filling is represented as a flow through porous media problem and is governed by Darcy’s law:
(19)
(19)
where is the pressure,
is the permeability tensor and
the volume-averaged velocity vector. The values of permeability in the different directions for the fabric of this study are reported in [Citation32]. The constitutive material models have been implemented in PAMRTM® via user defined tables. Initial conditions on temperature and degree of cure have been applied; while a time dependent prescribed temperature condition applied to the nodes in contact with the hot tool has been implemented using user defined tables. Natural air convection has been applied to the elements on the vacuum bag side. The value of initial degree of cure was 2%. The temperature boundary condition applied to the tool temperature was considered to follow the thermal profile set by the optimization. The ambient temperature considered in the natural air convection boundary condition is 25 °C. The convection coefficient considered in the standard case in which it was not a design variable in the optimization is 13.7 W/m2°C [Citation33]. The initial temperature was set to be equal to the initial temperature of the non-isothermal profile. The pressure at the inlet was one bar, whereas the flow front was considered to be under vacuum. The thermochemical model and its constitutive laws used to simulate the cure of the materials involved in this study have been validated successfully against experimental results in previous work [Citation24, Citation25, Citation30, Citation34]. Chemo-viscosity model and permeability values adopted have been also validated against experimental results in previous published works [Citation31, Citation32]. The filling simulation methodology solving the Darcy law problem has been also validated [Citation32].
3. Multi-objective optimization methodology
3.1. GA performances tests
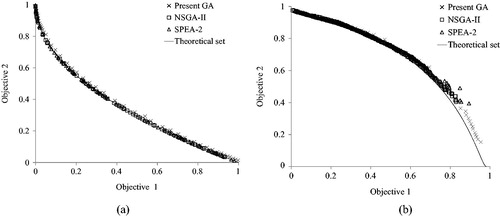
A multi-objective optimization problem has been designed to minimize both filling time and degree of cure at the end of the filling. A GA capable to deal with multi-objective scenarios has been adapted, tested and fine-tuned to solve the problem under study [Citation35]. Furthermore, the GA performance has been compared to that of established implementations to evaluate its efficiency in terms of computational effort and accuracy. The PISA (A Platform and Programing Language Independent Interface for Search Algorithms) platform has been used to implement different search algorithms [Citation36]. Within PISA the Non-dominated Sorted Genetic Algorithm (NSGA-II) [Citation37] and the Strength Pareto Evolutionary Algorithm (SPEA 2) [Citation38] strategies have been selected for comparison. The algorithms have been tested against two benchmarks problems namely proposed by Zitzler and Fonseca [Citation37, Citation39]. The results are reported in . The current GA showed accuracy comparable to the established algorithms and outperformed in both cases the established algorithms in terms of distribution of the Pareto set solution.
Figure 1. GA performances against standard problems: (a) Zitzler and (b) Fonseca.
3.2. Optimization test case
The thermal profile during the filling stage has been parameterized using four parameters; the temperatures of first and second dwell applied to the tool (T1, T2) and the duration of first dwell and ramp (Δt1, Δt2), as depicted in . Furthermore, the convection coefficients and the gate location have been considered, reaching six design parameters overall. reports the ranges of possible values for each parameter and the number of possible gate locations. It should be noted that the ramp duration and possible differences between dwell temperatures can potentially imply relatively high tool heating/cooling rates; it is assumed that fast heating and cooling strategies are feasible in the context of this analysis.
Figure 2. Generic shape of the non-isothermal filling profile.
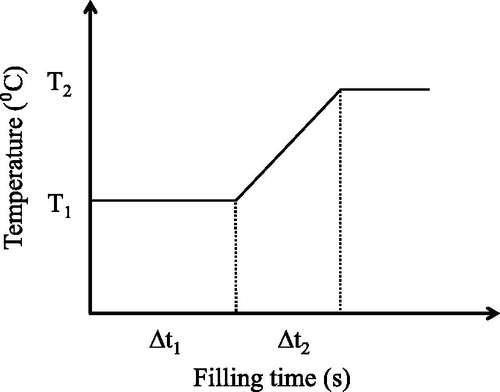
Table 3. Design parameter ranges.
The test case selected for the filling problem addressed is a 3D belly fairing module comprising a skin and four C-stiffeners along each side. Due to the periodicity of the geometry, the part of component including only one C-stiffener has been modeled in PAMRTM®. The geometry of the component, boundary conditions and process strategy, which involves use of an injection line along the length of the stiffeners, allow a 2D representation of the problem. The part, which is illustrated in , involves either one or two sub-laminates of a thickness of 2.4 mm and a [+45 – 45]2s lay-up. In the noodle region fibers are oriented at 0 degrees, therefore in this region the flow is governed by transverse permeability. The height of the C-stringer is 130 mm and its width 60 mm. The width of the skin is 280 mm. The part dimensions are based on sub-components investigated in the literature [Citation40–42]. The upper boundary is subjected to air convection, while the lower boundary to a prescribed temperature following the non-isothermal temperature profile. The model comprises 1909 nodes and 2557 elements. The fiber volume fraction is equal to 59% except in the noodle region where it is equal to 50%. The porous medium is a PTFE coated glass fiber fabric. A steel block is placed in the C-shaped cavity. The material properties of the flow media and steel block are reported in [Citation32]. The results of the optimization are compared to a conventional filling profile for the resin system which is isothermal at 120 °C with a resin temperature at injection equal to 80 °C [Citation23]. The potential injection gate positions considered by the optimization are along the dashed line shown in . An interface linking the GA with the FE solver has been implemented in C++. The interface works on a template solver input file which is read and modified at designated locations. shows the optimization interface functionality. At each iteration, a new set of six parameters is generated by the GA. The interface reads the template file and creates a new one copying the template file line by line and modifying the parameters values in the appropriate lines and locations with the new parameters generated by the GA. Subsequently, a command script is run to execute the PAMRTM® analysis with the modified input file. At the end of the simulation the output file is opened and read by the interface and the objectives, maximum degree of cure and filling time, are withdrawn and fed to the GA. After that a new iteration starts and a new set of parameters is created. reports the GA parameters values adopted for the case under study.
Figure 3. C-stiffener cross section.
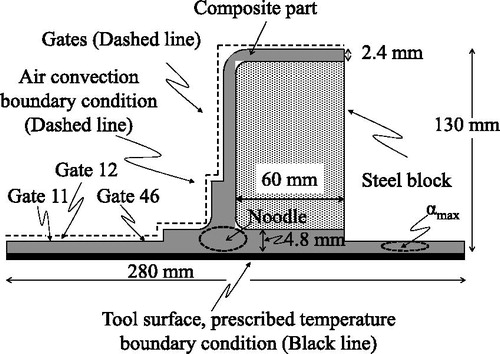
Figure 4. GA-FE solver interface.
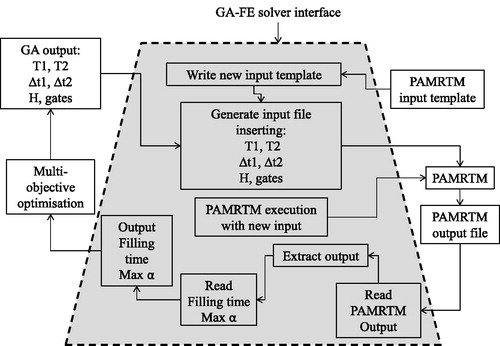
Table 4. Material properties [Citation32].
Table 5. GA parameters used for optimization.
3.3. Exhaustive search and landscapes of the optimization problem
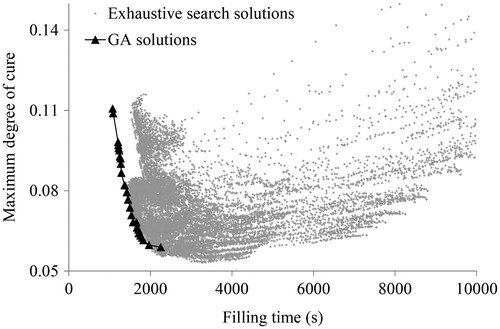
The efficiency of the GA has been assessed comparing its result with an exhaustive search. Each parameter of the design space has been discretized using an equidistant division made of five segments except for the gate parameter which had three segments. An overall number of 15,625 points forms the design space. A standard desktop equipped with four processors takes 25 days to perform the exhaustive search. The GA reaches the final Pareto set in 260 evaluations taking 10 hours to complete the analysis, i.e. it requires about 2% of the computational effort required for the exhaustive search. illustrates a comparison of the Pareto set of the multi-objective optimization problem found by the GA with the feasible set obtained by the exhaustive search. The GA slightly outperforms the exhaustive search for the majority of the set due to the finer accuracy of the algorithm compared to the relatively coarse grid of the full search. Consequently the efficiency in computational effort offered by the GA in comparison with an exhaustive search exceeds 98% for an output of equivalent quality.
Figure 5. Exhaustive search and GA Pareto set comparison.
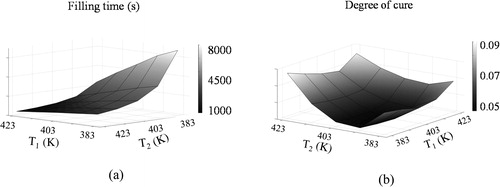
The landscape of the optimization space of the problem addressed is relatively complex. This justifies the use of a zero order search optimization algorithm, such as the GA, instead of potentially more efficient gradient based methods, which would have the tendency of being trapped in local optima and not being able to resolve deceptive parts of the landscape. Some examples of the landscape are examined in the following to demonstrate the complexity involved. illustrates a cross-section of the design space for a second dwell temperature of 130 °C, first dwell duration of 15 minutes, ramp duration of 2 minutes and convection coefficient of 5 W/m2°C. The surface highlights the competitive nature of the two objectives. A higher first dwell temperature results in shorter filling time; however, it also leads to higher degree of cure with the dependence on the latter being strongly non-linear. depicts a cross-section of the design space for an injection happening at gate 11 (), first dwell duration of 15 minutes, ramp duration of 2 minutes and convection coefficient of 5 W/m2°C. Once again the competitive nature of the two objectives and the non-linearity due to the resin viscosity evolution are highlighted in the filling time surface. In the degree of cure surface the non-linearity due to the combined effect of cure kinetics and viscosity is manifested by the presence of local minima which make the optimization problem not trivial and therefore the necessity to adopt an evolutionary based algorithm such as GA.
Figure 6. Design space analysis for a first dwell duration of 15 minutes, ramp duration of 2 minutes, convection coefficient of 5 W/m2°C and second dwell temperature of 130°C. (a) Filling time as function of gate location and first dwell temperature. (b) Maximum degree of cure as function of gate location and first dwell temperature.
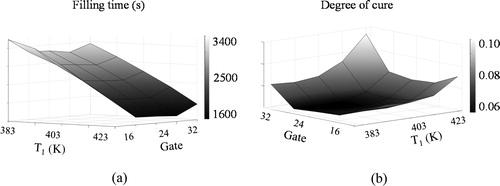
Figure 7. Design space analysis for a first dwell duration of 15 minutes, ramp duration of 2 minutes, convection coefficient of 5 W/m2°C and gate 11. (a) Filling time as function of first and second dwell temperature. (b) Maximum degree of cure as function of first and second dwell temperature.
Data underlying this study can be accessed through the Cranfield University repository at https://doi.org/10.17862/cranfield.rd.5505376.
4. Results and discussion
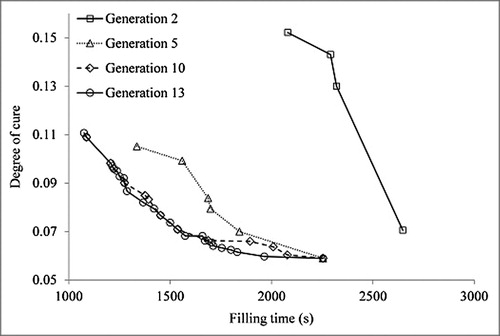
illustrates the convergence to the Pareto set of the multi-objective problem for the case study. The GA is capable of achieving successive improvements in the Pareto set with regard to both objectives and converges to a final Pareto set after 13 generations. The points of the Pareto set achieve a reduction of about 40% in both filling time and degree of cure compared to optimal sets found at early generations. compares the final Pareto set found by the GA with the solution obtained when standard isothermal filling is performed [Citation23]. The standard solution from gate 11 () has a filling time of about 4650 s and a final degree of cure of 0.068. The Pareto set is in the form of an L-shaped curve which highlights the competitive nature of the objectives selected. Solutions on the Pareto set achieve reductions of up to 66% in filling time and up to 15% in degree of cure at the end of the filling without worsening the other objective. All the solutions in the final set are from gate 11, which is located 23 mm from the skin edge, except for the two solutions presenting the shortest filling time and highest final degree of cure which are from gate 46 (). This gate is located 98 mm from the skin edge. The solution with the lowest degree of cure is from gate 12 ().
Figure 8. Pareto set at different generations.
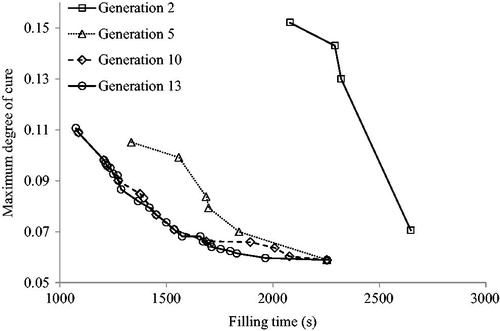
Figure 9. Pareto set and standard result comparison.
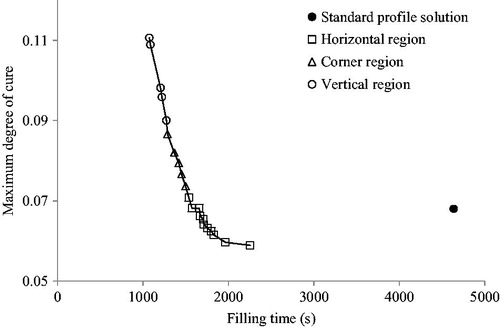
Interesting insights on how optimal solutions are achieved by the methodology can be obtained by investigating the design parameters of the individuals in the Pareto set. It is possible to identify three regions in the final Pareto: (i) the horizontal region in which the maximum degree of cure is low and relatively constant for different filling times; (ii) the vertical region in which filling times remain low and relatively constant for variations of the maximum degree of cure and; (iii) the corner region in which both filling time and maximum degree of cure have relatively low values. These three regions tend to correspond to three different processing strategies. reports the details of the individual designs in the Pareto set. The solutions in the horizontal region are characterized by a maximum degree of cure lower than 0.066 and filling times greater than 27 minutes. The solutions belonging to this region use two different but neighbors gate location. The most conservative solution (point 1) is achieved with injection from gate 12 and adopting a quasi-isothermal filling strategy at about 133 °C. The other solutions (points 2–11) are obtained from gate 11. The strategy adopted for these gates involves a first dwell temperature in the range of 142–159 °C kept for about 8 minutes than a quick ramp down to a temperature below 142 °C. This strategy achieves most of the filling during the first dwell by exploiting the very low viscosity of the resin at high temperature, followed by cooling down to contain the degree of cure evolution. The individuals in the corner region of the set have maximum degree of cure in the range of 0.074–0.087 and filling time in the range of 22–25 minutes. Unlike the horizontal region these solutions show higher second dwell and lower ramp rate and in the case of just point 12 a longer first dwell. This range of parameters generates shorter filling time solutions but with increasing degree of cure. The solutions in the vertical region have degree of cure in the range of 0.09–0.11 and filling time in the range of 18–21 minutes. These individuals have similar first and second dwell temperatures with the corner region; however, in this case the first higher temperature dwell is kept for about 17 minutes instead of about 8 minutes (with the exception of point 12) achieving further improvements in filling time but also increasing the risks associated with a higher degree of cure. The shortest filling time found is for a design using gate 46, low second dwell temperature and a fast cooling rate between the dwells (points 20 and 21). All the individuals in the final Pareto have a convection coefficient of about 5 W/m2°C suggesting that insulation and therefore reduction in temperature gradient along the stiffener is beneficial in terms of the objectives addressed.
Table 6. Pareto set individual solutions details.
A detailed analysis of the flow front has been carried out for the standard solution, a solution in the horizontal region of the Pareto set and one in the vertical region. Solutions in the corner region of the Pareto set show features similar to either the horizontal or vertical region depending on the length of the first dwell duration. Solutions in the horizontal region are characterized by short high temperature first dwells of about 8 minutes while those in the vertical region involve longer high temperature first dwells of about 17 minutes. The flow front has been monitored through the path along the skin of the C-stiffener, from the inlet point to the region where the highest degree of cure is observed, which is located about 34 mm from the edge of the skin and illustrated in .
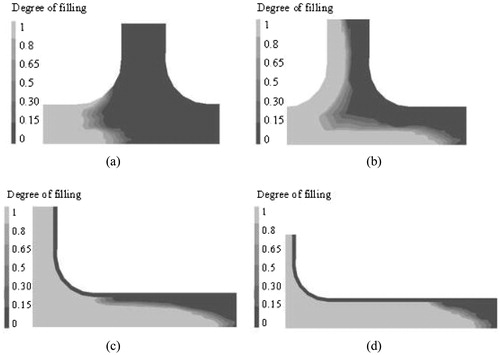
report the evolution of temperature, viscosity and degree of cure of the material at the flow front along the path described and the degree of cure envelope for the standard solution, a solution in the horizontal (point 3) and a solution in the vertical region (point 18) of the Pareto set. In the standard solution () the degree of cure evolution is slow due to the relatively low filling temperature involved (120 °C); however, this also means a viscosity of about 0.11 Pas which leads to a slow process and a long filling time (about 4650 s). The degree of cure evolution curves () show that once the flow front has passed from one location the arrival of new resin causes the degree of cure to drop due to the arrival of resin with lower degree of cure. Once no more resin flow occurs at the location, the degree of cure start increasing again. The horizontal region solution () follows a two dwell filling profile with a first dwell equal at 149 °C and a second dwell at 134 °C. Compared to the standard solution the viscosity is lower due to higher filling temperature. Ramping down to a lower temperature slows down the degree of cure development finding an optimal balance between penalizing the filling time and arresting the degree of cure evolution. The vertical region solutions () uses a long first dwell (17 minutes) at even higher temperature (159 °C) resulting in a very low viscosity in the early stages of the filling. This also results in quick development of the degree of cure. Once 90% of part has been filled, the remaining 10% of the filling is carried out at lower temperature (149 °C) to mitigate the evolution of degree of cure. and show an inflection in the degree of cure evolution respectively at about 2500 s and 700 s. These inflections, unlike the one for the horizontal solution (), are due to the merging of the two flow fronts that originate before the noodle and that join together after it. This phenomenon occurring at the noodle location is illustrated in .
Figure 10. Analysis for the standard solution: (a) evolution of temperature, degree of cure and viscosity at the flow front; (b) degree of cure evolution for different locations from the inlet to the maximum degree of cure location.
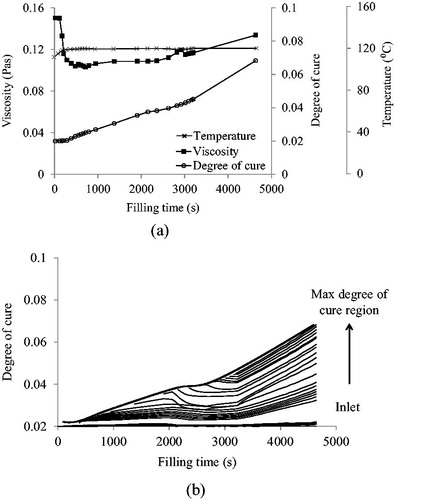
Figure 11. Analysis for point 3 () in the horizontal segment of the Pareto set: (a) evolution of temperature, degree of cure and viscosity at the flow front; (b) degree of cure evolution for different locations from the inlet to the maximum degree of cure location.
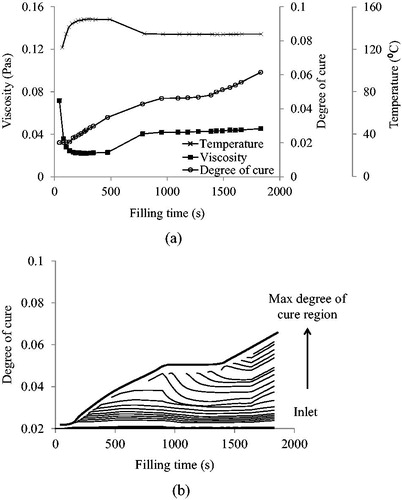
Figure 12. Analysis for point 18 () in the vertical segment of the Pareto set: (a) evolution of temperature, degree of cure and viscosity at the flow front; (b) degree of cure evolution for different locations from the inlet to the maximum degree of cure location.
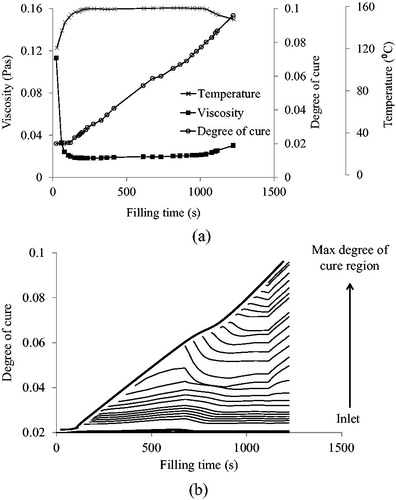
Figure 13. Flow front around the noodle for point 18 at different filling times: (a) 210 s; (b) 300 s; (c) 680 s; (d) 745 s.
5. Conclusions
The optimization methodology presented in this paper investigates the design opportunities for the filling stage of the Resin Infusion process and leads to a set of optimal design solutions. The optimization methodology developed is able to unveil the competitive hidden tradeoffs between the objectives selected. This set of optimal solutions is governed by the tradeoffs between quality and cost, manifested as an L-shape Pareto set. The methodology results in solutions far more efficient than the standard industrial practice with respect to both quality and cost of the process. The outcome of the optimization shows that applying non-isothermal temperature profiles during the filling stage can be very productive. The strategy highlights that the tradeoff between reducing viscosity and minimizing the reaction rate can be addressed through tuning the temperature profiles during the filling. The outcomes of the optimization show that a high first dwell temperature can be adopted in the early stage of filling, when the degree of cure and reaction rate are low, to reduce the viscosity and speed up the flow front, followed by a lower second dwell temperatures which aims to delay the increase in viscosity bound to happen at high temperature and slow down the cure reaction to contain the level of degree of cure. Carrying out analysis of this type on a component by component basis during the stage of process design can result in significant process time benefits at a quality similar to that of conventional process designs; this can be critical in the context of pushing the envelope for use of composites as a competitive material solution in high production rate applications.
Acknowledgments
Support from ESI Group for the use of PAMRTM® is gratefully acknowledged.
Disclosure statement
No potential conflict of interest was reported by the authors.
Additional information
Funding
References
- Mahale AD, Prud'homme RK, Rebenfeld L. Characterization of voids formed during liquid impregnation of non-woven multifilament glass networks as related to composite processing. Compos Manuf. 1993;4:199–207.
- Patel N, Lee LJ. Modeling of void formation and removal in liquid composite molding. Part I: wettability analysis. Polym Compos. 1996;17:96–103.
- Ruiz E, Achim V, Soukane S, et al. Optimization of injection flow rate to minimize micro/macro-voids formation in resin transfer molded composites. Compos Sci Technol. 2006;66:475–486.
- Jiang S, Zhang C, Wang B. Optimum arrangement of gate and vent locations for RTM process design using a mesh distance-based approach. Compos Part A Appl Sci Manuf. 2002;33:471–481.
- Kessels JFA, Jonker AS, Akkerman R. Optimising the flow pipe arrangement for resin infusion under flexible tooling. Compos Part A Appl Sci Manuf. 2007;38:2076–2085.
- Ye X, Zhang C, Liang Z, et al. Heuristic algorithm for determining optimal gate and vent locations for RTM process design. J Manuf Syst. 2004;23:267–277.
- Henz BJ, Mohan RV, Shires DR. A hybrid global–local approach for optimization of injection gate locations in liquid composite molding process simulations. Compos Part A Appl Sci Manuf. 2007;38:1932–1946.
- Kim BY, Nam GJ, Lee JW. Optimization of filling process in RTM using a genetic algorithm and experimental design method. Polym Compos. 2002;23:72–86.
- Lin MY, Murphy MJ, Hahn HT. Resin transfer molding process optimization. Compos Part A Appl Sci Manuf. 2000;31:361–371.
- Wang J, Simacek P, Advani SG. Use of centroidal voronoi diagram to find optimal gate locations to minimize mold filling time in resin transfer molding. Compos Part A Appl Sci Manuf. 2016;87:243–255.
- Gokce A, Advani SG. Combinatorial search to optimize vent locations in the presence of disturbances in liquid composite molding processes. Mater Manuf Process. 2003;18:261–285.
- Gokce A, Advani SG. Vent location optimization using map-based exhaustive search in liquid composite molding processes. Mater Manuf Process. 2004;19:523–548.
- Gokce A, Advani SG. Simultaneous gate and vent location optimization in liquid composite molding processes. Compos Part A Appl Sci Manuf. 2004;35:1419–1432.
- Gokce A, Hsiao KT, Advani SG. Branch and bound search to optimize injection gate locations in liquid composite molding processes. Compos Part A Appl Sci Manuf. 2002;33:1263–1272.
- Jiang S, Zhang C, Wang B. A process performance index and its application to optimization of the RTM process. Polym Compos. 2001;22:690–701.
- Luo J, Liang Z, Zhang C, et al. Optimum tooling design for resin transfer molding with virtual manufacturing and artificial intelligence. Compos Part A Appl Sci Manuf. 2001;32:877–888.
- Mathur R, Advani SG, Fink BK. Use of genetic algorithms to optimize gate and vent locations for the resin transfer molding process. Polym Compos. 1999;20:167–178.
- Young WB. Gate location optimization in liquid composite molding using genetic algorithms. J Compos Mater. 1994;28:1098–1113.
- Yu HW, Young WB. Optimal design of process parameters for resin transfer molding. J Compos Mater. 1997;31:1113–1140.
- Ratle F, Achim V, Trochu F. Evolutionary operators for optimal gate location in liquid composite moulding. Appl Soft Comput. 2009;9:817–823.
- PAMRTM® Composites Molding Simulation Software, ESI Group 2013. Available from: www.esi-group.com.
- TohoTenax. Delivery programme and characteristics Tenax HTA filament yarn, Toho Tenax Europe GmbH, 2011.
- Hexcel® RTM 6 180 °C epoxy system for resin transfer moulding monocomponent system product data. Available from: www.hexcel.com, 2009.
- Karkanas PI, Partridge IK. Cure modeling and monitoring of epoxy/amine resin systems. I. Cure kinetics modeling. J Appl Polym Sci. 2000;77:1419–1431.
- Karkanas PI, Partridge IK, Attwood D. Modelling the cure of a commercial epoxy resin for applications in resin transfer moulding. Polym Int. 1996;41:183–191.
- Pascault JP, Williams RJJ. Relationships between glass transition temperature and conversion. Polym Bull. 1990;24:115–121.
- Mesogitis TS, Skordos AA, Long AC. Stochastic simulation of the influence of cure kinetics uncertainty on composites cure. Compos Sci Technol. 2015;110:145–151.
- Farmer JD, Covert EE. Thermal conductivity of a thermosetting advanced composite during its cure. J Thermophys Heat Transfer. 1996;10:467–475.
- Yamane T, Katayama S, Todoki M, et al. The measurement of thermal conductivity of carbon fibers. J Wide Bandgap Mater. 2000;7:294–305.
- Skordos AA, Partridge IK. Inverse heat transfer for optimization and on-line thermal properties estimation in composites curing. Inverse. Probl Sci Eng. 2004;12:157–172.
- Karkanas PI, Partridge IK. Cure modeling and monitoring of epoxy/amine resin systems. II. Network formation and chemoviscosity modeling. J Appl Polym Sci. 2000;77:2178–2188.
- Sirtautas J, Pickett AK, George A. Materials characterisation and analysis for flow simulation of liquid resin infusion. Appl Compos Mater. 2015;22:323–341.
- Mesogitis TS, Skordos AA, Long AC. Stochastic heat transfer simulation of the cure of advanced composites. J Compos Mater. 2016;50:2971–2986.
- Zimmermann K, Van Den Broucke B. Assessment of process-induced deformations and stresses in ultra thick laminates using isoparametric 3D elements. J Reinf Plast Compos. 2012;31:163–178.
- Struzziero G, Skordos AA. Multi-objective optimisation of the cure of thick components. Compos Part A Appl Sci Manuf. 2017;93:126–136.
- Bleuler S, Laumanns M, Thiele L, et al. PISA — a platform and programming language independent interface for search algorithms. Berlin (Germany): Springer; 2003. p. 494–508.
- Deb K, Pratap A, Agarwal S, et al. A fast and elitist multiobjective genetic algorithm: NSGA-II. IEEE Trans Evol Comput. 2002;6:182–197.
- Zitzler E, Laumanns M, Thiele L. SPEA2: Improving strength pareto evolutionary algorithm for multiobjective optimisation. Evolutionary methods for design, optimization and control with applications to industrial problems. Proceedings of the EUROGEN'2001; Athens, Greece, 2001. p. 95–100.
- Zitzler E, Deb K, Thiele L. Comparison of multiobjective evolutionary algorithms: empirical results. Evol Comput. 2000;8:173–195.
- Stickler PB, Ramulu M, Johnson PS. Experimental and numerical analysis of transverse stitched T-joints in bending. Compos Struct. 2000;50:17–27.
- Stickler PB, Ramulu M, van West BP. Transverse stitched T-joints in bending with PR520 resin: initial results. J Reinf Plast Compos. 2001;20:65–75.
- Wood MDK, Tong L, Luo Q, et al. Failure of stitched composite L-joints under tensile loading — experiment and simulation. J Reinf Plast Compos. 2009;28:715–742.