
Abstract
In this research, genotyping data of 43 InDel loci in 311 Han individuals in Ankang City, Shaanxi Province, China were detected using a self-developed five-dye multiplex amplification panel. The allelic frequencies and forensic parameters of all InDel loci were calculated. The combined power of discrimination and probability of exclusion values were 0.999 999 999 999 999 998 827 39 and 0.999 887 424, respectively, which demonstrated that this 43-InDel panel was powerful for individual identifications in Ankang Han population. Moreover, genetic distances, pairwise FST values, principal component analyses, phylogenetic trees and STRUCTURE analyses were performed to investigate the genetic affinities between Ankang Han and reference groups. Population genetic investigations indicated that Ankang Han population had a close genetic relationship with Southern Han population compared with other reference groups.
Introduction
Human identification (HID) and paternity testing are two fundamental and traditional tasks of forensic genetics. Short tandem repeat (STR), a kind of DNA length polymorphism characterized by high genetic polymorphism and discrimination capacity, constitutes the standard DNA genetic marker for the purposes of HID and paternity testing [Citation1–3]. However, some disadvantages such as large amplified fragments and high mutation rates limit the wide use of STRs in forensic genetics. Insertion/deletion (InDel) polymorphism is a kind of DNA polymorphisms caused by insertion or deletion of DNA fragments with different lengths in the human genome [Citation4]. As the biallelic DNA length polymorphism in human genome, InDels possess highlighted merits such as wide distributions in human genome, low mutation rates, small amplified fragments, absence of stutter peaks in comparisons with STRs and available for capillary electrophoresis (CE) platform [Citation5,Citation6]. InDels complement the disadvantages of STRs, which have become the promising genetic markers in the applications of HID [Citation7,Citation8] and biogeographic ancestry predictions [Citation9] since the initial InDel map was reported in 2006 [Citation10].
Though Qiagen Investigation® DIPplex kit has been widely used in the human identifications all over the world, researchers found that some InDel loci in that kit had low genetic polymorphisms in Chinese populations [Citation7,Citation11,Citation12]. Considering that, some novel InDel kits with high genetic polymorphisms in East Asian populations have been constructed [Citation13–15]. Previously, a novel multiplex amplification panel containing 43 highly polymorphic InDel loci and one Amelogenin locus was constructed in-house for the individual identifications in East Asian populations [Citation16]. Compared with other InDel panels, this novel panel was characterized by smaller amplicon sizes at each InDel locus, which helped to ensure that complete InDel profiles could be obtained from degraded DNA samples. Developmental validation has demonstrated its reliable forensic efficiencies and potentials in forensic investigations [Citation16].
China is a unified multi-ethnic country with 56 nationalities, which harbours abundant genetic resources and cultural diversities. The Han nationality is the most populous ethnic group, living in various geographical regions of China. Han populations in China are roughly divided into two parts—Southern Han and Northern Han. Differentiations in local dialects, folkways and eating habits among Han populations in different regions have been studied. Previous researches indicated that there were significant genetic differences between Northern and Southern Han subpopulations [Citation17–19].
Ankang city (31°42′24″–33°50′34″ N, 108°00′58″–110°12′05″ E), a prefecture-level city under the jurisdiction of Shaanxi Province, locates at the junctions of Sichuan, Shaanxi, and Hubei provinces and Chongqing municipality. Han individuals in Ankang City account for 99% of its total population. Ankang Han, part of Southern Han Chinese, inhabits in the valley basin between the Qinling and the Bashan Mountains. Folkways of Ankang Han population deeply influenced by the Ba-Shu culture, as well as cultures of Qin and Chu States. (http://www.ankang.gov.cn/Node-2556.html). Though numerous researches have evaluated the forensic efficiencies and genetic relationships of Chinese Han populations in different regions, genetic diversities and background of Ankang Han population still need to be further investigated. This research is aimed to provide the clues on the genetic background and relationships between Ankang Han and reference groups via a set of these 43 InDel loci.
Materials and methods
Ethical statement, sample collections and reference groups
This research was conducted in accordance with the ethical principles for medical research involving human subjects recommended by the World Medical Association Declaration of Helsinki. Ethical approval (2019-1039) was acquired from the ethics committees of Xi’an Jiaotong University Health Science Center and Southern Medical University, and the study protocol has been permitted and overseen by the ethics committees. According to “sample collection protocol”, peripheral blood samples of 311 unrelated healthy Han volunteers living in Ankang City, Shaanxi Province were gathered after obtaining written informed consents. All the volunteers who were recruited in this research declared that their families were Han people and lived in Ankang city for at least three generations. Population data of 43 InDel loci from 27 reference groups acquired from 1000 Genomes Project Phase 3 and previously published reports were used as reference population data [Citation20]. The details of reference groups were shown in .
Table 1. Information of studied Ankang Han population and 27 reference groups.
PCR amplification and capillary electrophoresis for InDel genotyping
Genomic DNA was extracted and purified by Magnetic Universal Genomic DNA Kit (TIANGEN Biotech, Beijing, China) using the method of magnetic beads. Forty-three InDel loci and an Amelogenin gene were detected according to the manufacturer’s recommendation [Citation16]. ABI 3500xL Genetic Analyzer with POP-4 (Thermo Fisher Scientific, South San Francisco, CA, US) was used to separate the InDel PCR products. Before the electrophoresis, loading samples containing 8.5 µL of Hi-Di formamide, 1 µL of PCR product and 0.5 µL of Size Standard Org500 (Microread Genetics, Beijing, China) were prepared. The alleles were determined using the GeneMapper ID-X software v1.5 (Thermo Fisher Scientific).
Quality control
The whole experimentation was implemented in an accredited laboratory by China National Accreditation Service for Conformity Assessment (CNAS L3881). This novel 43-InDel panel has already passed the developmental and internal validations [Citation16]. In PCR amplification, the 9947A was used as positive control DNA, and deionized water was used as negative control.
Statistical analysis
The exact tests of Hardy-Weinberg equilibrium (HWE) were calculated using a Markov chain method by Arlequin v3.0 software [Citation21]. Allelic frequencies of 43 InDel loci in Ankang Han population and forensic statistical parameters including expected heterozygosity (He), polymorphism information content (PIC), matching probability (MP), observed heterozygosity (Ho), power of discrimination (PD), probability of exclusion (PE) and typical paternity index (TPI) were calculated using an online tool-STRAF [Citation22]. The violin plots were performed by R 3.4.4 software to visualize the distributions of PD, He, Ho, MP, PE and PIC values. Linkage disequilibrium (LD) tests were calculated using SNPAnalyzer 2.0 software [Citation23]. Genetic distances (DA) between Ankang Han and other reference groups were calculated by DISPAN programme [Citation24]. Pairwise fixation index (FST) values between Ankang Han and other reference groups were calculated by GENEPOP v4.0 software [Citation25]. Two kinds of phylogenetic trees were constructed: (1) A neighbour-joining (NJ) tree was conducted based on allelic frequencies of 43 InDel loci by PHYLIP 3.69 package, and then visualized with MEGA 7 software [Citation26,Citation27]; (2) A phylogenetic tree was conducted on the basis of DA values using unweighted pair-group method with arithmetic mean (UPGMA) method by Mega 7 software. Two principal component analysis (PCA) plots were conducted by R 3.4.4 software based on the insertion allelic frequencies of 43 InDel loci. Ancestry component analyses were conducted by STRUCTURE v2.3.4 software with predefined K values ranging from 2 to 6. Structure Harvester (http://taylor0.biology.ucla.edu/structureHarvester/) and CLUMPAK (http://clumpak.tau.ac.il/) online tools were used to further analyze and visualize the results of STRUCTURE. Tableau 2019.2 (Tableau Software, Inc., Seattle, WA, USA) was used to create a geographical map of Ankang Han and six reference groups located in East Asia.
Results
HWE and linkage disequilibrium tests
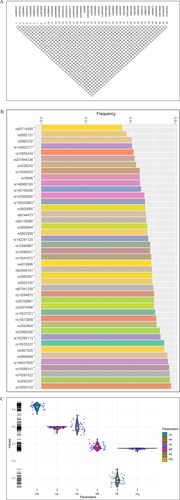
Before the statistical analyses, the exact tests of HWE were calculated in all loci, and their P-values were shown in supplementary Table S1. In Ankang Han population, the studied 43 InDel loci were confirmed to meet the HWE after sequential Bonferroni correction (P = 0.05/43 = 0.0012). In the LD tests, we calculated the r2 values of pairwise loci, and the results were displayed in an inverted triangle-like shape containing 903 squares (). The depth of each square colour in reflected the size of r2 value. In current research, the r2 values of all pairwise loci were less than 0.1.
Figure 1. Results of linkage disequilibrium tests, insertion allelic frequencies and forensic parameters of 43 InDel loci in Ankang Han population. (A) Results of linkage disequilibrium tests. (B) Insertion allelic frequencies of 43 InDel loci in Ankang Han population. (C) The violin plots of expected heterozygosity (He), observed heterozygosity (Ho), polymorphism information content (PIC), matching probability (MP), power of discrimination (PD) and probability of exclusion (PE).
Forensic statistical parameters of 43 InDel loci in Ankang Han population
Allelic frequencies and a series of forensic statistical parameters including He, PIC, MP, Ho, PD, PE and TPI values of 43 InDel loci in Ankang Han population were calculated, and the results were shown in Supplementary Table S1 and . The insertion allelic frequencies of 43 InDel loci varied from 0.3617 (rs55714089) to 0.5804 (rs10555133). All insertion allelic frequencies were higher than 0.4 except for rs55714089 (0.3617) and rs5852131 (0.3810) (). As shown in , violin plots that reflected the distributions of PD, He, Ho, MP, PE and PIC values were conducted. The PD, PE and MP values of 43 InDel loci in Ankang Han population ranged from 0.5741 to 0.6439, 0.1475 to 0.2520, and 0.3561 to 0.4259, respectively, with the mean values of 0.6169, 0.1903 and 0.3831, respectively. The minimum and maximum of He and PIC were 0.4625 and 0.5008 (He), 0.3552 and 0.3750 (PIC), respectively. The combined PD (CPD) value was 0.999 999 999 999 999 998 827 39, and the combined PE (CPE) was 0.999 887 424. The insertion allelic frequencies of 43 InDel loci in Ankang Han population were shown in .
DA and pairwise FST values between Ankang Han and reference groups
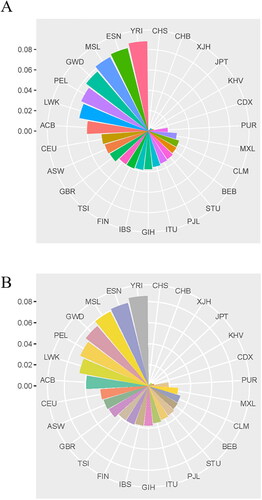
To assess the genetic differentiations between Ankang Han and worldwide reference groups, we firstly estimated the pairwise FST values between Ankang Han and 27 reference groups, and visualized via Nightingale’s Rose graph (). The minimum FST value was observed between Ankang Han and Southern Han Chinese (CHS) (FST = 0.0004), followed by Han Chinese in Beijing (CHB) (FST = 0.0004) and Chinese Hui group (XJH) (FST = 0.0014) while the largest FST value was found between Ankang Han and Yoruba in Ibadan, Nigeria (YRI) (FST = 0.088). In addition, Nei’s genetic distances were calculated based on the allelic frequencies of 43 InDel loci, and shown in . The closest genetic distance was found between Ankang Han and CHS (DA=0.0001), followed by CHB (DA = 0.0004), Chinese XJH (DA = 0.0014) and Japanese in Tokyo (JPT) (DA = 0.0037) while the large DA values were found between Ankang Han and African populations.
Figure 2. Nightingale’s Rose graphs showing FST (A) and DA (B) values between Ankang Han and reference groups. See for the full names of abbreviations of populations groups.
Phylogenetic trees and principal component analyses of 28 populations based on 43 InDel loci
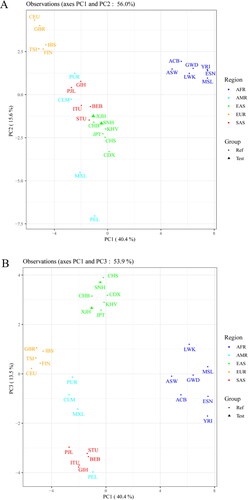
We evaluated the phylogenetic relationships among Ankang Han, other Chinese Han populations and reference groups using the NJ and UPGMA methods, respectively, and the phylogenetic trees were shown in . In the NJ tree (), all groups clustered into four major branches, roughly in line with their intercontinental distributions: seven groups from Africa, five groups from Europe, five groups from South Asia and seven groups from East Asia clustered together, respectively. In the East Asia subbranch (labeled with green square), the studied Ankang Han population clustered closely with CHS, Chinese Dai in Xishuangbanna (CDX) and Kinh in Ho Chi Minh City, Vietnam (KHV) groups. In UPGMA tree (), we found the similar results with NJ tree that seven groups from East Asia clustered in the same branch, and Ankang Han population clustered closely with CHS. Additionally, we conducted two PCA plots of 28 groups based on allelic frequencies of 43 InDel loci. As shown in , the first three principal components could explain 69.5% total variance. In PC1 (explaining 40.4% variance), African and European populations could be separated from other intercontinental groups. PC2, accounting for 15.6% variance, distinguished European and East Asian groups from others. In PC3 (explaining 13.5% variance), East Asian groups and American groups could be distinguished from others. Ankang Han population clustered together with these East Asian groups.
Figure 3. Phylogenetic trees via NJ and UPGMA algorithms. (A) An NJ tree was conducted based on allelic frequencies of 43 InDel loci by PHYLIP package. (B) A phylogenetic tree was conducted on the basis of DA values using UPGMA by MEGA 7 software. See for the full names of abbreviations of populations groups.
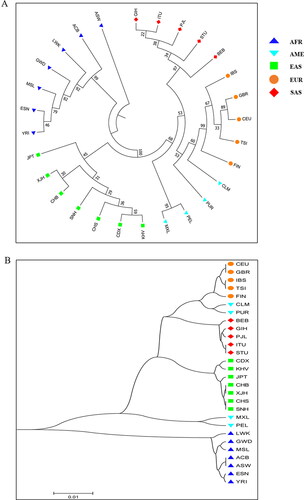
Figure 4. PCA plots of Ankang Han (SNH) and 27 reference groups based on allelic frequencies of 43 InDel loci. See for the full names of abbreviations of populations groups.
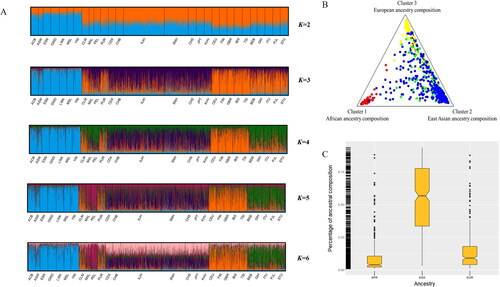
Structure analyses of Ankang Han population and reference groups based on 43 InDel loci
We dissected individual ancestry components among 3 348 individuals of 28 groups using the Admixture model based on the raw genotypes results and inferred the ancestry compositions of Ankang Han population under K values from 2 to 6. As shown in , African groups, which shared cyan-based ancestry components, were distinguished from other intercontinental groups at K = 2. When K value was 3, East Asian groups subsequently appeared in the individual ancestry vertical line with purple-based ancestry component. When K value was increased to 4, African, East Asian, European and South Asian groups were identified from each other with cyan-, purple-, orange- and green-based ancestry components, respectively. With the increasing of K values from 5 to 6, no further substructure was appeared in these groups. displayed the result of cluster analysis for the Ankang Han population using the output file when K was 3. In cluster analysis, cluster 1 (red plots), cluster 2 (green plots) and cluster 3 (yellow plots) represented the African, East Asian and European ancestry compositions, respectively. Ankang Han individuals (blue plots) mainly clustered with East Asian populations.The boxplots in displayed the ancestry compositions of Ankang Han individuals. The studied Ankang Han population mainly composed of the East Asia-based ancestry composition, and shared the similar ancestry compositions with these East Asian populations.
Figure 5. (A) STRUCTURE analyses among 3 348 individuals of Ankang Han (SNH) and 27 reference groups using the Admixture model based on the raw genotypes under K values from 2 to 6. (B) Cluster analysis for the ancestry compositions of Ankang Han group (K=3). (C) Boxplot of the ancestry compositions of Ankang Han population. See for the full names of abbreviations of populations groups.
Discussions
Genetic diversities of 43 InDel loci in Ankang Han population
HWE and LD analyses were firstly accessed before the multiple statistical analyses and population genetic analyses were conducted. The results of exact tests of HWE revealed that all the InDel loci confirmed to meet the HWE, that is, the present population data of Ankang Han were representative. In the LD tests, we found that r2 values of all pairs of 43 InDel loci were less than 0.1, which demonstrated that 43 InDel loci were independent with each other, and could be used for subsequent population genetic analyses.
We calculated a series of forensic statistical parameters for the sake of evaluating the genetic polymorphisms of this 43 InDel loci in Ankang Han population. Expected heterozygosity was one of the most frequently used forensic statistical parameters to measure the diversities of genetic markers in certain population [Citation28,Citation29]. In Ankang Han population, He values of almost InDel loci were higher than 0.4, which demonstrated these loci showed higher than genetic diversities in Ankang Han population. PIC, originally defined by Botstein et al. [Citation30], is another statistic to measure the genetic diversity. For biallelic markers, it is generally believed that PIC values ranging from 0 to 0.1 indicate low genetic polymorphisms; PIC values ranging from 0.1 to 0.25 indicate that these genetic markers have the moderate degree of genetic polymorphisms; the genetic marker shows high diversity when the PIC value is greater than 0.25 [Citation31]. PIC values of 43 InDel loci in Ankang Han population were all above 0.3, indicating that these loci performed high genetic diversities and were suitable for the forensic applications in Ankang Han population. Besides, the CPD value of 43 InDel loci in Ankang Han population was 0.999 999 999 999 999 998 827 39, which met the efficiency of forensic personal identification. However, the CPE was 0.999 887 424 so that this panel could only be used as a complementary tool in the paternity testing.
Genetic affinities among Ankang Han and reference groups based on 43 InDel loci
We investigated the genetic affinities among Ankang Han and reference groups using the DA genetic distances, FST values, PCAs, phylogenetic trees and STRUCTURE analyses. The pairwise FST values, proposed by Wright [Citation32], were often used to evaluate the genetic differentiations among different populations. Genetic distance, usually referring to the genetic difference determined by genetic frequency, is a numerical statistic that is used to evaluate the genetic differences between different populations or species [Citation33]. We calculated the FST and DA values between Ankang Han and reference groups. The minimum FST and DA values were observed between Ankang Han and CHS, followed by CHB and, which suggested the close genetic relationships might exist between Ankang Han and Southern Han population.
PCA method could transform the multivariate data to a set of uncorrelated principal components or new variables that explained a large amount of variances within the data [Citation34]. PCA plots were carried out to further evaluate the genetic relationships among these 28 groups. As mentioned above, the first three principal components could explain 69.5% total variance. Ankang Han population clustered closely with Southern Han population in PC1 and PC3, demonstrating that the close genetic affinity existed between Ankang Han and Southern Han populations. Furthermore, we reconstructed two kinds of phylogenetic trees via NJ and UPGMA algorithms. We found the studied Ankang Han population clustered closely with CHS, which were in accordance with results of the PCAs, FST and DA values.
STRUCTURE adopts Bayesian iterative algorithm and Markov Chain Monte Carlo theory (MCMC) to analyze the ancestry components. This software assigned each individual to predetermined ancestral components (K values), and then estimated ancestral compositions of each individual based on raw genotypes of 43 InDel loci. In the Bayesian structure analysis, we also found Ankang Han population shared similar ancestry compositions with East Asian groups, which were characterized with the purple-based ancestry composition when K was 3. This indicated that Ankang Han population had closer relationships with East Asian groups.
Related genetic and linguistic researches indicated that Han and Tibeto-Burman populations may share the same ancestors and originate in Northern China in the Late Neolithic and then diverge from each other about ∼6 000 years before present [Citation35,Citation36]. Historical materials revealed that the Yan Emperor and Yellow Emperor were the ancestors of the Han Chinese. Many researchers found that there were genetic divergencies between Northern and Southern Han populations in China [Citation37,Citation38]. In present study, Ankang Han population had a closer genetic relationship with Southern Han population compared with Beijing Han (part of Northern Han Chinese), which was consist with previous researches [Citation37,Citation39].
Conclusion
In conclusion, we characterized the forensic efficiencies of 43-InDel panel in Ankang Han population. The results of the forensic statistical analyses demonstrated that these 43 InDel loci had sufficient power for forensic individual identifications in Ankang Han population. Population genetic investigations indicated that Ankang Han population had closer genetic relationships with East Asian groups, especially with Southern Han Chinese.
Authors’ contributions
Bofeng Zhu and Tong Xie designed and was responsible for this research. Wei Cui, Xiaoye Jin and Tong Xie conducted the InDel genotyping and prepared the preliminary data. Wei Cui, Qiong Lan and Yating Fang analyzed the data. Wei Cui written the draft manuscript. Jiangwei Lan, Man Chen, Shuyan Mei, Tong Xie and Bofeng Zhu reviewed and revised the manuscript. All authors read and approved the final manuscript.
Compliance with ethical standards
This research was conducted in accordance with the ethical principles for medical research involving human subjects recommended by the World Medical Association Declaration of Helsinki. This research has been permitted and overseen by the ethics committees of Xi’an Jiaotong University Health Science Center (2019-1039) and Southern Medical University. Written informed consent was obtained from all individual participants included in the study.
Supplemental Material
Download Zip (1.3 MB)Disclosure statement
The authors stated that they had no conflicts of interest.
Additional information
Funding
References
- Iyavoo S, Afolabi O, Boggi B, et al. Population genetics data for 22 autosomal STR loci in European, South Asian and African populations using SureID® 23comp human DNA identification kit. Forensic Sci Int. 2019;301:174–181.
- Zhang J, Bao Y, Tao R, et al. Genetic polymorphisms of 21 STR loci of GoldeneyeTM DNA ID 22NC kit in five ethnic groups of China. Forensic Sci Res. 2019;4:348–350.
- Lu Y, Sun HJ, Zhou JC, et al. Genetic polymorphisms, forensic efficiency and phylogenetic analysis of 17 autosomal STR loci in the Han population of Wuxi, Eastern China. Ann Hum Biol. 2019;46:601–605.
- Mills RE, Pittard WS, Mullaney JM, et al. Natural genetic variation caused by small insertions and deletions in the human genome. Genome Res. 2011;21:830–839.
- Shahzad M, Hussain M, Shafique M, et al. Population genetic data of 30 insertion-deletion markers in Punjabi population of Pakistan. Int J Legal Med. 2020;134:511–512.
- Wang M, Du W, He G, et al. Revisiting the genetic background and phylogenetic structure of five Sino-Tibetan-speaking populations: insights from autosomal InDels. Mol Genet Genomics. 2020;295:969–979.
- Liu Y, Jin X, Lan Q, et al. Forensic characteristic and population structure dissection of Shaanxi Han population in the light of diallelic deletion/insertion polymorphism data. Genomics. 2020;112:3837–3845.
- Wang F, He G, Wang Z, et al. Population genetics and forensic efficiency of 30 InDel markers in four Chinese ethnic groups residing in Sichuan. Forensic Sci Res. 2022;7:498–502.
- Sun K, Yun L, Zhang C, et al. Evaluation of 12 multi-InDel markers for forensic ancestry prediction in Asian populations. Forensic Sci Int Genet. 2019. 2019;43:102155.
- Mills RE, Luttig CT, Larkins CE, et al. An initial map of insertion and deletion (INDEL) variation in the human genome. Genome Res. 2006;16:1182–1190.
- Cui W, Jin X, Guo Y, et al. An innovative panel containing a set of insertion/deletion loci for individual identification and its forensic efficiency evaluations in Chinese Hui ethnic minority. Mol Genet Genomic Med. 2020;8:e1074.
- Liu Y, Zhang H, He G, et al. Forensic features and population genetic structure of dong, Yi, Han, and Chuanqing human populations in southwest China inferred from insertion/deletion markers. Front Genet. 2020;11:360.
- Liu J, Du W, Wang M, et al. Forensic features, genetic diversity and structure analysis of three Chinese populations using 47 autosomal InDels. Forensic Sci Int Genet. 2020;45:102227.
- Santos VR, Pena HB, Pena SD. A multiplex panel of short-amplicon insertion-deletion DNA polymorphisms for forensic analysis. Genet Mol Res. 2015;14:2947–2952.
- Huang Y, Liu C, Xiao C, et al. Development of a new 32-plex InDels panel for forensic purpose. Forensic Sci Int Genet. 2020;44:102171.
- Jin R, Cui W, Fang Y, et al. A novel panel of 43 insertion/deletion loci for human identifications of forensic degraded DNA samples: development and validation. Front Genet. 2021;12:610540.
- Gao Y, Zhang C, Yuan L, et al. PGG.Han: the Han Chinese genome database and analysis platform. Nucleic Acids Res. 2020;48:D971–D976.
- Li YC, Ye WJ, Jiang CG, et al. River valleys shaped the maternal genetic landscape of Han Chinese. Mol Biol Evol. 2019;36:1643–1652.
- Yang X, Wang XX, He G, et al. Genomic insight into the population history of Central Han Chinese. Ann Hum Biol. 2020;15:1–13.
- The 1000 Genomes Project Consortium. A global reference for human genetic variation. Nature. 2015;526:68–74.
- Excoffier L, Laval G, Schneider S. Arlequin (version 3.0): an integrated software package for population genetics data analysis. Evol Bioinform. 2007;1:47–50.
- Gouy A, Zieger M. STRAF — a convenient online tool for STR data evaluation in forensic genetics. Forensic Sci Int Genet. 2017;30:148–151.
- Yoo J, Lee Y, Kim Y, et al. SNPAnalyzer 2.0: a web-based integrated workbench for linkage disequilibrium analysis and association analysis. BMC Bioinformatics. 2008;9:290.
- Ota T. DISPAN: genetic distance and phylogenetic analysis. University (PA): Institute of Molecular Evolutionary Genetics; 1993.
- Rousset F. Genepop’007: a complete re-implementation of the Genepop software for Windows and Linux. Mol Ecol Resour. 2008;8:103–106.
- Kumar S, Stecher G, Tamura K. MEGA 7: molecular evolutionary genetics analysis version 7.0 for bigger datasets. Mol Biol Evol. 2016;33:1870–1874.
- Felsenstein J. PHYLIP-phylogeny inference package (version 3.2). Cladistics. 1989;5:164–166.
- Nei M. Analysis of gene diversity in subdivided populations. Proc Natl Acad Sci USA. 1973;70:3321–3323.
- Vilas A, Perez-Figueroa A, Quesada H, et al. Allelic diversity for neutral markers retains a higher adaptive potential for quantitative traits than expected heterozygosity. Mol Ecol. 2015;24:4419–4432.
- Botstein D, White RL, Skolnick M, et al. Construction of a genetic linkage map in man using restriction fragment length polymorphisms. Am J Hum Genet. 1980;32:314–331.
- Serrote CML, Reiniger LRS, Silva KB, et al. Determining the Polymorphism Information Content of a molecular marker. Gene. 2020;726:144175.
- Wright S. Evolution and the genetics of population, variability within and among natural populations. Chicago (IL): The University of Chicago Press; 1978.
- Nei M, Tajima F, Tateno Y. Accuracy of estimated phylogenetic trees from molecular data. II. Gene frequency data. J Mol Evol. 1983;19:153–170.
- Kotu V, Deshpande B. Chapter 14 — Feature selection. In: Kotu V, Deshpande B, editors. Data science. 2nd ed. Burlington (UK): Morgan Kaufmann; 2019. p. 467–490.
- Zhang M, Yan S, Pan W, et al. Phylogenetic evidence for Sino-Tibetan origin in Northern China in the late neolithic. Nature. 2019;569:112–115.
- Su B, Xiao C, Deka R, et al. Y chromosome haplotypes reveal prehistorical migrations to the Himalayas. Hum Genet. 2000;107:582–590.
- Chen J, Zheng H, Bei JX, et al. Genetic structure of the Han Chinese population revealed by genome-wide SNP variation. Am J Hum Genet. 2009;85:775–785.
- Zhao YB, Zhang Y, Zhang QC, et al. Ancient DNA reveals that the genetic structure of the Northern Han Chinese was shaped prior to 3,000 years ago. PLoS One. 2015;10:e0125676.
- Xu S, Yin X, Li S, et al. Genomic dissection of population substructure of Han Chinese and its implication in association studies. Am J Hum Genet. 2009;85:762–774.