
 ?Mathematical formulae have been encoded as MathML and are displayed in this HTML version using MathJax in order to improve their display. Uncheck the box to turn MathJax off. This feature requires Javascript. Click on a formula to zoom.
ABSTRACT
Landslide detection is a hot topic in the remote sensing community, particularly with the current rapid growth in volume (and variety) of Earth observation data and the substantial progress of computer vision. Deep learning algorithms, especially fully convolutional networks (FCNs), and variations like the ResU-Net have been used recently as rapid and automatic landslide detection approaches. Although FCNs have shown cutting-edge results in automatic landslide detection, accuracy can be improved by adding prior knowledge through possible frameworks. This study evaluates a rule-based object-based image analysis (OBIA) approach built on probabilities resulting from the ResU-Net model for landslide detection. We train the ResU-Net model using a landslide dataset comprising landslide inventories from various geographic regions, including our study area and test the testing area not used for training. In the OBIA stage, we first calculate land cover and image difference indices for pre-and post-landslide multi-temporal images. Next, we use the generated indices and the resulting ResU-Net probabilities for image segmentation; the extracted landslide object candidates are then optimized using rule-based classification. In the result validation section, the landslide detection of the proposed integration of the ResU-Net with a rule-based classification of OBIA is compared with that of the ResU-Net alone. Our proposed approach improves the mean intersection-over-union of the resulting map from the ResU-Net by more than 22%.
1. Introduction
Landslides are a frequent phenomenon in many parts of the world, including thousands of small and medium-sized ground movements following earthquakes or extreme weather events (Guzzetti et al., Citation2012). Earthquakes, anthropogenic activities, and extreme meteorological events like intense rainfall are leading causes of this phenomenon within mountainous terrain worldwide (Prakash et al., Citation2021). Among these landslide triggers, intense rainfall has become more frequent and severe due to climate change, triggering hundreds of landslides of different types (e.g. debris flow and Rockfall) and sizes distributed over large areas (Ozturk, Saito, Matsushi, Crisologo, & Schwanghart, Citation2021). Therefore, recording landslides and rapidly monitoring the affected areas are essential to estimate damages and provide quick disaster responses and humanitarian aid (Ghorbanzadeh et al., Citation2019; Pourghasemi & Rahmati, Citation2018). Moreover, landslide detection is crucial for updating landslide inventory data sets with exact location and extent, which are required for modeling any further landslide susceptibility, determining risk, and assessing vulnerability (Guzzetti et al., Citation2012; Mondini et al., Citation2011).
Field survey-based landslide detection was considered to be the primary method for mapping regional landslides prior to the emergence of remote sensing (RS) (Guzzetti, Carrara, Cardinali, & Reichenbach, Citation1999). Once RS data like aerial photos became available, manual interpretation and visual detection of landslides gained the most attention. They were introduced as a common approach to detecting landslides, especially in remote areas (Qi, Wei, Yang, Xu, & Ma, Citation2020). This approach was less time-consuming and labor-intensive than field surveys. The accuracy of the results had a linear relation to the operator’s expertise. Therefore, RS data and multitemporal imagery have become a valuable alternative source for hazard assessment in study areas with limited access and potential for field surveys (Ghorbanzadeh, Tiede, Wendt, Sudmanns, & Lang, Citation2020; Lang, Hay, Baraldi, Tiede, & Blaschke, Citation2019). Different types of RS data and satellite imagery, including optical data (Bacha, Van Der Werff, Shafique, & Khan, Citation2020; Lei et al., Citation2018), synthetic aperture radar (SAR) data (Dabiri et al., Citation2020; Mondini et al., Citation2021), LiDAR data (Doshida, Citation2020), and UAV images (Melis et al., Citation2020), have been used for landslide detection.
Extraction of landslide information from RS data falls into two general domains: pixel-based (PB) and object-based image analysis (Qi et al., Citation2020). The automaticity of both fields has been increased by combining them with various types of machine learning models, such as support vector machines (Tavakkoli Piralilou et al., Citation2019), random forest (Nhu et al., Citation2020), and artificial neural networks (Shahabi et al., Citation2019). In contrast to PB image analysis, object-based image analysis (OBIA) can use spectral, spatial, temporal, and contextual image information, which can also be performed at multiple scales (Blaschke, Citation2010). OBIA enables semi-automatic image analysis, leverages expert domain knowledge to a greater extent, and links the PB image analysis to GIS functionalities (Benz, Hofmann, Willhauck, Lingenfelder, & Heynen, Citation2004; Naboureh, Bian, Lei, & Li, Citation2021). This approach starts with grouping similar pixels into meaningful objects by a segmentation method. It then groups the objects using knowledge-based rule sets to classify them by synchronizing contextual information such as the topology of objects while considering spatial and spectral properties of generated objects (Blaschke et al., Citation2014). Both segmentation and classification processes in an OBIA approach can be performed iteratively at different levels to enable users to analyze images within hierarchical and topological frameworks of objects and corresponding sub-objects (Baatz, Hoffmann, & Willhauck, Citation2008). Therefore, expert knowledge can play a vital role in determining the properties of the segmentation process (Benz et al., Citation2004) and classification procedures in an OBIA approach (Bacha et al., Citation2020; Ma, Zhu, Qiu, Blaschke, & Li, Citation2021).
OBIA has been applied in many studies of landslide segmentation, mainly from very high-resolution (VHR) RS images. Hölbling et al. (Citation2012) applied a semi-automated object-based method for landslide detection using SPOT-5 images and a digital elevation model (DEM) and its derivative topographic information, like slope, in northwestern Italy. In another study, Tavakkoli Piralilou et al. (Citation2019) investigated the integration of an OBIA approach with three different machine learning models like logistic regression (LR), multilayer perceptron neural network (MLP-NN), and random forest (RF) to detect seismic landslides triggered by an earthquake in Rasuwa district, Nepal. They also applied VHR satellite images and DEM-derived information from their case study area in Nepal; their highest score was 86% for the case using RF. A very current study undertaken by Tehrani et al. (Citation2021) studied an OBIA approach built on two RF models trained and tested on two different datasets to detect the location of landslides. The integration of the machine learning model of RF and OBIA has already been performed by Chen et al. (Citation2017) for landslide detection from “ZY-3” high spatial resolution (HSR) satellite images in a landslide-prone region along the Yangtze River in China. Four different mathematical morphology operations are applied in their study to improve the performance of their integrated approach; their highest overall classification accuracy was more than 93.3%. Since landslides are complex systems in which the movement of the surface soil layer, rock, and debris flow down a slope, an effective object-oriented landslide detection is required for defining the object-features from RS data, such as image band information (Chen et al., Citation2017). At the same time, even a brief review of the above research reveals that there is no standard way to use specific features to influence the accuracy of landslide detection. In cases where a large number of features is available for extraction, selecting the optimal features relies on human expert (domain) knowledge (Bacha et al., Citation2020). This is a complex process, mainly due to the transferability of the selected features among different geographical study areas (Tehrani et al., Citation2021). While some common features are usually applied for the purpose of landslide detection from RS data, the performance of an object-based approach is mainly restricted by the availability of image features and user selection (Yi & Zhang, Citation2020). Expert domain knowledge also plays an essential role in both image segmentation and classification of the resulting segments. Although OBIA lacks a systematic tool for conceptualizing and formalizing that domain knowledge, ontology has the potential to be helpful for these aims with moderate subjectivity (Hay & Blaschke, Citation2010), similar to the formalization and information system development in GIScience.
Since 2019, different convolutional neural network (CNN) architectures have been developed and applied to landslide detection by some studies (Xu, Ouyang, Jiang, Fan, & Cheng, Citation2019; Ye et al., Citation2019), as pioneered by (Ghorbanzadeh et al., Citation2019). Ghorbanzadeh et al. (Citation2019) developed two different CNN architectures for landslide detection. They compared the results with common machine learning models for artificial neural networks (ANN), support vector machines (SVM), and RF. All models were trained and tested based on Rapid Eye images and some topographic factors derived from a 5 m spatial resolution DEM. Their highest accuracy yielded the best mean intersection-over-union of more than 78%. Ye et al. (Citation2019) integrated a deep belief network and a logistic regression classifier to extract spectral-spatial features and verify landslides. Their integrated framework was performed on hyperspectral images (EO-1 Satellite) from a study area located in Central Sichuan, China. The highly precise landslide detection result they obtained with the integrated framework was almost 98%. This trend of applying deep learning to landslide detection was continued by applying Fully Convolutional Networks (FCNs) in a few 2020 studies, most of them using VHR RS imagery (Liu, Wei, Wang, Chen, & Xie, Citation2020; Qi et al., Citation2020; Soares, Dias, & Grohmann, Citation2020; Su et al., Citation2020). As the most popular model among the FCNs, the U-Net model was used in some landslide detection studies. For example, Soares et al. (Citation2020) applied this model based on VHR images and ALOS DEM for landslide detection in widespread landslide-hazard areas in the mountainous region around Rio de Janeiro, Brazil. Their highest -score resulting value was 55%, obtained using a window size of 128 × 128 for sample patch generation. Qi et al. (Citation2020) also trained and tested a U-Net and compared its performance with that of the ResU-Net for landslide detection from GeoEye-1 images (0.5 m spatial resolution); the latter model showed a 9% boost, with an 89% -score value. Both CNN and FCN models use convolutional layers to extract features from an RS image introduced to the model as input data and detect landslides by learning high- and low-level features. These DL models follow a typical supervised learning workflow that entails dividing the case study into two areas, one for training and one for testing, then training the model using the training area. The trained DL model is then applied to detect landslides in the area considered for testing the model (Ghorbanzadeh, Crivellari, Ghamisi, Shahabi, & Blaschke, Citation2021). Although the CNN and FCN models have state-of-the-art performance in different RS applications and landslide detection, they require massive labeled training image patches to trigger their superiority over common machine learning models (Ye et al., Citation2019).
This paper presents a new strategy for integrating a rule-based OBIA with an FCN for landslide detection. To the best of our knowledge, no study has yet evaluated the possibility of integrating OBIA with FCN for image segmentation and instance segmentation of landslides in particular. Moreover, almost all research conducted on CNN and FCN models has investigated High Resolution (HR) and VHR Earth observation data. Spatial resolution plays a considerable role in spatial heterogeneity and state-of-the-art accuracies. However, we use open-source data from the ALOS DEM and pre-and post-landslide Sentinel-2 images. The FCN model is trained based on post-landslide RS images from various geographic regions, including our study area in Japan. A rule-based OBIA approach is designed in the object-based classification phase using land cover and image difference indices for pre- and post-landslide images, along with the resulting probabilities obtained by our FCN model. The landslide detection maps produced by the integrated approach and the FCN-only model are then validated by standard precision, recall, and -score performance metrics.
The main objective of this paper is to showcase the potential of using OBIA’s knowledge-based classification capability to enhance the landslide detection results of the FCN model. Besides taking advantage of expert domain knowledge, this integration addresses the problem posed by deep learning models: highly abstracted output features that lead to fuzzy boundaries in the classification results (Lu et al., Citation2020). Thus, in contrast to the FCN and CNN models, object-based approaches are based on homogeneous segments, and segmentation is usually consistent with the actual boundaries of landslides. This enhancement was mainly in annotating landslide boundaries.
2. Materials and methods
2.1. Study area and dataset
The study area in this paper is a part of Eastern Iburi, Hokkaido, Japan, as represented in
Figure 1. Overview of the study area of Eastern Iburi, Japan. The training and testing areas (used for the FCN model) are presented on the post-landslide Sentinel-2 image, band combination 4-3-2.
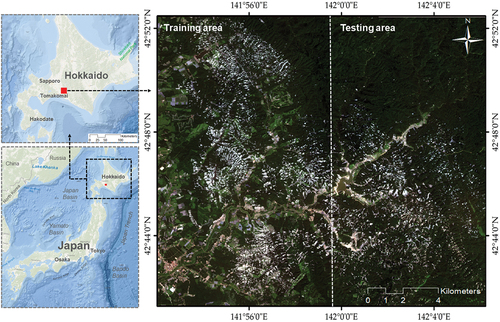
Our primary source of the landslide inventory is the map produced by Zhang et al. (Citation2019) and applied in studies like (Ghorbanzadeh et al., Citation2021). The inventory map is then manually improved using Google Earth images. The landslide features’ minimum, maximum, and mean are 89.6 m2, 569,904.02 m2, and 8688.8 m2, respectively.
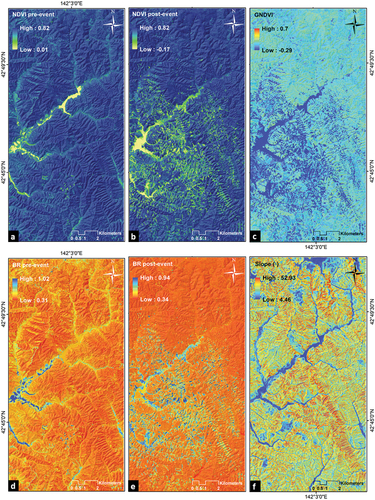
The training and testing datasets include optical satellite imagery from Sentinel-2 and the digital elevation model from the Japanese aerospace exploration agency sensor of JAXA ALOS. The cloud-free available pre- (23.05.2016) and post- (06.08.2019) landslide event Sentinel-2 images are downloaded, and atmospheric corrections are made using the useful Sen2Cor plugin in the SNAP software developed by the European Space Agency (ESA). Considering the cloud cover for our study area, the high-resolution (10-m spatial resolution) bands of Sentinel-2A, including blue (2), green (3), red (4), and near-infrared (8) plus with the slope layer derived from the applied DEM, are used for training and testing the FCN model and further analyses (see and ) .
Figure 2. Images a and b depict the cloud-free acquired pre- (23.05.2016) and post- (06.08.2019) landslide event Sentinel-2 images, band combination 8-4-3. Image c shows the ALOS DEM (ranging from 49.3 m to more than 472 m) for the area considered for testing.
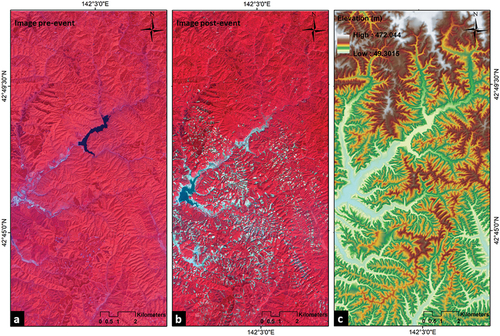
Table 1. Applied Sentinel-2 images used in this study (MSI: Multispectral Instrument).
2.2. Workflow and implementation details
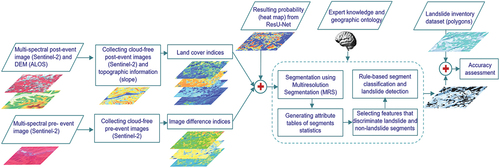
This study uses two main procedures. The first involves training and testing the FCN model based on the post-landslide image. The second is our integrated approach, which calculates land cover and image difference indices for pre- and post-landslide images. The generated indices and the FCN resulting probabilities from the first scenario are then used for landslide detection using a rule-based OBIA approach. Since the rule-based OBIA approach is used to improve the landslide detection resulting from the FCN model, this improvement is measured by comparing the results of the FCN model alone with those of the proposed integration of an FCN with OBIA against the landslide inventory dataset. In this study, we consider the FCN model to be the baseline model and compare its performance with our integrated FCN-OBIA approach to landslide detection. The overall workflow (see ) of this study is as follows:
Preparing multispectral pre- and post-landslide event Sentinel-2 images, the ALOS DEM, and generating topographic information of the slope of the study area
Designing and training a ResU‑Net as a predominate FCN model with the fusion of the post-landslide event Sentinel-2 images and slope and testing on the testing area
Extracting the land cover and image difference indices using pre- and post-landslide event Sentinel-2 images
Designing the integrated approach of FCN-OBIA, segmentation, and classification of the resulting features by using knowledge-based rulesets
Validating the resulting landslide detection maps from the FCN and the proposed FCN-OBIA models
Figure 3. The general schema of the proposed integrated approach.
2.2.1. Fully Convolutional Network (FCN) and model architecture
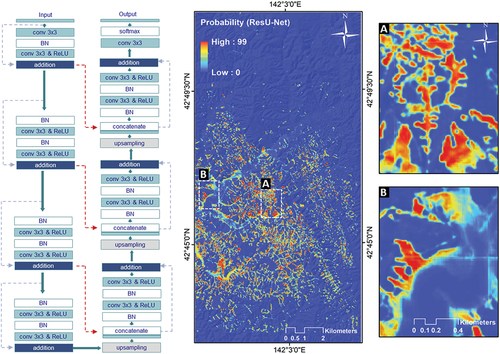
The FCN model introduced by Long et al. (Citation2015) has a key characteristic: it does not have any fully connected (FC) layer. Instead, it replaces the FC layer with convolutional and upsampling layers. This model is structured for an image-to-image mapping, making it appropriate for calculating per-pixel probability labels (Ronneberger, Fischer, & Brox, Citation2015). Thus, the training and testing image patches can be used in arbitrary sizes (Zhang et al., Citation2020). The absence of the FC layer in this model makes it possible to recognize different representations of the local space within the input image (Zhu et al., Citation2017). In this study, we used a ResU-Net as our baseline model. We took advantage of the FCN model and the high learning performance of the residual learning units. The ResU-Net network structure comprises three main parts: downsampling, bridge, and upsampling (Zhang, Liu, & Wang, Citation2018). The downsampling and upsampling functions are built with three residual units. At the same time, the bridge part consists of only one residual unit. Each residual unit comprises two convolution layers with a 3 × 3 filter size and identity mapping. It considers the residual vectors from its former residual unit to optimize the training progress (Qi et al., Citation2020). All convolution layers are followed by a BN layer and a ReLU activation layer. Three identity mapping concatenates the output of the units in the downsampling path to the input of the corresponding unit in the upsampling path. The first convolution layers in each unit do the downsampling and reduce the feature map size by half using the stride of 2 instead of max-pooling layers. Moreover, the Conv2DTranspose layers are used to perform the upsampling of feature maps in the upsampling path of the ResU-Net. After 14 convolutional layers, a final 1 × 1 convolutional filter and a sigmoid activation function are used on top of the architecture to refer each pixel to a probability value of landslide and non-landslide labels that range between 0 and 1. As presented in , our applied ResU-Net has 15 convolutional layers in total. The binary cross-entropy loss function is applied to determine the difference between each from the highest probability of 1, using the following EquationEquation (1)(1)
(1) .
Table 2. The network structure of the applied ResU-Net in this study.
where is a weight map that represents the important pixels in the training progress (Ronneberger et al., Citation2015). The
refers to the number of the class, 1 or 2, as there are two classes in this study: landslide and non-landslide. The applied ResU-Net is trained using backpropagation over mini-batch stochastic training and the Adam optimization algorithm (Kingma & Ba, Citation2014); the learning rate is set as 0.001 (with β1 = 0.9, and β2 = 0.999). In each stem, the batch size is four images. The best result is obtained by using an early stopping method based on evaluation loss. A window size of 128 × 128 pixels is used to generate input sample patches using a regular grid approach without any overlap among the patches (see ). The window size sample patches are selected based on some current studies, which have shown the higher accuracy of using these sizes (Ghorbanzadeh et al., Citation2021; Soares et al., Citation2020). What is more, no data augmentation is utilized for the training sample patches. The resulting landslide probability map (see ) from our applied ResU-Net is used for further processing and refinement within the following sections.
Figure 4. The regular grid approach for sample patch generation, with a window size of 128 × 128 pixels and no overlap between the patches.
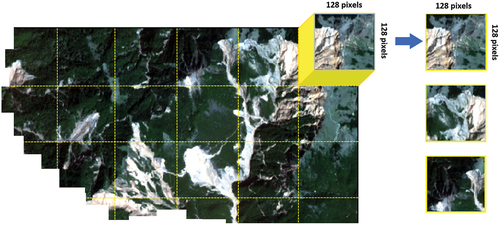
Figure 5. Left, the architecture of the applied ResU-Net in this study. Right, the resulting landslide probability map from the applied ResU-Net. Pixel values closer to 1 represent a higher probability of the landslide class (A and B refer to two enlarged areas).
2.2.2. Land cover indices
Concerning vegetation removal of landslides in areas where the forest is predominant, land cover indices of the Normalized Difference Vegetation Index (NDVI) (Rahman et al., Citation2021) in EquationEquation (2)(2)
(2) and Green Normalized Difference Vegetation Index (GNDVI) in EquationEquation (3)
(3)
(3) are used to detect vegetation changes and map landslides. Moreover, removing the surface vegetation along the landslide travel path exposes underground soil and rock that usually have higher brightness than neighboring areas (Tehrani et al., Citation2021). Thus, the Brightness Index (BR) in Eq. (4) is considered another appropriate land cover index. The NDVI, GNDVI, and BR are calculated using the following equations:
where NIR, R, G, and B refer to the near-infrared, red, green, and blue bands, respectively, of Sentinel-2 and (i,j) refers to the pixels of an image with n × m pixels, (i,j): i = 1, …, n and j = 1, …, m. The resulting land cover indices and the slope layer are represented in .
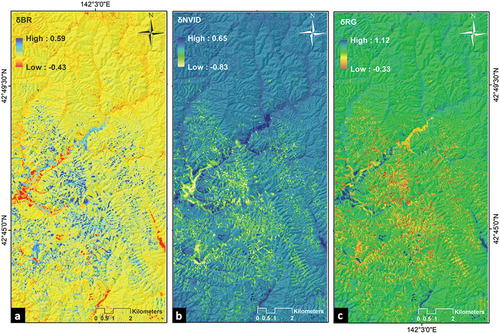
Figure 6. The resulting features of a) NDVI pre, b) NDVI post, c) GNDVI post, d) BR pre, e) BR post, and f) slope layer.
2.2.3. Image difference indices
After normalizing the band values of the pre- and post-event images, three image difference indices are calculated. The differences between the NDVI values of the pre- and post-event images are called δNDVI and are calculated using EquationEquation (5)(5)
(5) (Mondini, Chang, & Yin, Citation2011). The other image difference index is the red-over-green difference (δRG). It is obtained by calculating the difference between the ratio of red and green bands from pre- and post-event images using EquationEquation (6)
(6)
(6) (Tehrani et al., Citation2021). Finally, the brightness difference (δBR) is the last image difference index considered, calculated using resulting BR values from pre- and post-event images (see ) by EquationEquation (7)
(7)
(7) .
Figure 7. The resulting features from image difference indices of a) δBR, b) δNDVI, and c) δRG.
2.2.4. Object-based segmentation
The object-based portion of this approach involves two main steps: transferring the image to the meaningful segments and rule-based refinement of the landslide object candidates. The generated features of BR, GNDVI, NDVI, δRG, δNVID, δBR, elevation, and slope and the resulting probability from the ResU-Net model are applied for image segmentation (see ). Different methods are used for image segmentation, but Multiresolution Segmentation (MRS) is the most commonly used method in landslide detection and was chosen for the OBIA process. The MRS method was carried out in eCognitionTM (www.ecognition.com) in this study. The MRS is a bottom-up multi-scale segmentation method implemented based on critical image band weights, scale parameters, shape, and compactness values. The MRS method generates the objects using an iterative algorithm, starting from individual pixels and then grouping these pixels until the predefined parameter values are reached (Munyati, Citation2018). Therefore, the user must define these critical parameters for the MRS. The scale and shape parameters are defined as the maximum allowed heterogeneity and textural homogeneity in the resultant image segments. Likewise, the last parameter is used to optimize segments relating to their compactness, aiming for relatively compact segments (Chen et al., Citation2017; Definiens, Citation2006). The most critical challenge is how to find the optimal values for these parameters, and iteration based on trial and error is the typical procedure for that (Shahabi et al., Citation2019). The segmentation process is conducted based on cross-validation with a scale parameter of 8, shape 0.1, and compactness 0.9, which provide high homogenous objects. All generated features are involved in the segmentation process using the MRS with different weights (see ). The layer weight of each feature is defined based on its importance to extracting landslide bodies. After generating the segments, pixels of any layer of the applied features are grouped into a segment polygon, allowing each segment’s feature statistics to be calculated. The mean and maximum values are calculated for each feature in each segment polygon as a representative value for other processes. Not all mean and max values of the features are used in rulesets. Some thresholds are verified for those features that play an essential role in separating landslide segments from non-landslides. Therefore, four simple rulesets were designed for cooperating with the expert knowledge domain in the classification process. The first ruleset started with the resulting probability from the ResU-Net model. The mean and max values more prominent than 0.2 and 0.39, respectively, are selected as landslides for further analysis. Implementing this ruleset results in the removal of the segments that represent lower landslide probability. However, there are still many segments that an expert can easily verify as the non-landslide feature (see )
Figure 8. Continue
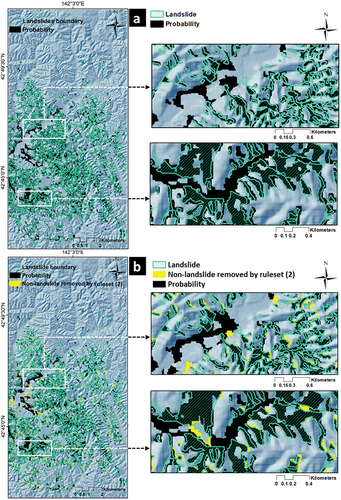
Figure 8. The comparisons of landslide inventories of the holdout testing area with a) the probability map of the ResU-Net model after implementing the first ruleset; b) result of the second ruleset; c) result of the third ruleset; and d) result of the last ruleset along with their two enlarged areas.
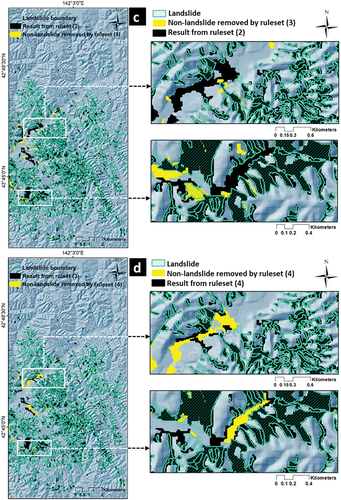
Table 3. Landslide diagnostic features.
Table 4. Parameters and threshold values used for image segmentation and ruleset conditions.
The second ruleset is applied based on the output segments from the first ruleset. This ruleset is performed by considering mean values more significant than 0.5 for brightness and the mean and max values greater than 0.09 and 0.15, respectively, of the δBR. This refinement process could enhance the landslide boundaries by removing neighboring non-landslide segments, as is evident from . The third ruleset focuses on vegetation-related indexes. Selecting the segments with NDVI-post mean values lower than 0.15 helps detect the landslide areas where surface vegetation was removed.
Moreover, two conditions, −0.07 ≤ δNVID and 0.4 ≤ NDVI-pre, assist in separating landslides triggered by the earthquake from old ones that took place before; they also help distinguish between landslides and bare soil with similar spectral characteristics (see ). Within the last ruleset, objects with slope gradients below 10 degrees and elevation lower than 75 m are excluded from the outputs of the third ruleset; the removed false positive segments are illustrated in . The remaining objects from the last ruleset are then introduced as the landslides resulting from the integrated approach of FCN-OBIA. After some visual evaluation and sensitivity analyses, these specific features and corresponding thresholds are selected to find the most optimally separate landslide and non-landslide segments. All defined thresholds are summarized in .
3. Quantitative evaluation
The landslide detection approaches were evaluated based on their resulting maps against the inventory data set of the holdout testing area. Commonly used image classification accuracy assessment metrics, precision, recall, and -score, were used. The precision metric is used to discover how many landslide areas are correctly detected. The recall accuracy assessment metric is applied to determine how much of the landslide inventories were detected in the image. The balance between precision and recall is calculated through the -score for this aim. The metrics were calculated based on true positives (TPs), false positives (FPs), and false negatives (FNs) [see EquationEquations (8)(8)
(8) -(Equation10
(10)
(10) )].
The mean intersection-over-union (mIOU) is another accuracy assessment metric applied to validate our models’ performance. This accuracy assessment metric is widely used in computer vision, particularly segmentation and object detection tasks. It is suitable for validating the results of bounding boxes or polygons like landslide detection. Thus, the mIOU has been used in landslide detection studies, but it was first introduced to this field by Ghorbanzadeh et al. (Citation2019). This metric is calculated as the mean of the following equation:
4. Results and accuracy assessment
The probability of the ResU-Net model, land cover, and image difference indices are considered the intermediate results used for the integrated approach of the ResU-Net-OBIA. After the final ruleset of classification, the landslide candidate segments were merged and exported as a shape-file, compared to our baseline model of ResU-Net. The refinement of the probability map by implementing every single knowledge-based ruleset of the integrated approach is shown in . For reference, the inventory data set’s polygons (colored tourmaline green) are also included in
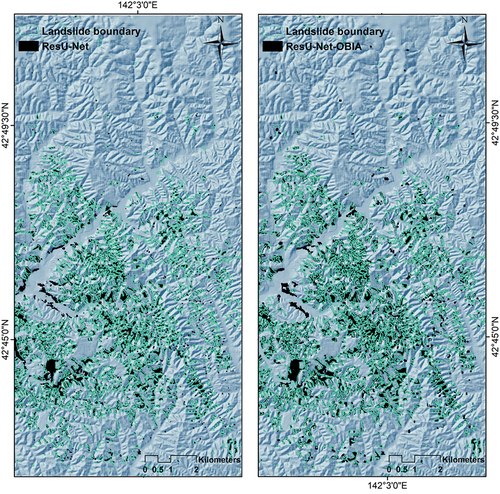
Figure 9. Resulting landslide detection maps. Left: the ResU-Net model; right: the ResU-Net-OBIA integrated approach.
The resulting probability of our baseline model is represented in black, and the color yellow specifies the removal of false positives by implementing each ruleset. Two subareas within the testing area were enlarged to illustrate the impacts of each ruleset on the results. The subareas are in different scales, also selected from the regions with high inter-class similarity challenges. Some landslide and non-landslide areas (e.g. bare soil and riverbed) look similar in the image, but they must be considered in different classes.
presents the final image classifications of each ResU-Net model and the integrated image classification for landslide detection.
The accuracy assessment results are shown in , below.
Table 5. Evaluation results of landslide detection approaches.
Based on the accuracy assessment metrics and the inventory data set, we consider the ResU-Net as the baseline. In addition, we use the same testing area for both the ResU-Net and our integrated approach of ResU-Net-OBIA. From , it is evident that the integrated approach obtained higher precision, recall, and -score than the ResU-Net. However, much higher recall compared to the precision shows the ResU-Net-OBIA method could remove many FNs from the ResU-Net.
5. Discussion
Regarding the model’s performance, the remarkable improvement of recall over the precision of our integrated approach means that using only ResU-Net, the model could detect most of the landslide areas in the testing area, although it also yielded a higher number of incorrectly detected ones (i.e. false positives) than did the integrated approach. However, the integrated approach successfully and accurately detected more landslides. These improvements were obtained by using more features extracted from the pre-landslide image and the topographic feature of elevation, and, most importantly, adding prior knowledge to the resulting probability of the ResU-Net model through the rule-based OBIA for landslide detection.
The representation of a landslide on the RS images usually consists of three different sections: the source area, transition area, and deposition area. The soil and rock from the source area are distributed throughout the slopes to the deposition areas (Yi & Zhang, Citation2020). However, in our case study area, due to a vast number of shallow landslides, they usually mixed in the transition and deposition area with bare soil and riverbeds that had almost the same range of spectral reflectance. To address such issues, the rule-based OBIA and features derived from pre-landslide event images and topographic information from DEM were associated with the ResU-Net heat map to detect and delineate landslides. After the segmentation process based on all extracted features, a rule-based classification was used. The optimal parameters and threshold values of conditions in the rulesets were defined based on an expert knowledge domain (our prior knowledge) and visual interpretation to annotate the false-positive segments and eliminate them from the detected segments as a landslide. The selection of the mean and max probability values of more than 20% and 39%, respectively, from the resulting heat map of the ResU-Net model, could eliminate most of the segments considered a non-landslide by this model. Therefore, the remaining segments were used for additional rulesets.
and show six randomly selected objects and represent feature statistics in detail. The chosen objects of b, e, and f are landslides, according to the landslide inventory polygons. Although several landslides have low probabilities from our applied ResU-Net model, these three selected objects represent very high maximum probability values of more than 90%. As a non-landslide segment, object a has the lowest probability, 25%, of being a landslide within these six instances. Like other numerous segments, it was removed by the first condition of the max probability of 39%. However, objects c and d, which are not landslides, have almost the highest maximum probability values of 77% and 86%, respectively. Although our integrated approach successfully categorized object c in the non-landslide class, all rulesets failed to eliminate object d from the landslide class. These examples illustrate the complexity of landslide detection within this case study area due to hills collapsing into rivers to create landslide dams that block the channels. As a result, some natural lakes are formed by the water level rising at a speed of about 10 cm/day, as reported by Kawamura et al. (Citation2019). This change in river morphology has resulted in water draining from some streambeds and covering other areas, mainly upstream of the landslide dams.
Figure 10. A local result of the multiresolution segmentation (MRS) before the object-merging step. Six randomly selected objects (a, b, c, d, e, and f) overlapped by landslides, and results from the ResU-Net and ResU-Net-OBIA, are compared in detail (refer to ).
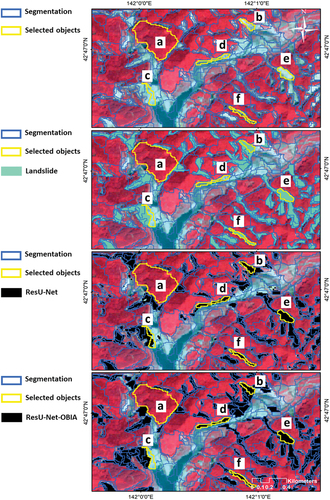
Table 6. Corresponding resulting feature values for randomly selected objects (a, b, c, d, e, and f in ), based on statistics per segment.
The streambeds and sediments may have very high brightness (BR-post) after drying: object c, for instance, has a brightness value of 0.76, which is even higher than most landslides. Thus, using only brightness-related conditions to eliminate non-landslide segments is not enough. However, the second ruleset could eliminate the non-landslide segments neighboring landslide segments by considering their brightness differences. Removing other land covers such as bare soil from neighboring landslide areas could specify and boost the landslide’s exact boundaries and edges, which is difficult when applying any DL model, including the ResU-Net model. Most DL models tend to produce fuzzy boundaries (especially with high intra-class variability but low inter-class disparity). Therefore, they cannot maintain geometric fidelity since they operate on a pixel level (Chen, Ming, & Lv, Citation2019). As mentioned in this study area, there are non-vegetated areas in flat and steep regions like riverbeds and rocky terrains, respectively, that could be easily delineated using NDVI-related features. Although topographic features such as elevation and slope may not represent landslides and non-landslide segments, they are also considered beneficial mainly for detecting the source and transition areas of the landslides.
This paper is the first study integrating OBIA with an FCN model for landslide detection from open-source data with medium spatial resolution. Only one study is similar to our work in terms of applying OBIA and DL models, that of Lu et al. (Citation2020). However, they used an OBIA approach to generate landslide samples from low-altitude Unmanned Aerial Vehicle (UAV) images with VHR (spatial resolution of 0.2 m) for training some DL models, including a CNN model. Similarly, almost all of the studies that have developed and applied FCN models for landslide detection have based their work on VHR imagery. However, the accuracy of our integrated approach is comparable to the results of current approaches that use VHR images to train and test FCN models. For instance, the studies carried out by Liu et al. (Citation2020), Qi et al. (Citation2020), and Yi and Zhang (Citation2020) compared the U-Net and ResU-Net algorithms’ applicability for landslide detection using VHR imagery. Soares et al. (Citation2020) used a U-Net model for landslide segmentation from very high-resolution satellite imagery. Their highest -score values were 0.55 and 0.58 in two different areas considered for testing their model performance. However, our resulting -score value was more than 0.76, even using medium resolution, freely available satellite images. There is also one study, by Nava et al. (Citation2021) on the same topic as this study. As we did, they used optical images of Sentinel-2, but they also successfully integrated SAR data from Sentinel-1 productions. Even so, as they create the landslide maps by overlaying the shape-file of pre-mapped landslide polygons on the corresponding patches that predict landslides, their results cannot be comparable with that of our models, which have predicted the exact location and boundaries of the landslides.
6. Conclusions and future work
This paper showed the feasibility of integrating an OBIA approach with an FCN model, through refinement and post-processing, for landslide detection from Sentinel-2 images. Although we achieved promising results for our integrated approach, the applied rule-based OBIA is merely a post-processing refinement. It is unlikely to detect landslides without the probability feature of the ResU-Net model. Therefore, we could not compare the results of the ResU-Net model and the integrated model with results from the rule-based OBIA image segmentation approach. This matter can be considered a limitation of the current study that can be alleviated in future work by developing a rule-based OBIA image segmentation approach as an independent instance segmentation approach. We also aim to evaluate the generalization of different networks that trained based on original post-event images with and without multi-temporal image difference indices. Moreover, the transferability of the proposed model has not been evaluated for other geographical areas or the same area at different times, which is considered a limitation of this study. The differences between factors like the topographical characteristics, seasonal effects on the vegetation, landslide size, shape, and distribution pattern, the threshold values may require modification in the thresholds values; even some specific new rulesets may be defined.
Acknowledgments
This research was funded by the Institute of Advanced Research in Artificial Intelligence (IARAI) GmbH. We are grateful to the European Space Agency (ESA) and Google Earth Engine (GEE) for providing Sentinel-2 MSI images and online computation. We acknowledge the use of ALOS PALSAR data provided by services from Alaska Satellite Facility (ASF), part of the NASA’s Earth Science Data and Information System (ESDIS). The authors are grateful to the anonymous referees for their useful comments/suggestions that have helped us to improve an earlier version of the manuscript.
Data Availability Statement
Data available on request.
Disclosure statement
No potential conflict of interest was reported by the author(s).
Additional information
Funding
Notes on contributors

Omid Ghorbanzadeh
Omid Ghorbanzadeh graduated with a Ph.D. in applied Geoinformatics at the Doctoral College GIScience, University of Salzburg, Austria, in 2021. He works as a researcher at the AI4RS group in the Institute of Advanced Research in Artificial Intelligence (IARAI), Vienna, Austria.
His current research interests include image processing, machine (deep) learning, object-based image analysis (OBIA), remote sensing, and data fusion. Dr. Ghorbanzadeh is the author or co-author of over 50 papers in international journals. He was a recipient of the best student paper award at the GISTAM 2019 Conference, granted MDPI-Remote Sensing 2021 best paper award, and the 2021 award for best research paper by Taylor & Francis-Journal of Spatial Science. In addition, he serves as an Associate Editor for the MDPI-Remote Sensing.

Khalil Gholamnia
Khalil Gholamnia graduated from the University of Mazandaran, Iran with B.A. in urban geography planning in 2013. He continued his M.A program in remote sensing and GIS at the University of Tabriz, Iran, in 2015. He has been a lecturer at universities in Iran until 2018. Nowadays, he works for some consulting engineering companies. He can work with multiple satellite image processing such as radar, thermal, and optical. He also has experience in artificial intelligence and machine learning in GIS analysis.

Pedram Ghamisi
Pedram Ghamisi graduated with a Ph.D. in electrical and computer engineering at the University of Iceland in 2015. He works as (1) the head of the machine learning group at Helmholtz-Zentrum Dresden-Rossendorf (HZDR), Germany and (2) visiting professor and group leader of AI4RS at the Institute of Advanced Research in Artificial Intelligence (IARAI), Austria. He is a co-founder of VasoGnosis Inc. with two branches in San Jose and Milwaukee, the USA.
He was the co-chair of IEEE Image Analysis and Data Fusion Committee (IEEE IADF) between 2019 and 2021. Dr. Ghamisi was a recipient of the IEEE Mikio Takagi Prize for winning the Student Paper Competition at IEEE International Geoscience and Remote Sensing Symposium (IGARSS) in 2013, the first prize of the data fusion contest organized by the IEEE IADF in 2017, the Best Reviewer Prize of IEEE Geoscience and Remote Sensing Letters in 2017, and the IEEE Geoscience and Remote Sensing Society 2020 Highest-Impact Paper Award. His research interests include interdisciplinary research on machine (deep) learning, image and signal processing, and multisensor data fusion. For detailed info, please see http://pedram-ghamisi.com/.
References
- Aimaiti, Y., Liu, W., Yamazaki, F., & Maruyama, Y. (2019). Earthquake-induced landslide mapping for the 2018 Hokkaido Eastern Iburi Earthquake Using PALSAR-2 data. Remote Sensing, 11(20), 2351.
- Baatz, M., Hoffmann, C., & Willhauck, G. (2008). Progressing from object-based to object-oriented image analysis. In Object-based image analysis (pp. 29–42). Berlin, Heidelberg: Springer.
- Bacha, A. S., Van Der Werff, H., Shafique, M., & Khan, H. (2020). Transferability of object-based image analysis approaches for landslide detection in the Himalaya Mountains of northern Pakistan. International Journal of Remote Sensing, 41(9), 3390–3410.
- Benz, U. C., Hofmann, P., Willhauck, G., Lingenfelder, I., & Heynen, M. (2004). Multi-resolution, object-oriented fuzzy analysis of remote sensing data for GIS-ready information. ISPRS Journal of Photogrammetry and Remote Sensing, 58(3–4), 239–258.
- Blaschke, T., Hay, G. J., Kelly, M., Lang, S., Hofmann, P., Addink, E., … Tiede, D. (2014). Geographic object-based image analysis–towards a new paradigm. ISPRS Journal of Photogrammetry and Remote Sensing, 87, 180–191.
- Blaschke, T. (2010). Object based image analysis for remote sensing. ISPRS Journal of Photogrammetry and Remote Sensing, 65(1), 2–16.
- Chen, T., Trinder, J. C., & Niu, R. (2017). Object-oriented landslide mapping using ZY-3 satellite imagery, random forest and mathematical morphology, for the Three-Gorges Reservoir, China. Remote Sensing, 9(4), 333.
- Chen, Y., Ming, D., & Lv, X. (2019). Superpixel based land cover classification of VHR satellite image combining multi-scale CNN and scale parameter estimation. Earth Science Informatics, 12(3), 341–363.
- Dabiri, Z., Hölbling, D., Abad, L., Helgason, J. K., Sæmundsson, Þ., & Tiede, D. (2020). Assessment of landslide-induced geomorphological changes in Hítardalur Valley, Iceland, using sentinel-1 and sentinel-2 data. Applied Sciences, 10(17), 5848.
- Definiens, A. (2006). Definiens professional 5 user guide. Definiens AG, Munich.
- Doshida, S. (2020). Evaluation of secondary landslide susceptibility for the rescue activity using LiDAR UAV data. In Workshop on world landslide forum (pp. 283–287). Cham: Springer.
- Ghorbanzadeh, O., Blaschke, T., Gholamnia, K., Meena, S. R., Tiede, D., & Aryal, J. (2019, Jan). Evaluation of different machine learning methods and deep-learning convolutional neural networks for landslide detection. (In English), Remote Sens-Basel, 11(2), 196. doi: ARTN 196
- Ghorbanzadeh, O., Crivellari, A., Ghamisi, P., Shahabi, H., & Blaschke, T. (2021). A comprehensive transferability evaluation of U-net and ResU-Net for landslide detection from Sentinel-2 data. Scientific Reports, 11(1), 1–20.
- Ghorbanzadeh, O., Tiede, D., Wendt, L., Sudmanns, M., & Lang, S. (2020). Transferable instance segmentation of dwellings in a refugee camp - integrating CNN and OBIA. European Journal of Remote Sensing, 1–14. doi:10.1080/22797254.2020.1759456
- Guzzetti, F., Carrara, A., Cardinali, M., & Reichenbach, P. (1999). Landslide hazard evaluation: A review of current techniques and their application in a multi-scale study, Central Italy. Geomo, 31(1–4), 181–216.
- Guzzetti, F., Mondini, A. C., Cardinali, M., Fiorucci, F., Santangelo, M., & Chang, K.-T. (2012). Landslide inventory maps: New tools for an old problem. Earth-Science Reviews, 112(1–2), 42–66.
- Hay, G., & Blaschke, T. (2010). Special issue on Geographic Object-Based Image Analysis (GEOBIA). PE&RS, Photogrammetric Engineering & Remote Sensing, 76(2), 99–202.
- Hölbling, D., Füreder, P., Antolini, F., Cigna, F., Casagli, N., & Lang, S. (2012). A semi-automated object-based approach for landslide detection validated by persistent scatterer interferometry measures and landslide inventories. Remote Sensing, 4(5), 1310–1336.
- Kawamura, S., Kawajiri, S., Hirose, W., & Watanabe, T. (2019). Slope failures/landslides over a wide area in the 2018 Hokkaido Eastern Iburi earthquake. Soils and Foundations, 59(6), 2376–2395.
- Kingma, D. P., & Ba, J. (2014). Adam: A method for stochastic optimization. arXiv Preprint arXiv:1412.6980.
- Lang, S., Hay, G. J., Baraldi, A., Tiede, D., & Blaschke, T. (2019). Geobia achievements and spatial opportunities in the era of big earth observation data. ISPRS International Journal of Geo-Information, 8(11), 474.
- Lei, T., Xue, D., Lv, Z., Li, S., Zhang, Y., & Nandi, A. K. (2018). Unsupervised change detection using fast fuzzy clustering for landslide mapping from very high-resolution images. Remote Sens-Basel, 10(9), 1381.
- Liu, P., Wei, Y., Wang, Q., Chen, Y., & Xie, J. (2020). Research on post-earthquake landslide extraction algorithm based on improved U-Net model. Remote Sensing, 12(5), 894.
- Long, J., Shelhamer, E., & Darrell, T. (2015). Fully convolutional networks for semantic segmentation. in Proceedings of the IEEE conference on computer vision and pattern recognition, pp. 3431–3440.
- Lu, H., Ma, L., Fu, X., Liu, C., Wang, Z., Tang, M., & Li, N. (2020). Landslides information extraction using object-oriented image analysis paradigm based on deep learning and transfer learning. Remote Sensing, 12(5), 752.
- Ma, L., Zhu, X., Qiu, C., Blaschke, T., & Li, M. (2021). Advances of local climate zone mapping and its practice using object-based image analysis. Atmosphere, 12(9), 1146. [2021]. Available. https://www.mdpi.com/2073-4433/12/9/1146
- Melis, M. T., Da Pelo, S., Erbì, I., Loche, M., Deiana, G., Demurtas, V., & Scaringi, G. (2020). Thermal remote sensing from UAVs: A review on methods in coastal cliffs prone to landslides. Remote Sens-Basel, 12(12), 1971.
- Mondini, A. C., Chang, K.-T., & Yin, H.-Y. (2011). Combining multiple change detection indices for mapping landslides triggered by typhoons. Geomorphology, 134(3–4), 440–451.
- Mondini, A. C., Guzzetti, F., Chang, K.-T., Monserrat, O., Martha, T. R., & Manconi, A. (2021). Landslide failures detection and mapping using synthetic aperture radar: Past, present and future. Earth-Science Reviews, 1, 103574.
- Mondini, A., Guzzetti, F., Reichenbach, P., Rossi, M., Cardinali, M., & Ardizzone, F. (2011). Semi-automatic recognition and mapping of rainfall induced shallow landslides using optical satellite images. Remote Sensing of Environment, 115(7), 1743–1757.
- Munyati, C. (2018). Optimising multiresolution segmentation: Delineating savannah vegetation boundaries in the Kruger National Park, South Africa, using Sentinel 2 MSI imagery. International Journal of Remote Sensing, 39(18), 5997–6019.
- Naboureh, A., Bian, J., Lei, G., & Li, A. (2021). A review of land use/land cover change mapping in the China-Central Asia-West Asia economic corridor countries. Big Earth Data, 5(2), 237–257.
- Nava, L., Monserrat, O., & Catani, F. (2021). Improving landslide detection on sar data through deep learning. arXiv Preprint arXiv:2105.00782.
- Nhu, V.-H., Mohammadi, A., Shahabi, H., Ahmad, B. B., Al-Ansari, N., Shirzadi, A., … Nguyen, H. (2020). Landslide detection and susceptibility modeling on Cameron Highlands (Malaysia): A comparison between random forest, logistic regression and logistic model tree algorithms. Forests, 11(8), 830.
- Osanai, N., Yamada, T., Hayashi, S.-I., Kastura, S., Furuichi, T., Yanai, S., … Miyazaki, M. (2019). Characteristics of landslides caused by the 2018 Hokkaido Eastern Iburi Earthquake. Landslides, 16(8), 1517–1528.
- Ozaki, M., & Taku, K. (2014). 1: 200,000 land geological map in the Ishikari depression and its surrounding area with explanatory note. Seamless Geoinformation of Coastal Zone “Southern Coastal Zone of the Ishikari Depression”, Seamless Geological Map of Costal Zone S-4, Geological Survey of Japan ALST.
- Ozturk, U., Saito, H., Matsushi, Y., Crisologo, I., & Schwanghart, W. (2021). Can global rainfall estimates (satellite and reanalysis) aid landslide hindcasting? Landslides, 18(9), 3119–3133.
- Pourghasemi, H. R., & Rahmati, O. (2018). Prediction of the landslide susceptibility: Which algorithm, which precision? Catena, 162, 177–192.
- Prakash, N., Manconi, A., Loew, S., Heřmánková, B., Bubová, K., Komarc, M., … Tomčík, M. (2021). A new strategy to map landslides with a generalized convolutional neural network. Scientific Reports, 11(1), 1–15.
- Qi, W., Wei, M., Yang, W., Xu, C., & Ma, C. (2020). Automatic mapping of landslides by the ResU-Net. Remote Sens-Basel, 12(15), 2487.
- Rahman, M., Ningsheng, C., Mahmud, G. I., Islam, M. M., Pourghasemi, H. R., Ahmad, H., … Dewan, A. (2021). Flooding and its relationship with land cover change, population growth, and road density. Geoscience Frontiers, 12(6), 101224.
- Ronneberger, O., Fischer, P., & Brox, T., “U-net: Convolutional networks for biomedical image segmentation,” in International Conference on Medical image computing and computer-assisted intervention, 2015: Cham: Springer, pp. 234–241.
- Shahabi, H., Jarihani, B., Tavakkoli Piralilou, S., Chittleborough, D., Avand, M., & Ghorbanzadeh, O. (2019). A semi-automated object-based gully networks detection using different machine learning models: A case study of bowen catchment, Queensland, Australia. Sensors, 19(22), 4893.
- Soares, L. P., Dias, H. C., & Grohmann, C. H. (2020). Landslide segmentation with U-Net: Evaluating different sampling methods and patch sizes. arXiv Preprint arXiv:2007.06672.
- Su, Z., Chow, J. K., Tan, P. S.,Wu, J., Ho, Y. K., & Wang, Y.-H. (2020). Deep convolutional neural network–based pixel-wise landslide inventory mapping. Landslides, 18(4), 1421–1443.
- Tavakkoli Piralilou, S., Shahabi, H., Jarihani, B., Ghorbanzadeh, O., Blaschke, T., Gholamnia, K., and Aryal, J. (2019). Landslide detection using multi-scale image segmentation and different machine learning models in the Higher Himalayas. Remote Sens-Basel, 11(21), 2575. [2019]. Available. https://www.mdpi.com/2072-4292/11/21/2575
- Tehrani, F. S., Santinelli, G., & Herrera Herrera, M. (2021). Multi-regional landslide detection using combined unsupervised and supervised machine learning. Geomatics, Natural Hazards and Risk, 12(1), 1015–1038.
- Xu, Q., Ouyang, C., Jiang, T., Fan, X., & Cheng, D. (2019). DFPENet-geology: A deep learning framework for high precision recognition and segmentation of co-seismic landslides. arXiv Preprint arXiv:1908.10907.
- Yamagishi, H., & Yamazaki, F. (2018). Landslides by the 2018 Hokkaido Iburi-Tobu earthquake on september 6. Landslides, 15(12), 2521–2524.
- Ye, C., Li, Y., Cui, P., Liang, L., Pirasteh, S., Marcato, J., … Li, J. (2019). Landslide detection of hyperspectral remote sensing data based on deep learning with constrains. IEEE Journal of Selected Topics in Applied Earth Observations and Remote Sensing, 12(12), 5047–5060.
- Yi, Y., & Zhang, W. (2020). A new deep-learning-based approach for earthquake-triggered landslide detection from single-temporal rapideye satellite imagery. IEEE Journal of Selected Topics in Applied Earth Observations and Remote Sensing, 13, 6166–6176.
- Zhang, C., Atkinson, P. M., George, C., Wen, Z., Diazgranados, M., & Gerard, F. (2020). Identifying and mapping individual plants in a highly diverse high-elevation ecosystem using UAV imagery and deep learning. ISPRS Journal of Photogrammetry and Remote Sensing, 169, 280–291.
- Zhang, S., Li, R., Wang, F., & Iio, A. (2019). Characteristics of landslides triggered by the 2018 Hokkaido Eastern Iburi earthquake, Northern Japan. Landslides, 16(9), 1691–1708.
- Zhang, Z., Liu, Q., & Wang, Y. (2018). Road extraction by deep residual u-net. IEEE Geoscience and Remote Sensing Letters, 15(5), 749–753.
- Zhu, X. X., Tuia, D., Mou, L., Xia, G.-S., Zhang, L., Xu, F., & Fraundorfer, F. (2017). Deep learning in remote sensing: A comprehensive review and list of resources. IEEE Geoscience and Remote Sensing Magazine, 5(4), 8–36.