
Abstract
For the past 10 years, mini-host models and in particular the greater wax moth Galleria mellonella have tended to become a surrogate for murine models of fungal infection mainly due to cost, ethical constraints and ease of use. Thus, methods to better assess the fungal pathogenesis in G. mellonella need to be developed. In this study, we implemented the detection of Candida albicans cells expressing the Gaussia princeps luciferase in its cell wall in infected larvae of G. mellonella. We demonstrated that detection and quantification of luminescence in the pulp of infected larvae is a reliable method to perform drug efficacy and C. albicans virulence assays as compared to fungal burden assay. Since the linearity of the bioluminescent signal, as compared to the CFU counts, has a correlation of R2 = 0.62 and that this method is twice faster and less labor intensive than classical fungal burden assays, it could be applied to large scale studies. We next visualized and followed C. albicans infection in living G. mellonella larvae using a non-toxic and water-soluble coelenterazine formulation and a CCD camera that is commonly used for chemoluminescence signal detection. This work allowed us to follow for the first time C. albicans course of infection in G. mellonella during 4 days.
Introduction
Candida spp. are the 4th most commonly isolated pathogen from nosocomial bloodstream infection (BSI) in the US and rank at the 6th position in Europe, accounting for 9% of all the isolates worldwide.Citation1,2 Among Candida spp, C. albicans is the most common species with around 50% of all of the Candida isolates consisting of C. albicans. Compared to other pathogens that cause nosocomial BSI, Candida spp. induce the highest crude mortality rate (39.2%) even if antifungal drugs are used.Citation1 Therefore, it is important to better understand host-C. albicans interactions which may lead to the identification of new drug targets.
Robust animal models mimicking human systemic infection by fungi are thus needed. Most of the in vivo studies on C. albicans currently use the murine infection model. However, even if the murine model reflects some aspects of the infection in the human body, this model has several limitations, including cost and ethical considerations, which are serious limitation for large-scale analyses such as in vivo screening of mutant collections. Therefore, alternative infection models have been developed using fruit flies, mosquitoes, cockroaches, zebra fishes, amoebae (including slime molds) and moth larvae.Citation3 Even though these models are more distant from humans than mice, all of them have the advantages of being cost- and time-effective as well as easy to manipulate in terms of growth and storage. Insect models have the advantage of possessing a rudimentary innate immune system. In addition, some larvae like those of Galleria mellonella can be incubated between 30 and 37°C, which is optimal for C. albicans growth.Citation3,4 G. mellonella was also shown to be a good alternative to the mouse model of systemic infection for C. albicans virulence or colonization assays.Citation5,6 Evaluation of C. albicans fungal burden via colony forming units (CFU) counting in the entire larvae is one of the readouts of fungal infection used to assess drug efficacy or strain virulence.Citation6-8 However, CFU counting from larvae is a laborious process that includes homogenization of larvae, serial dilutions of homogenates and plating on agar plates followed by CFU counting after 1–2 days incubation. In addition, to firmly establish G. mellonella as a mice surrogate animal model in C. albicans studies a better knowledge of the fungal course of infection of G. mellonella larvae becomes necessary.
Bioluminescence imaging (BLI) might be used to improve the fungal burden evaluation in the larvae and to follow the infection over-time in entire larvae. Several bioluminescence imaging systems are currently available for expression in C. albicans including firefly luciferase with luciferin as substrate,Citation9 and the Gaussia princep luciferase fused to a GPI anchor protein PGA59 with coelenterazine as substrate.Citation10 In previous studies firefly luciferase was shown to give a signal too low for systemic infection probably due to limited substrate uptake by hyphae (for review seeCitation11). Recently C. albicans-optimized firefly luciferase was shown to be reliable to perform systemic infection.Citation12 In the present study, we used the Gaussia princeps luciferase reporter system expressed in C. albicans cells developed by Enjalbert et al.,Citation10 where the luciferase is fused to a GPI anchor protein and is thus expressed at the surface of yeast cells. Even if this luciferase was shown not to be highly optimal for systemic infections due to a probable non-homogeneous diffusion of the substrate, this construct was successfully used to study murine superficial or mucocutaneous infection.Citation10 It was also used by Gabrielli et al.Citation13 to study oropharyngeal infection in mice in which CFU in the tongue, stomach and esophagus was compared with bioluminescent signals.Citation13 In our study, the measurement of luminescence in infected larvae homogenates compared to CFU counts appeared to be reliable and was applied to assess drug efficacy and to perform C. albicans virulence assays. We next demonstrated that C. albicans bioluminescent strains could be detected in living animals using a commonly used charge-couple device (CCD) camera. In vivo detection correlated highly with CFU counts. With the use of a water-soluble formulation of the coelenterazine, the bioluminescence was efficiently recorded by a CCD camera to perform, to our knowledge, the first kinetic study of a C. albicans wild-type strain infecting G. mellonella larvae with or without antifungal treatment.
Results
In vitro optimization of gLUC-PGA59 expression levels
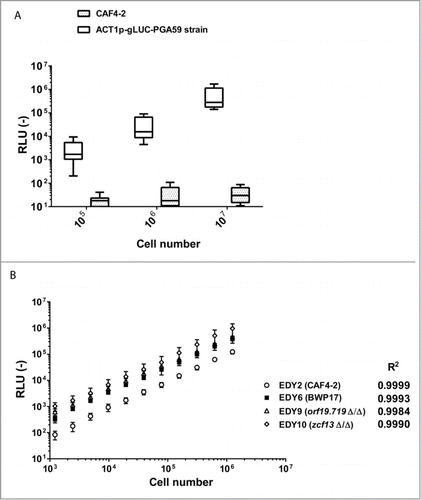
In this study, we aimed to detect luminescent C. albicans cells from entire live infected G. mellonella larvae. Thus, luciferase signals from C. albicans cells had to be assessed in order to be as high as possible. First, we tested signals obtained by the gLUC-PGA59 construct under the control of the ACT1 promoter as previously described by Enjalbert et al.Citation10 Our ACT1p-gLUC-PGA59 construct was transformed in the C. albicans strain CAF4-2. Luciferase activities of 10 transformants were next recorded in 10-fold diluted suspensions ranging from 105 to 107 cells in 96-well plates with a luminometer (see File S1). A clear dose response was observed with at least a 100-fold higher signal intensity as compared to background (). The strain with the highest luminescence signal was selected and named EDY2 for the following of the experiments. Correlation between the number of cells and the luminescent signal measured was assessed using 2-fold dilutions of cell suspensions ranging from 103 to 107 cells in a 96-well plate in a luminometer (). We observed a linear relationship between number of cells and luminescent signal (R2 > 0.99).
Figure 1. Reliability of the signal emitted by ACT1p-gLUC-PGA59 construct in C. albicans. (A) Evaluation of the luminescence signal emitted by CAF4-2 strain transformed with ACT1p-gLUC-PGA59 construct. Each box corresponds to the Relative Luminescence Unit (RLU) of 10 independent transformants measured in duplicates. Horizontal lines represent mean and 10-90 percentiles. Wiskers reach the minimal and maximal values. (B) Luminescence signals emitted by 2-fold cell suspension dilutions of different strains with the ACT1p-gLUC-PGA59 construct. This analysis was performed with a single transformant for each strain. These strains correspond to 2 different wild-type strains (CAF4-2 and BWP17) and 2 mutants derived from the BWP17 (orf19.719Δ/Δ and zcf13Δ/Δ). Each point corresponds to the average of biological replicates (n = 3) of cell suspensions at defined concentrations. This experiment is representative of 2 independent experiments. Correlation (R2) between RLU and CFU was calculated with a Pearson test (p < 0.0001 for all tested strains) using Graph Pad Prism 6, on this set of data. RLU (−): arbitrary units of luminescent signal.
Ex vivo luminescence signal monitoring in G. mellonella pulp
Dose response of the luminescence signals in G. mellonella pulp
As a first attempt to detect luminescence of C. albicans infecting G. mellonella, we aimed to assess the dose response of the luminescence signal in infected G. mellonella pulp. For this purpose, larvae (6 per group) were injected with EDY2 cells containing the ACT1p-gLUC-PGA59 construct at infectious doses ranging from 2 × 10⁵ to 5 × 10⁵ cells per larva. The luminescence signal was recorded in larvae pulps 24 h post-infection in a 96-well plate using a luminometer. In parallel, CFU enumeration was performed on the same G. mellonella pulp samples to estimate fungal burden.Citation6-8 Luminescence signals were then compared to the obtained CFU counts (). First, we were able to detect cell number as low as 103 emitting a signal of about 102 RLU and up to almost 105 cells per larvae (104 RLU). We estimated the overall correlation between CFU and RLU at R2 = 0.62.
Figure 2. Dose response of the luminescence signal of C. albicans luminescent cells detected in the pulp of G. mellonella larvae. Each point corresponds to a single larva. Six animals were injected with a given dose of C. albicans cells. CFU counts and luminescence signals were measured 24 h post-infection. Missing points are due to dead animals at 24 h post-infection. This experiment is representative of 2 independent experiments. Correlation (R2) between RLU and CFU was calculated with a Pearson test (p < 0.0001 for all tested strains) using Graph Pad Prism 6. RLU (−): arbitrary units of luminescent signal.
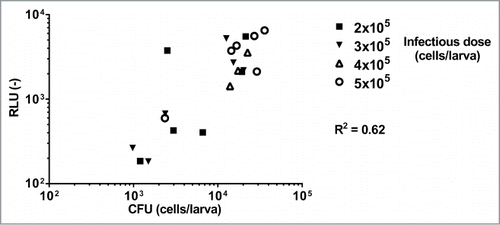
Taking into account that the mortality rate of the larvae increased proportionally to the infectious dose,Citation8,14 we thus decided to establish the infectious dose at 3 × 10⁵ cells per larva in the following ex vivo experiments to avoid mortality and to allow detection of low CFU.
Assessment of fluconazole effect in infected G. mellonella larvae
We aimed to validate luminescence detection as a potential method to assess the effect of fluconazole on G. mellonella infections. G. mellonella has previously been shown to be an acceptable model to assess antifungal drug efficacy either by survival measurements or by fungal burden assays.Citation8 Thus, G. mellonella larvae (8 per group) were infected with 3 × 10⁵ cells per larva and treated with 1 or 4 mg/kg fluconazole 1 h post-infection. Larvae were sacrificed at 24 h or 48 h post-infection. Luminescence signals were then recorded in larvae pulps and compared to CFU counts ().
Figure 3. Effect of fluconazole on G. mellonella larvae infected with luminescent C. albicans cells. G. mellonella were infected with 3 × 10⁵ C. albicans cells. Each point corresponds to a single larva. The horizontal line corresponds to the mean of the group. Each group contained 8 larvae. Fluconazole was injected at 1 h post-infection. Statistical analysis was performed on processed data to remove outliers using the ROUT (Q = 1%) method. A non-parametric ANOVA analysis was performed with a Dunn post-test comparing each group with the corresponding non-treated group (24 h or 48 h), using Graph Pad Prism 6. *p <0.05, **p < 0.01. These data is representative of 2 independent experiments. RLU (−): arbitrary units of luminescent signal.
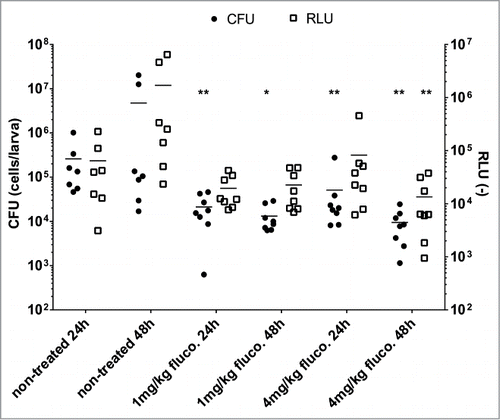
The effect of the fluconazole treatment (4 mg/kg) on the larvae infection resulted in at least a 10-fold reduction of the fungal burden as compared to the non-treated group at 48 h post-infection. Similar to CFU counting, RLU signals decreased significantly 48 h post-infection in the fluconazole-treated group (). During earlier time-points and using lower fluconazole dosage, a decrease of signal intensity was measured similarly to the CFU counting in the larvae pulp as compared to the untreated groups but with no statistical significance. Taken together, our results show that luminescence signal measurement in the larvae pulp is a suitable alternative to classical CFU counting for measuring strong drug efficacy.
Detection of difference in virulence of C. albicans strains in G. mellonella
We assessed the virulence of transcription factor (TF) mutants in G. mellonella measuring the larvae fungal burden 24 h post-infection.Citation6,15 Realizing that this screening was time- and material consuming, we addressed the feasibility of performing virulence assays using ex vivo luminescence detection system developed here.
In the present study we focused on 16 TF mutants which were not tested for fungal burden phenotype in previous analysis for technical reasons.Citation6 As control we used first a cmp1Δ/Δ strain as an already known avirulent strainCitation16 and also a zcf13 mutant strain which was already described as a TF mutant displaying a lower fungal burden in mice kidney than wild-type strain.Citation15 Results of larvae fungal burden 24h post-infection are presented in . Results were expressed as percentage of the mean of CFUs obtained with the wild-type in order to merge data of several independent experiments. As expected, the cmp1Δ/Δ displayed the lowest fungal burden and the zcf13 mutant displayed also a significant reduced fungal burden (), thus validating our experiments in G. mellonella. Two out of 16 tested TF mutants (orf19.719 and tel1), displayed a significantly reduced fungal burden as compared to wild-type. Given that the tel1 mutant displayed a significant in vitro growth deficiency, only the orf19.719 mutant appeared to have a clear decrease capacity to grow and replicate in the host. Thus to validate the feasibility of a virulence assay using the ex vivo luciferase detection system, we selected orf19.719 mutant for luciferase detection in larvae pulp. For this purpose, BCY31 (isogenic wild-type), BCY152 (zcf13 mutant) and BCY401 (orf19.719 mutant) were transformed with the ACT1p-gLUC-PGA59 construct. The zcf13 mutant was used as a control for low fungal burden phenotype as shown in our previous analyses.Citation6,15 As above performed with the CAF4-2 strain, 10 transformants of each strain (BCY31, BCY152, and BCY401) were analyzed to select the transformant with the highest bioluminescent signal (see File S1). This analysis allowed selection of EDY6 (wild-type), EDY9 (orf19.719 mutant) and EDY10 (zcf13 mutant) (). Like EDY2, as previously mentioned, EDY6, EDY9 and EDY10 could be efficiently and linearly detected (R2 > 0.99 between CFU and luminescence signals) (). The three strains were then used to address the correlation between the luminescence signals detected and fungal burdens in G. mellonella at 24h post-infection. In each experiment, 6 larvae per group were infected with an infectious dose of 3 × 10⁵ cells per larva with EDY6 (wild-type), EDY9 (orf19.719 mutant) and EDY10 (zcf13 mutant). The luminescence signals were recorded in larvae pulp at 24 h post-infection and compared with CFU counts. Since strains containing the same luciferase expression construct did not show exactly the same luminescence signals at the same cell concentrations (see File S1), we normalized RLU data by computing RLU/CFU standard curves for each strain (see File S2). We used these standard curves to predict CFU values from luminescence signals obtained for each infected larva. Both CFU counts and predicted-CFU were expressed as percentages of the mean of the CFU obtained with larvae infected with the wild-type () to enable duplicate merging. An ANOVA analysis on both the counted and predicted CFUs showed that for both zcf13 and orf19.719 mutants infected larvae, predicted fungal burdens were significantly lower than those of the wild-type. In conclusion, ex vivo luminescence read-outs clearly allow to measure differences of host fungal burden of different C. albicans strains, as it could be done with counted CFU.
Figure 4. Virulence assay using luminescent C. albicans mutant strains in the G. mellonella infection model. G. mellonella were infected with 3 × 10⁵ C. albicans cells. Results are expressed as percentage of the mean CFU of the wild-type in the same experiment to be able to merge duplicate experiments. (A) Fungal burden assay using 16 C. albicans TF mutants. These data correspond to the merging of 2 independent experiments. Each group of each experiment contained 6 larvae. Central horizontal lines correspond to the mean of the group. Error bars correspond to Standard Deviation (SD). Larvae fungal burden were evaluated at 24h post-infection and expressed for each larva as a percent of the fungal burden mean of larvae infected with the wild-type strain. Calculation was made for each experiment independently. (B) Each point corresponds to a single larva at 24h post-infection. Each group of each experiment contained 6 larvae. Fungal burden prediction using BLI reporter system. CFU prediction was performed using standard curves (see File S2). The two TF mutants were selected previously as displaying larvae low fungal burden as compared to the wild-type strain. These data correspond to 2 independent experiments. The horizontal line corresponds to the mean of the group. In both A and B panels, each larvae fungal burden was expressed as a percent of the fungal burden mean of larvae infected with the wild-type strain. Calculation was made for each experiment independently. Statistical analyses were performed on processed data to remove outliers using the ROUT (Q = 1%) method. Then a non-parametric ANOVA analysis was performed with a Dunn post-test comparing each mutant-infected group with the group infected by the wild type, using Graph Pad Prism 6. **p < 0.01, ***p < 0.001, ****p < 0.0001. RLU (−): arbitrary units of luminescent signal.
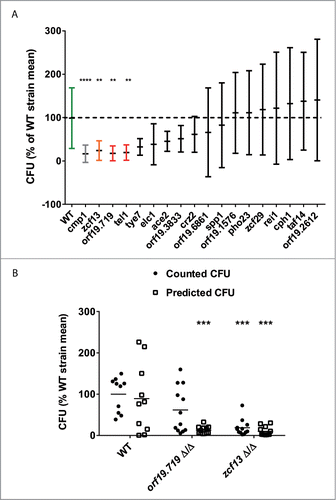
Table 1. Strains used in this study
BLI on living G. mellonella
Toxicity of non-water soluble CTZ on living G. mellonella
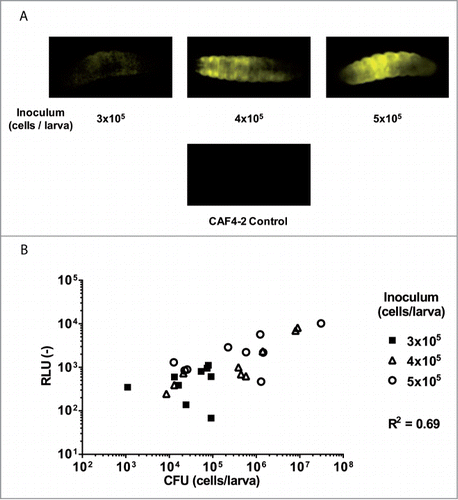
We further investigated whether it was possible to detect bioluminescent C. albicans cells in living larvae. To determine the optimal infection dose, we infected animals with EDY2 using 3 inocula (3 × 10⁵, 4 × 10⁵, and 5 × 10⁵ cells). The luminescence signals were recorded at 24 h post-infection in living animals using a CCD camera. As shown in , it was possible to efficiently measure bioluminescence signals using such a common detection system (). Immediately after image recording, the infected larvae were sacrificed to count CFUs in order to correlate them with bioluminescence signals. A correlation was observed (R2 = 0.69, ). We considered this degree of correlation suitable for further in vivo analyses.
Figure 5. Detection of luminescence signals of C. albicans cells in living animals. Direct detection of the luminescence signal in the living larvae 24 h post-infection was carried out using a ImageQuant LAS 4000 mini CCD camera (GE Healthcare Bio-Sciences). (A) A representative example of recorded signals of larvae infected with EDY2 luminescent strain. Larvae injected with non-luminescent CAF4-2 strain or with PBS were used as controls. (B) Comparison of luminescence signals with enumerated CFUs obtained after sacrifice of the larvae 24 h post-infection. Each point corresponds to a single larva. Results presented here merge data of 2 independent experiments. The first and the second experiments were performed with 3 and 6 animals per group, respectively. RLU (−): arbitrary units of luminescent signal.
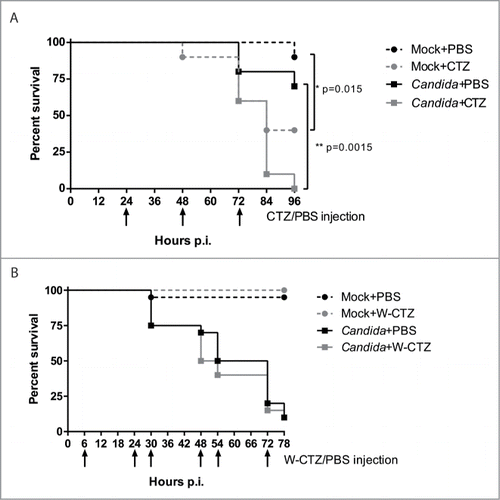
Bioluminescent C. albicans cells were shown to be efficiently detected directly from living larvae. In addition luminescence signals recorded in the larva exhibited a good correlation with fungal burdens. All together these results led us to use this method to follow the infection of the larvae over time. We infected G. mellonella larvae with an infectious dose of 4 × 10⁵ luminescent wild-type fungal cells per larva. The luminescence signal was detected in the living larvae at different time points. Unfortunately, due to high mortality, only a few animals survived after 24 h (data not shown). We therefore assessed the toxicity effect of multiple injections of Coelenterazine (CTZ) in larvae through a survival experiment (). For this purpose, animals were injected daily with 40 µl of 250 µM CTZ diluted in modified Luciferase Assay (LA) buffer. Surviving animals were monitored before each injection of CTZ. As shown in , injection of CTZ induced death in uninfected larvae since only 40% of the larvae survived after 3 CTZ injections in contrast to 90% of survival in PBS-treated larvae (p=0.015). The same result was observed with larvae infected with C. albicans and daily injected with CTZ or PBS. Animals injected with CTZ exhibited low survival (p = 0.0015). Toxicity was shown to be due to LA buffer only (File S3), however CTZ diluted in PBS did not allow detection of any bioluminescent signal (data not shown).
Figure 6. In vivo monitoring of the toxic effect of repeated injection of CTZ on G. mellonella larvae. Twenty animals per group were monitored for survival. At t = 0, larvae were infected with 4 × 10⁵ C. albicans cells in 40 μl. Then larvae were injected twice a day with 40 µl of 250 µM of CTZ or with PBS only. Surviving animals were monitored before every injection. (A) Effect of CTZ diluted in the modified LA buffer. Animals were injected at 12, 24, 48, 72 and 96h post-infection with 40 μl of CTZ 250 μM or PBS. *p < 0.05, **p < 0.01, Log-rank test. (B) Effect of water-soluble CTZ (W-CTZ) diluted in PBS. Animals were injected at 6, 24, 30, 48, 54 and 72h post-infection with 40 μl of W-CTZ 250 μM or PBS. In both experiments, (A) and (B), animal survival was recorded before every CTZ/PBS injection.
In vivo dose response of the luminescence signals in G. mellonella larvae using water-soluble CTZ
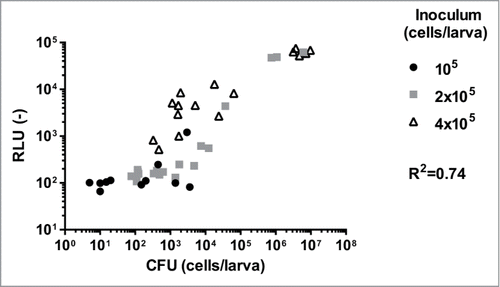
Following these results, we decided to use a newly developed non-toxic water soluble formulation of CTZ (W-CTZ). We first assessed the toxicity of W-CTZ with a survival assay (). Using this formulation we did not observe any noticeable toxic effect of W-CTZ (). Thus, we considered that W-CTZ was better suited for monitoring the kinetic of infection. The correlation between the CFU counts and in vivo RLU signals was first addressed. As performed with the non-water soluble CTZ, animals were infected with EDY2 and 3 inocula (105, 2 × 10⁵, and 4 × 10⁵ cells). The luminescence signals were recorded at 24 h post-infection in living animals using a CCD camera (). Immediately after luminescent signal measurements, animals were sacrificed and C. albicans CFU of the pulp were enumerated. A clear correlation could be observed (R2 = 0.74) between CFU counts and bioluminescence signals in living animals. Signals below 102 RLU were not detected, and RLU > 5 × 10⁴ seemed to saturate the CCD camera. The best linear response was observed for G. mellonella fungal burden between 103 to 106 CFU/larvae corresponding to RLU ranging from 102 to 104. The majority of data were obtained in this range and with larvae infected with 4 × 10⁵ fungal cells. Thus, the following in vivo experiments were performed using this inoculum.
Figure 7. Correlation between luminescence signals of living animal and CFU counts. Each point corresponds to a single larva. Missing points are due to dead animals 24h post-infection. Correlation (R2) between RLU and CFU was calculated with a Pearson test (p < 0.0001 for all tested strains) using Graph Pad Prism 6. Results presented here merged data of 2 independent experiments including each 10 larvae per group. RLU (−): arbitrary units of luminescent signal.
Kinetic of C. albicans infection through live imaging in G. mellonella
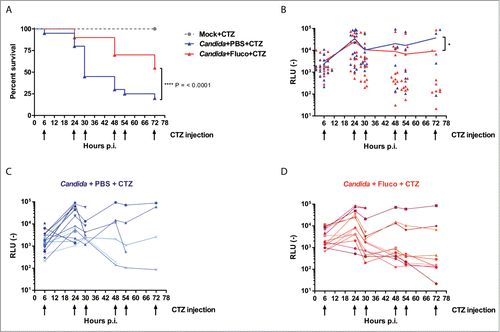
One hour after infection of G. mellonella with 4 × 10⁵ C. albicans cells, half of the animals were injected either with fluconazole (4 mg/kg) or PBS. A first measure of luminescence was performed 6 h post-infection. Animals were injected with W-CTZ or PBS. Then animal were monitored the same way, twice a day during 2 more days (). At each time point, survival was monitored and bioluminescence was measured on surviving animals. As expected, larvae treated with fluconazole survived longer than untreated larvae (). In parallel, we observed that untreated larvae displayed higher bioluminescence than fluconazole-treated larvae (), especially after 30 h post-infection. Taking into account only surviving insects until end of the experiment, a 2-way ANOVA analysis was performed on Log-normalized RLU signals. The resulting signal curves from treated and untreated larvae were significantly different (p = 0.03). This result is in agreement with CFU count measurements performed in the G. mellonella pulp at 24 h and 48 h post-infection (). In the experiment shown in , insects treated with fluconazole displayed luminescence signals significantly lower than untreated individuals but only after 48h post-infection. Before 30 h post-infection, signal intensities followed the same pattern. Luminescence signals increased between 6 and 24 h and then diminished between 24 and 30–48 h. This last time lapse seemed critical for the outcome of the animal survival. Particularly in the untreated group, the majority of the larvae died during this period due to inability to control the infection (). Taken together, these results displayed for the first time and in details the kinetic of C. albicans infection in G. mellonella in the absence and presence of fluconazole.
Figure 8. Kinetic of C. albicans infection in living G. mellonella in the presence of absence of fluconazole. Twenty animals per group were monitored daily for survival and emission of bioluminescence. At t = 0 larvae were infected with 4 × 10⁵ C. albicans cells and placed in 6-wells plate to identify each animal. One hour post-infection animals were injected with 4 mg/kg fluconazole or PBS. At 6, 24, 30, 48, 54 and 72 hours post-infection, animals were monitored for survival and W-CTZ was injected in surviving larvae just before imaging. (A) Survival curve. ****p < 0.0001, Log-rank test. (B) Overall kinetic of infection. At each time-point, each symbol represents an individual larva. *p < 0.05, 2-way ANOVA statistical analysis, using Graph Pad Prism 6 was performed on log normalized data. (C) Kinetic of infection for each untreated (PBS-injected) larva. (D) Kinetic of infection for each fluconazole (4 mg/kg) treated larva. For panel C and D, each line corresponds to an individual larva. Data presented in panel B are the combination of data of panels C and D. RLU (−): arbitrary units of luminescent signal.
Discussion
Even though the mouse systemic model of infection remains the gold standard to study C. albicans virulence, other alternative models such as the G. mellonella model have been used to reduce mouse utilization.Citation5,8,17-19 The advantages of G. mellonella larvae are their small size, simple tissue organization and capacity to be kept at C. albicans physiological temperature (between 30 and 37°C). Compared with mice, G. mellonella larvae allow easier implementation of fungal burden detection methods and thus large scale study.Citation6 In this study we evaluated a method to measure C. albicans fungal burden in G. mellonella through luminescence signals emitted by fungal cells. We showed for the first time kinetics of the C. albicans infection over time in this in vivo model.
In fungi, especially C. albicans and Aspergillus fumigatus, different systems of BLI systems have been developed (for review seeCitation11). In C. albicans, 2 BLI systems, firefly luciferaseCitation12,20 and Gaussia princep luciferaseCitation10 were developed for in vivo imaging in mice. The Gaussia princep BLI system designed by Enjalbert et al. Citation10 consists of a cell-wall expressed luciferase due to the fusion of the Gaussia princep luciferase with a GPI-anchor signal. This design yields good correlation between fungal loads and luminescence signals in the mouse superficial and subcutaneous infectionCitation10,13 and a slightly less accurate quantitative analysis in the systemicCitation10 candidiasis model of infection.
Until recently, in vivo BLI of pathogenic fungi was only implemented in mice. In G. mellonella only one BLI system, to our knowledge, has been developed for in vivo detection of the bacterial pathogen Enterococcus faecalis.Citation21 In their study, La Rosa et al.Citation21 used the luxABCDE reporter system specific for prokaryotes. In our study, we adapted an already developed BLI system using the gLUC-PGA59 construct of Enjalbert et al. Citation10 for the detection of C. albicans infecting G. mellonella.
First, detection of C. albicans with the gLUC-PGA59 construct was performed in vitro in G. mellonella larvae pulps. The comparison between the intensity of the luminescence signal obtained in cell suspension and CFU counts yielded a high correlation (R2 > 0.99), confirming results obtained by Enjalbert et al. (R2 > 0.98).Citation10 Then, we assessed 2 possible readouts, either in larvae pulps using a microtiter plate or directly in living animals using a simple sensitive CCD camera.
Even if the ex vivo detection of luminescent signal in larvae pulp excludes analysis of infection kinetics, we demonstrated its value to assess strain virulence and drug efficacy. One weakness of any luciferase system is that transformants of a given strain do not display the same level of luciferase activity. We claimed that this difference could be due to multiple insertion of the plasmid expressing the gLUC-PGA59 construct in the RPS10 locus. This multiple insertion could be avoided or at least reduced by integrating the gLUC-PGA59 cassette by homologous recombination in the Candida genome. This issue was not addressed in the work of Enjalbert et al.,Citation10 nor of Gabrielli et al.Citation13. In the present study we override this problem using a CFU/luminescence signal standard curve for each strain so that CFUs can be extrapolated from luminescence signals. Using this approach, we obtained very good correlation comparing bioluminescence signals and CFU counts from C. albicans infected larvae pulps (R2 = 0.62, p < 0.0001) when considering that this living environment has intrinsic higher variability than in vitro conditions. Moreover this correlation is higher than that obtained by Gabrielli et al.Citation13 in mice with oropharyngeal infection. In this work, the authors correlated CFU counts with bioluminescence signals obtained from excised organs and from the entire oral cavity (R2 = 0.33 for esophagus and stomach, and R2 = 0.37 in all oral cavity in living animals at day 3 post-infection).Citation13
When comparing in vivo imaging in living animals with CFU counts from the entire larvae, a good correlation was obtained (R2 = 0.74, p < 0.0001). This average correlation could be explained by the high stability of the Gaussia princep luciferase (half life time of around 7 days).Citation11,22 Thus this enzyme may still be active although the cells which expressed them are already dead. A major difference between previous studies using luciferase detection in vivo and this work are the detection methods. Citation10,13,20,21 Previous methods used a camera dedicated to in vivo BLI monitoring (Xenogen Ivis imaging system), whereas our detection system is a common CCD camera usually dedicated to in vitro luminescence signal detection such as immuno-detection applications. This easy detection method is attractive since CCD cameras are part of common laboratory equipment. Using this detection system, we were able to demonstrate that the luminescence signal was sufficiently detected in living animals to distinguish different fungal loads as demonstrated by dose response diagrams (). In addition, a major improvement in this study was the use of a recently marketed water-soluble and non-toxic CTZ formulation (W-CTZ). This W-CTZ allowed several injections in the larvae and thus establishment for the first time of the kinetic of C. albicans infection in G. mellonella living animals. This type of analysis could then be easily and more largely implemented to optimize/analyze antifungal treatments or to evaluate the effect of specific mutations in C. albicans on the course of G. mellonella infection. Such studies are currently being undertaken in our laboratory.
Material and Methods
Strains, plasmids, media and growth conditions
Escherichia coli DH5α was used as a host for plasmids propagation. To grow DH5α, LB broth medium was used and when necessary, supplemented with ampicillin (0.1 mg/ml). Cultures of E. coli were incubated at 37°C under constant agitation (220 rpm) for 16-20 h. For cultures on a plate, 0.7% Bacto™ Agar (Brunschwig, Switzerland) was added.
All C. albicans strains used in this study are listed in . C. albicans were grown in complete YEPD medium (2% Bacto peptone [Difco Laboratories, Basel, Switzerland]), 1% yeast extract [Difco] and 2% glucose [Fluka, Buchs, Switzerland]) at 30°C under constant agitation (220 rpm). For growth on plates, 2% Bacto™ Agar was added to the medium. Yeasts were transformed by a lithium-acetate procedure with slight modifications as previously described.Citation23 After addition of salmon sperm DNA (0.137 mg/ml, [Invitrogen]) and heat shock steps, nourseothricin-resistant transformants were resuspended in 1 ml of YEPD medium and incubated for at least 4 h at room temperature. The cells were harvested in 100 μl of YEPD and plated on YEPD agar plates containing 200 μg/ml nourseothricin (Werner Bioagents, Germany). For selection of URA+ transformants, the cells were resuspended in 100µl Tris-EDTA (TE) buffer (0.1 M Tris, pH 7.5, 10 mM EDTA, pH 8.0) and plated on YNB (0.67% Yeast nitrogen base without amino acids [Difco Laboratories, Basel, Switzerland], 2% glucose [Fluka, Buchs, Switzerland]) agar plates.
Plasmid constructions
All the plasmids used in this study are listed in . The ACT1 promoter was excised from CIpACT-C-ZZCitation24 by XhoI and HindIII and then cloned in CIp10-PGA59-gLUC from Enjalbert et al.Citation10 thus creating pED2 (). Finally, the URA3 marker of pED2 was replaced by the SAT1 marker. The SAT1 cassette was first amplified by PCR using primers SAT1-NotI-1 (ATAAGAATGCGGCCGCGTCAAAACTAGAGAATAATAAAG) and SAT1-NotI-2 (TACCGCGGCCGCTCTAGAACTAG), then digested by NotI and XbaI and ligated in pED2 to obtain pED6 ().
Table 2. Plasmids used in this study
Inoculation of C. albicans in G. mellonella
After reception from the supplier, G. mellonella larvae (Lepidoptera: pyralidae, greater wax moth) (Bait Express GmbH, Basel, Switzerland) were kept at 12°C in the dark with wood shavings. Depending on the experiment, 6 to 10 healthy larvae with weights ranging from 350 to 400 mg were placed in sterile 9 cm Petri dishes. To infect larvae, C. albicans cultures were grown to stationary phase in YEPD broth at 30°C under constant agitation (220 rpm). Cells were harvested by centrifugation (4500 g for 5 min), washed in PBS (137 mM NaCl, 2.7 mM KCl, 10 mM Na2HPO4, 1.8 mM KH2PO4) and re-suspended in PBS complemented with 200 µg/ml ampicillin (20 g/kg) at various cell densities, ranging from 2.5 to 12.5 × 10⁶ cells/ml. G. mellonella larvae were inoculated by injecting 40 µl of the cell suspensions through the last right proleg using a Myjector U-100 Insulin syringe (Terumo Europe) and placed at 30°C in the dark for up to 48 h. Uninjected larvae and larvae injected with 40 µl PBS plus ampicillin were included as controls. To determine minimal sample size, we did calculation on the dssresearch website (https://www.dssresearch.com/KnowledgeCenter/toolkitcalculators/samplesizecalculators.aspx). The settings used were α: 0.05 and 1-β = 0.5. We did the calculation using CFU data (mean and standard deviation) obtained in drug experiment assays at 24 h. Condition 1: non-treated versus 1mg/kg fluconazole gave a sample size of 6; Condition 2: non-treated vs. 4mg/kg fluconazole gave a sample size of 8. Thus, the minimal sample size that was used in the different experiments was a minimum of 8 animals. This number of animals gives a t-test with a power of only 50%.
Determination of fungal loads of inoculated G. mellonella
Inoculated G. mellonella larvae were incubated for 24 h at 30°C in the dark. Each larva was introduced into screw-cap tubes containing one metal bead (stainless steel, 7 mm, [VWR International]). To prevent melanization of the haemolymph, N-phenylthiourea (SIGMA-Aldrich) was added as described previously.Citation7 The larvae were homogenized in 2ml screw-cap tubes to a pulp using metal beads. The tube was closed and firmly agitated performing 3 10 s cycles at 6.5 m/s with a MP FastPrep®-24 equipment (MP Biomedicals). The homogenate was then resuspended in 6 ml PBS in a 14 ml Falcon tube, serially 10-fold diluted in PBS and 100 µl were plated on YEPD-chloramphenicol (50 µg/ml) plates and incubated at 30°C for 48 h. Colony-forming units (CFU) were then enumerated on 3 plates and means were calculated. Fungal loads were then expressed as CFU per larvae. The limit of detection is 60 CFU per larvae.
Luciferase assay
For in vitro cells suspension assays, C. albicans grown in liquid medium were centrifuged and washed once with PBS and once with luciferase assay buffer (LA buffer) (0.5 M NaCl, 0.1 M K2HPO4, 1 mM EDTA, 0.6 mM NaN3, 1 tablet/10 ml protease inhibitor cocktail [Complete, Mini, EDTA-free, Roche]). Fifty microliters of the culture were then loaded on a 96-well plate (half-area, black, COSTAR). Coelenterazine (CTZ) (Biosynth) resuspended in methanol (stock at 2.5 mM) was diluted in LA buffer at a final concentration of 2.5 µM and 60 μl were injected automatically into the wells, followed by orbital shaking of 3 sec before recording luciferase activity (RLU: Relative Luminescent Unit) using a 96-well plates luminometer (FLUOstar Omega, BMG Labtech).
For ex vivo assays, G. mellonella (350–400 mg) were infected with different doses of C. albicans cells from 102 to 107 cells and incubated at 30°C for 24 h in the dark. Then larvae were homogenized as previously described for fungal load determination. The pulp was then resuspended in 1 ml LA buffer and 50 µl of each sample was transferred into a microtiter plate (96-well half-area, black, COSTAR). This crude pulp was then diluted 10- and 100-fold, respectively. The pulp of each larva was analyzed in duplicate. Sixty microliters of CTZ in LA buffer (2.5 µM) was loaded automatically in each well just before the measure of luciferase activity (RLU: Relative Luminescent Unit) with a 96-well plate luminometer as described above. The remaining aliquots of the pulps were diluted in PBS and plated on YEPD-chloramphenicol (50 mg/ml) agarose plates and incubated at 30°C for CFU enumeration. To assess the effect of fluconazole, G. mellonella (350–400 mg) were infected with 3 × 10⁵ C. albicans cells and, 1 h post-infection, 40 µl of fluconazole was injected at concentrations of 1- and 4 mg/kg per larva.
For in vivo assay, luciferase activity (RLU: Relative Luminescent Unit) was detected directly from the larvae. G. mellonella (350-400 mg) were infected as previously described with different quantities of C. albicans cells (2 × 10⁵ to 6 × 10⁵ cells) expressing luciferase and incubated 24 h in the dark at 30°C.
First, native non-water soluble CTZ was resuspended in ethanol at 2.5 mM. Before use, CTZ was diluted to 250 µM in modified LA buffer without azide (0.5 M NaCl, 0.1 M K2HPO4, 1 mM EDTA, 1 tablet/10 ml protease inhibitor cocktail). Before recording of the luminescence signal with a CCD camera, 40 µl of CTZ were injected in the last proleg of the larvae. The larvae were then gently rolled between 2 fingers to disperse CTZ in the larvae body and immediately placed into the wells of a 6-well plate (COSTAR) filled with 1% low-melt agarose (SeaPlaque® GTG® Agarose, LONZA) in order to minimize the movements of the larvae.
Second, due to toxicity of the preparation of the native CTZ, a water soluble CTZ formulation (Prolume Ltd) was used in this assay at 250 µM diluted in PBS. Just before recording of the luminescence signal with a CCD camera, 40 µl of CTZ were injected in the last proleg of the larvae. The larvae were then rolled to disperse CTZ and immediately placed into a disposable plastic spectrophotometer cuvette to limit their movement and limit stress and/or toxicity which might be due to low melting agarose immobilization. As control, we injected animals repeatedly with 40 µl of PBS instead of CTZ.
Immediately after injection of soluble and non-soluble CTZ, the larvae were placed in an ImageQuant LAS 4000 mini (GE Healthcare Bio-Sciences) and the luminescence signal was recorded for 10 minutes. Higher time of acquisition did not allow increase in signal intensity. The resulting images were then analyzed using Image J software to quantify the pixel density of the signal area. Area was manually determined on the brightfield picture of the larvae.
For the RLU-CFU correlation experiments, the larvae were homogenized after luminescence signal detection as described above and plated on YEPD-chloramphenicol (50 µg/ml) plates for CFU counting.
For the in vivo kinetic experiments, infected animals were treated with 4 mg/kg of fluconazole 1 h post-infection. Then animals were injected with CTZ at each time-point in a different proleg. Luminescence signals were recorded as described above. For the survival experiment to assess CTZ toxicity, animals were assessed for viability before each injection time-point.
CFU prediction using standard curves of luminescence signals
C. albicans strains grown in liquid medium were centrifuged and washed once with PBS, and once with LA buffer. Cells were resuspended in LA buffer at cell concentrations ranging from 104 to 107 cells/ml. Fifty microliters of each diluted suspension were loaded in triplicate into a microtiter plate and the luminescent signal was measured at the same time as the related ex vivo samples. The mean of the luminescence signals (RLU) detected for each diluted suspension was used to determine standard curves (see File S2).
Disclosure of Potential Conflicts of Interest
No potential conflicts of interest were disclosed.
1081330_supplemental_files.zip
Download Zip (295.7 KB)Acknowledgments
Our thanks to C. D'Enfert for providing the CIp10-PGA59-gLUC plasmid.
Supplemental Material
Supplemental data for this article can be accessed on the publisher's website.
Funding
Alix T Coste was supported by the Swiss Research National Foundation (PMPDP3_139605).
References
- Wisplinghoff H, Bischoff T, Tallent SM, Seifert H, Wenzel RP, Edmond MB. Nosocomial bloodstream infections in US hospitals: analysis of 24,179 cases from a prospective nationwide surveillance study. Clin Infect Dis 2004; 39:309-17; PMID:15306996; http://dx.doi.org/10.1086/421946
- Mean M, Marchetti O, Calandra T. Bench-to-bedside review: Candida infections in the intensive care unit. Crit Care 2008; 12:204; PMID:18279532; http://dx.doi.org/10.1186/cc6212
- Fuchs BB, Mylonakis E. Using non-mammalian hosts to study fungal virulence and host defense. Curr Opin Microbiol 2006; 9:346-51; PMID:16814595; http://dx.doi.org/10.1016/j.mib.2006.06.004
- Fuchs BB, O'Brien E, Khoury JB, Mylonakis E. Methods for using Galleria mellonella as a model host to study fungal pathogenesis. Virulence 2010; 1:475-82; PMID:21178491; http://dx.doi.org/10.4161/viru.1.6.12985
- Brennan M, Thomas DY, Whiteway M, Kavanagh K. Correlation between virulence of Candida albicans mutants in mice and Galleria mellonella larvae. FEMS Immunol Med Microbiol 2002; 34:153-7; PMID:12381467; http://dx.doi.org/10.1111/j.1574-695X.2002.tb00617.x
- Amorim-Vaz S, Delarze E, Ischer F, Sanglard D, Coste AT. Examining the virulence of Candida albicans transcription factor mutants using Galleria mellonella and mouse infection models. Front Microbiol 2015; 6:367; PMID:25999923; http://dx.doi.org/10.3389/fmicb.2015.00367
- Bergin D, Brennan M, Kavanagh K. Fluctuations in haemocyte density and microbial load may be used as indicators of fungal pathogenicity in larvae of Galleria mellonella. Microbes Infect 2003; 5:1389-95; PMID:14670452; http://dx.doi.org/10.1016/j.micinf.2003.09.019
- Li D-D, Deng L, Hu G-H, Zhao L-X, Hu D-D, Jiang Y-Y, Wang Y. Using Galleria mellonella-Candida albicans Infection Model to Evaluate Antifungal Agents. Biol Pharm Bull 2013; 36:1482-7; PMID:23995660; http://dx.doi.org/10.1248/bpb.b13-00270
- Doyle TC, Nawotka KA, Purchio AF, Akin AR, Francis KP, Contag PR. Expression of firefly luciferase in Candida albicans and its use in the selection of stable transformants. Microb Pathog 2006; 40:69-81; PMID:16427765; http://dx.doi.org/10.1016/j.micpath.2005.11.002
- Enjalbert B, Rachini A, Vediyappan G, Pietrella D, Spaccapelo R, Vecchiarelli A, Brown AJP, D'enfert C. A multifunctional, synthetic Gaussia princeps luciferase reporter for live imaging of Candida albicans infections. Infect Immun 2009; 77:4847-58; PMID:19687206; http://dx.doi.org/10.1128/IAI.00223-09
- Brock M. Application of Bioluminescence Imaging for In Vivo Monitoring of Fungal Infections. Int J Microbiol 2012; 2012:1-9; http://dx.doi.org/10.1155/2012/956794
- Jacobsen ID, Luttich A, Kurzai O, Hube B, Brock M. In vivo imaging of disseminated murine Candida albicans infection reveals unexpected host sites of fungal persistence during antifungal therapy. J Antimicrob Chemother 2014; 69(10):2785-96; PMID:24951534
- Gabrielli E, Roselletti E, Luciano E, Sabbatini S, Mosci P, Pericolini E. Comparison between bioluminescence imaging technique and CFU count for the study of oropharyngeal candidiasis in mice. Cytometry A 2015; 87(5):428-36; PMID:25820122
- Cotter G, Doyle S, Kavanagh K. Development of an insect model for the in vivo pathogenicity testing of yeasts. FEMS Immunol Med Microbiol 2000; 27:163-9; PMID:10640612; http://dx.doi.org/10.1111/j.1574-695X.2000.tb01427.x
- Vandeputte P, Ischer F, Sanglard D, Coste AT. In vivo systematic analysis of Candida albicans Zn2-Cys6 transcription factors mutants for mice organ colonization. PLoS One 2011; 6:e26962; PMID:22073120; http://dx.doi.org/10.1371/journal.pone.0026962
- Sanglard D, Ischer F, Marchetti O, Entenza J, Bille J. Calcineurin A of Candida albicans: involvement in antifungal tolerance, cell morphogenesis and virulence. Mol Microbiol 2003; 48:959-76; PMID:12753189; http://dx.doi.org/10.1046/j.1365-2958.2003.03495.x
- Mylonakis EMR, El Khoury JB, Idnurm A, Heitman J, Calderwood SB, Ausubel FM, Diener A. Galleria mellonella as a model system to study Cryptococcus neoformans pathogenesis. Infect Immun 2005; 73:3842-50; PMID:15972469; http://dx.doi.org/10.1128/IAI.73.7.3842-3850.2005
- Kavanagh K, Fallon JP. Galleria mellonella larvae as models for studying fungal virulence. Fungal Biol Rev 2010; 24:79-83; http://dx.doi.org/10.1016/j.fbr.2010.04.001
- Fuchs BB, O'Brien E, Khoury JB, Mylonakis E. Methods for using Galleria mellonella as a model host to study fungal pathogenesis. Virulence 2010; 1:475-82; PMID:21178491; http://dx.doi.org/10.4161/viru.1.6.12985
- Doyle TC, Burns SM, Contag CH. In vivo bioluminescence imaging for integrated studies of infection. Cell Microbiol 2004; 6:303-17; PMID:15009023; http://dx.doi.org/10.1111/j.1462-5822.2004.00378.x
- Leanti La Rosa S, Diep DB, Nes IF, Brede DA. Construction and Application of a luxABCDE Reporter System for Real-Time Monitoring of Enterococcus faecalis Gene Expression and Growth. Appl Environ Microbiol 2012; 78:7003-11; PMID:22843522; http://dx.doi.org/10.1128/AEM.02018-12
- Wurdinger T, Badr C, Pike L, de Kleine R, Weissleder R, Breakefield XO, Tannous BA. A secreted luciferase for ex vivo monitoring of in vivo processes. Nat Methods 2008; 5:171-3; PMID:18204457; http://dx.doi.org/10.1038/nmeth.1177
- Sanglard D, Ischer F, Monod M, Bille J. Susceptibilities of Candida albicans multidrug transporter mutants to various antifungal agents and other metabolic inhibitors. Antimicrob Agent Chemother 1996; 40:2300-5
- Blackwell C, Russell CL, Argimon S, Brown AJP, Brown JD. Protein A-tagging for purification of native macromolecular complexes from Candida albicans. Yeast 2003; 20:1235-41; PMID:14618561; http://dx.doi.org/10.1002/yea.1036
- Fonzi W, Irwin M. Isogenic strain construction and gene mapping in Candida albicans. Genetics 1993; 134:717-28; PMID:8349105
- Gillum AM, Tsay EY, Kirsch DR. Isolation of the Candida albicans gene for orotidine-5′-phosphate decarboxylase by complementation of S. cerevisiae ura3 and E. coli pyrF mutations. Mol Gen Genet 1984; 198:179-82; PMID:6394964; http://dx.doi.org/10.1007/BF00328721