
Abstract
Brucella is a Gram-negative bacterium responsible for brucellosis, a worldwide re-emerging zoonosis. Brucella has been shown to infect and replicate within Granulocyte macrophage colony-stimulating factor (GMCSF) in vitro grown bone marrow-derived dendritic cells (BMDC). In this cell model, Brucella can efficiently control BMDC maturation. However, it has been shown that Brucella infection in vivo induces spleen dendritic cells (DC) migration and maturation. As DCs form a complex network composed by several subpopulations, differences observed may be due to different interactions between Brucella and DC subsets. Here, we compare Brucella interaction with several in vitro BMDC models. The present study shows that Brucella is capable of replicating in all the BMDC models tested with a high infection rate at early time points in GMCSF-IL15 DCs and Flt3l DCs. GMCSF-IL15 DCs and Flt3l DCs are more activated than the other studied DC models and consequently intracellular bacteria are not efficiently targeted to the ER replicative niche. Interestingly, GMCSF-DC and GMCSF-Flt3l DC response to infection is comparable. However, the key difference between these 2 models concerns IL10 secretion by GMCSF DCs observed at 48 h post-infection. IL10 secretion can explain the weak secretion of IL12p70 and TNFα in the GMCSF-DC model and the low level of maturation observed when compared to GMCSF-IL15 DCs and Flt3l DCs. These models provide good tools to understand how Brucella induce DC maturation in vivo and may lead to new therapeutic design using DCs as cellular vaccines capable of enhancing immune response against pathogens.
Abbreviations
| BCV | = | Brucella containing-vacuole |
| BMDCs | = | Bone marrow-derived dendritic cells |
| Btp | = | Brucella TIR-containing protein |
| CCL2 | = | C-C chemokine ligand 2 |
| CCR | = | C-C chemokine receptor |
| CFUs | = | Colony forming units |
| DC | = | dendritic cell |
| ER | = | Endoplasmic reticulum |
| Flt3l | = | Fms-like tyrosine kinase 3 ligand |
| FL-DC | = | Flt3l BMDCs |
| G-DC | = | GMCSF BMDCs |
| G/15-DC | = | GMCSF + IL15 BMDCs |
| G/FL-DC | = | GMCSF + Flt3l BMDCs |
| GMCSF | = | Granulocyte macrophage colony-stimulating factor |
| IFN | = | Interferon |
| IL | = | Interleukin |
| iNOS | = | inducible isoform of Nitric oxide synthase |
| LPS | = | Lipopolysaccharide |
| MCP-1 | = | Monocyte chemotactic protein 1 |
| MHC | = | Major histocompatibility complex |
| MOI | = | Multiplicity of infection |
| NOS2 | = | Nitric oxide synthase 2 |
| pDC | = | plasmacytoid DC |
| RT | = | Room temperature |
| TipDC | = | TNFα and iNOS-producing DCs |
| TLR | = | Toll-like receptor |
| TNFα | = | Tumor Necrosis Factor α |
| TSA | = | Tryptic Soy Agar |
| TSB | = | Tryptic Soy Broth. |
Introduction
Brucella is a Gram-negative facultative intracellular bacterium responsible for brucellosis, a worldwide re-emerging zoonosis.Citation1 Brucella is able to infect a large number of mammals including land and aquatic animals. In animals, brucellosis leads to abortion and sterility responsible for serious economic losses.
Brucella can be transmitted to humans by ingestion of contaminated food products or through exposure to infected aerosolized particles. Brucellosis in humans consists in a wide variety of symptoms, from recurrent fever and influenza-like symptoms in the acute phase, to arthritis in most common cases of chronic infection. Chronic brucellosis may affect different organs and induce more serious forms of the disease like hepatitis or endocarditis.Citation2
Upon infection, Brucella translocates through mucosal barrier and is internalized by professional phagocytes. It has been demonstrated that Brucella acts as a stealthy pathogen and modulates host immune responses.Citation3 Brucella is able to survive and persist inside infected cells by modification of its intracellular trafficking. Bacteria avoid fusion with lysosomal compartments and reside in a Brucella-containing vacuole (BCV) harboring endoplasmic reticulum (ER) markers as a safe replicative niche.Citation4-10 Brucella lipopolysaccharide (LPS) is implicated in the control of host immunity against Brucella infection. It is known as a poor Toll-like receptor 4 (TLR4) agonist reducing toxicity and immune responses.Citation11-13 Most of these studies have been carried out on macrophages but in 2005 Billard et al. showed for the first time that Brucella can invade and proliferate in human DCs. DCs constitute the most potent professional antigen-presenting cell linking innate and adaptive immunity.Citation14-16
Since then, different studies have showed that Brucella efficiently proliferates within human, murine and bovine DCs.Citation17-23 Interestingly, Brucella infected human DCs do not engage into a maturation process and are poor inducers of naïve T cells.Citation18 Brucella also interferes with murine DC maturation in particular via BtpA and BtpB, 2 TIR-containing proteins that inhibit TLR signaling.Citation20,24-27 Weak DC maturation can also be related to Brucella non endotoxic LPS,Citation28,29 IL10 productionCitation30 and interference with type 1 Interferon (IFN) pathway.Citation31 Brucella infection in vivo induces the recruitment of inducible isoform of Nitric oxide synthase (iNOS)-positive cells expressing CD11b, Ly6C and major histocompatibility complex (MHC) II,Citation32 comparable to Tumor Necrosis Factor α (TNFα) and iNOS-producing DCs (TipDC) identified following Listeria monocytogenes infection.Citation33 Interestingly, Copin et al. demonstrated by in situ microscopy analysis that Brucella infection in vivo induces splenic DC maturation and migration to the white pulp T cell area.Citation34 All these studies highlight the implication of DCs in Brucella pathogenesis.
Most of the in vitro studies performed to date have made use of GMCSF to differentiate bone marrow-derived monocytes into DCs (BMDCs).Citation35 We know now that murine DCs form a complex network of cells composed of different subtypes with phenotypic and functional differences.Citation14,36 Moreover, bacteria can interact differently with each DC subset and as a result the immune response can be subset-specific (Papadopoulos A and Gorvel JP, submitted). Interestingly, deep characterization of human DCs showed that they resemble mouse DCs populations and equivalents can be found for each subset that have been studied.Citation36
In order to decipher the mechanisms of Brucella-DC interaction we compared Brucella infection in different murine BMDCs models. To this aim, we used GMCSF BMDCs (G-DC). Then, we studied 3 other models: 1) Flt3l BMDCs (FL-DC) that gives rise to 3 DC subsets including plasmacytoid DC (pDC) and equivalents of splenic CD8α and splenic CD11b+.Citation37,38 2) GMCSF + Flt3l BMDCs (G/FL-DC). We chose this model because it has been demonstrated that Flt3l is continuously produced Citation39 and GMCSF is highly produced upon pathogenic challenge and can alter the developmental outcome of murine DCs.Citation40,41 G/FL-DC may correspond to DCs found upon in vivo infection. 3) GMCSF + IL15 BMDCs (G/15-DC). We selected this model because IL15 is produced by a wide range of tissues in response to inflammatory stimuli and some studies showed that IL15 can convert monocytes into DCs.Citation42-46
Materials and Methods
Bacterial strain
In this study, B. abortus smooth virulent strain 2308 was grown on Tryptic Soy Agar (TSA) plates (Sigma Aldrich) for 7 d. For infection, 2mL of Tryptic Soy Broth (TSB) (Sigma Aldrich) were inoculated with one colony. Bacteria were grown overnight at 37°C under shaking until the OD (600nm) reached 1.8. All experiments with Brucella were carried out in a BSL3 facility.
Mice
6- to 10-week-old wild type C57BL/6 female mice were obtained from Charles River Laboratories. All experiments were done in accordance with French and European guidelines for animal care.
In vitro generation of BMDCs
BMDCs were prepared from 6–10 week-old C57BL/6 female femurs and tibias as previously described.Citation20 Briefly, bone ends were cut off and marrow was flushed with RPMI medium (GIBCO) containing 5% FCS and 50 µM of 2-mercaptoethanol (Sigma). 3 × 10⁶ cells were seeded onto 6-well plates in a medium containing either supernatant of the J558L GMCSF producing cell line (G-DC), both GMCSF and IL15 at 20 ng/mL (Miltenyi) (G/IL15-DC) or both GMCSF and supernatant of the Flt3l-producing B16 melanoma cell line (G/FL-DC). 1.5 × 10⁶ cells were seeded in 6-well plates in a medium containing the supernatant of the Flt3l-producing B16 melanoma cell line only (FL-DC).
G-DC medium was changed at day 2.5. G/IL15-DC medium was changed at days 2 and 4. G/FL-DC and FL-DC medium was changed at day 4.
Infection of BMDCs
BMDCs infections were performed at a multiplicity of infection (MOI) of 30. Bacteria were centrifuged onto cells at 400 g for 10 min at 4°C and then incubated for 30 min at 37°C in a 5% CO2 incubator. Cells were washed twice with medium and then incubated for 1 h in medium containing 50 µg/ml gentamicin (Sigma Aldrich) at 37°C to kill extracellular bacteria. Thereafter, the antibiotic concentration was decreased to 10 µg/ml.
Intracellular replication assays
To monitor bacterial intracellular survival, infected cells were washed 3 times with PBS and lysed with 0.1% Triton X-100 in H2O for 10 min and serial dilutions were plated in triplicate onto TSB agar and Colony forming units (CFUs) were scored after 3–4 d of culturing at 37°C.
Electron microscopy
Cells were fixed for 1h at room temperature with 2.5% glutaraldehyde in 0.1M Na-cacodylate buffer, pH 7.2 containing 0.1M sucrose, 5 mM CaCl2 and 5 mM MgCl2 and washed with complete cacodylate buffer, and post-fixed for 1 h at room temperature with 1% osmium tetroxide in the same buffer devoid of sucrose. They were washed with buffer, scraped off the dishes, concentrated in 2% agar in cacodylate buffer and treated for 1 h at room temperature with 1% uranyl acetate in Veronal buffer. Samples were dehydrated in a graded series of ethanol and embedded in Spurr resin. Thin sections (70 nm thick) were stained with 1% uranyl acetate in distilled water and then with lead citrate.
Flow cytometry
Cells were harvested and stained for 20 min at 4°C with antibodies mix. After a wash in PBS with 2% of FCS, cells were stained with Fixable Viability Dye eFluor 506 (eBiosciences) for 10 min at room temperature to evaluate cell viability. Cells were then fixed for 20 min in 3.2 % PFA at RT. Antibodies used in flow cytometry are the following, CD11c-PeCy5.5 (1/1500), B220 BV605 (1/200) and MHC II (I-A/I-E) Al700 (1/800) from eBioscience, CD11b APC-Cy7 (1/800), CD86 BV650 (1/200), CD80-BV421 (1/800) and CD40-PeCy5 (1/400) from BioLegend, SIRPα Pe (1/200), CD24 Pe-Texas red (1/2000) and Annexin V APC (1/500) (BD).
G-DC, G/IL15-DC and G/FL-DC were gated based on the expression of CD11c and CD11b. Flt3l were separated in 3 subtypes: pDC expressing CD11c (intermediate) and B220 and negative for CD11b; CD11b+ DC equivalent expressing CD11c, SIRPα and CD11b and negative for CD24 and B220; CD8α+ equivalent expressing CD11c, CD24 and negative for CD11b, SIRPα and B220.
Flow cytometry was performed using a FACSLSRII (Becton Dickinson) and data were analyzed with BD FACSDIVA software.
RNA extraction and RT
Total RNAs were extracted from infected BMDCs using RNeasy Mini Kit (Qiagen) and following manufacturer’s instructions. cDNAs were generated by using Quantitech Reverse Transcription Kit (Qiagen) following manufacturer’s instructions.
qPCR
qPCR was performed with SYBR Green (Takara) following the manufacturer’s instructions in 7500 Fast Real-time PCR (Applied Biosystem). HPRT was used as a housekeeping gene to determine ΔCt. Fold increase was compared between the control and the infected cells. Primers used in this study to amplify mouse cDNA are presented in the .
Table 1. qPCR primers
Cytokine measurement
Culture supernatants were analyzed by cytometric beads assay (CBA from BD, Mouse Inflammation kit) and ELISA from eBiosciences for IL1β, IL-12p40 and IL12p70.
Statistics
All experiments were performed at least 5 independent times. Flow cytometry statistical analysis was performed using a ratio paired T test (paired and parametric) to compare mean of fluorescence of more than 100 000 cells in non-infected vs infected conditions. Cytokine secretion statistical analysis was performed using a Wilcoxon test (paired and non-parametric) to compare non-infected vs infected conditions and a Mann-Whitney test (unpaired and non-parametric) to compare results between infected BMDCs models. P values over 0.05 were not considered as significant.
Results
Replication of Brucella in different BMDC models
We first tested the infection and proliferation efficiency of B. abortus in 4 different BMDC models. Cells were infected at an MOI of 30 and the intracellular bacteria were recovered at 2, 8, 24 and 48 h post-infection (). Results showed that B. abortus can infect all the BMDC sub-types. CFU counts decreased for the first 8 h post-infection. This was followed by a proliferation phase until a plateau value was reached. Interestingly, at 2 h post-infection differences between DC sub-types was observed. Both G/15-DCs and FL-DCs were respectively 3 and 10 times more infected than G-DCs and G/FL-DCs. At late time points, these differences were lost and Brucella CFU scores were similar between the different DC models. We also determined the fold increase in the amount of bacteria with respect to the amount found at 2h post-infection (). Results showed that Brucella replication is significantly more important in G-DCs and G/FL-DCs than in G/15-DCs and FL-DCs.
Figure 1. Brucella CFU counts and replication in different BMDCs models BMDCs from C57BL/6 mice were infected at a MOI of 30. Extracellular bacteria were killed by antibiotic treatment and cells were recovered, lysed and plated to obtain intracellular bacterial counts per well at different time point. Each point represent at least 3 experiments Statistical analysis were performed using an unpaired T test to compare CFU counts. GMCSF BMDCs are used as a reference to compare other BMDCs model. P values > 0.05 were not consider significant, p values < 0.05 are represent with *, p values < 0.01 are represent with **, p values < 0.001 are represent with *** and p values < 0.0001 are represent with ****. (A) Results are expressed by number of CFU obtain at different time point. (B) Results are standardized to compare Brucella replication using CFU count 2 hours post-infection as a reference.
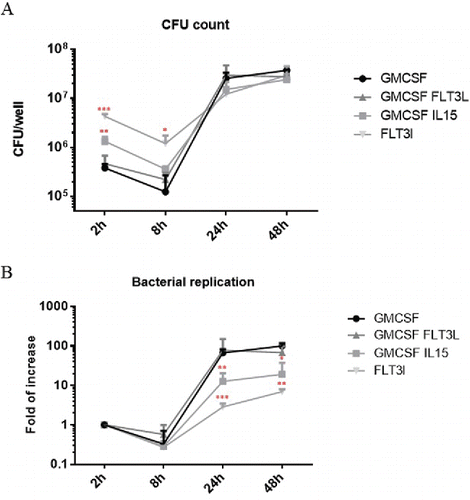
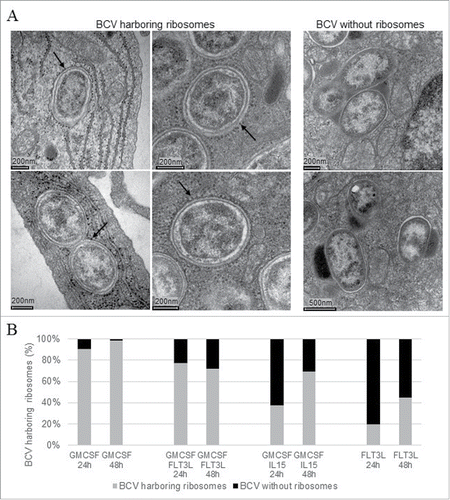
Figure 2. Intracellular localization in BMDCs analyzed by electronic microscopy BMDCs from C57BL/6 mice were infected at a MOI of 30. 24h and 48h post-infection, cells were fixed and processed for Electron Microscopy analysis. The BCV morphological appearance was analyzed on electron microscopy thin sections either BCVs harboring ribosomes (A/arrows left panel). Some BCVs containing either one or several bacteria were free of ribosomes (A/right panel). The relative abundance of ER-derived BCV was evaluated on EM cell profiles at 24 and 48h post-infection (B). Combining three different experiment around 100 BCV were quantified for each time-point and results are expressed by a percentage.
Fate of B. abortus in the different BMDC models
It has been shown in macrophages and G-DC that B. abortus escapes lysosomal compartments and fuses with ER membranes to establish a safe replicative niche.Citation4-10
To characterize the compartment in which B. abortus was contained in the different BMDC models, infected cells were fixed and processed for electron microscopy at selected time point post-infection. The morphological app-earance was analyzed on electron microscopy thin sections and BCV profiles were then examined for the presence or absence of ribosomes (arrows ). BCVs harboring ribosomes indicated that they were ER-derived (left panel ). Some BCVs containing either one or several bacteria were free of ribosomes (right panel ). They seem to contain lysosomal material. The relative abundance of ER-derived BCV was evaluated on EM cell profiles at 24 and 48h post-infection (). As previously described in G-BMDCs Citation20 more than 90% of B. abortus were located in vacuoles surrounded by ribosomes. We obtained different results for all the other DC sub-types tested. Upon G/FL-DC infection, bacteria were mainly present in an ER-derived vacuoles but 20% of BCVs either contained lysosomal material or had not yet fused with ER membranes. Upon G/IL15-DC infection only 38% of BCV harbored ribosomes at 24 h post-infection and this percentage increased up to 70% at 48 h post-infection. For FL-DC, bacteria were frequently found in phagolysosomes-like vacuoles and only 20% of the BCV were surrounded by ribosomes. This percentage reached 45% at 48 h post infection. These results show that although the intracellular location of B. abortus varied according to the BMDC model, the intracellular survival was not affected.
Acquisition of surface maturation markers
To assess the phenotypic maturation of the different BMDCs models, we measured the expression of DC surface maturation markers by flow cytometry. We compared the mean of fluorescence intensity ratio between non-infected and infected cells ().
Figure 3. Surface marker expression BMDCs from C57BL/6 mice were infected at a MOI of 30. 4h, 24h and 48h post-infection, cells were fixed and stained with antibodies for MHCII, CD86, CD80 and CD40. Results are presented in box plot and each point represent at least 5 experiments. Statistical analysis were performed using a ratio paired T test (paired and parametric) to compare mean of fluorescence of more than 100 000 cells in non-infected vs infected conditions. Statistical significance represent difference between infected and non-infected conditions. P values > 0.05 were not consider significant, p values < 0.05 are represent with *, p values < 0.01 are represent with **, p values < 0.001 are represent with *** and p values < 0.0001 are represent with ****.
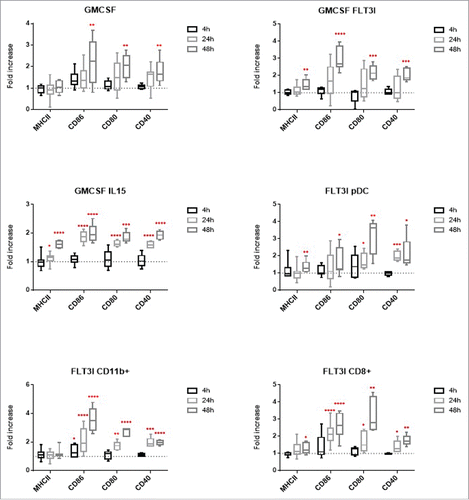
Upon B. abortus infection, G-DC maturation markers were not significantly up-regulated at 24 h post-infection as it had previously been shown.Citation20 At 48 h post-infection, costimulatory molecules were significantly upregulated but not MHCII molecules. G/FL-DC response to B. abortus infection was comparable to G-DC infection with a late maturation. Interestingly, G/IL15-DC infection induced a significant maturation from 24 h post-infection onwards. The FL-DC sub-type includes 3 different subsets: pDC, CD8α+ and CD11b+ equivalents. By using a combination of different markers we were able to separate them by flow cytometry and analyze the maturation level of each population. Flt3l pDC maturation marker upregulation was observed at 48 h post-infection and from 24 h onwards for CD40. Flt3l CD11b+ and CD8α+ BMDCs were activated for all of the co-stimulatory molecules from 24 h onwards. There was no effect on MHCII expression in CD11b+ BMDCs and a weak up-regulation in CD8α+ BMDCs.
Altogether, flow cytometry results showed that G-DC, G/FL-DC and FL-pDC were activated upon B. abortus infection only at 48 h post-infection. However, G/IL15-DC, Flt3l CD11b+ and CD8α+ BMDCs were activated from 24 h onwards. We show here that B. abortus can induce in vitro DC activation with different kinetics depending on the BMDC model. These results can be related with Brucella intracellular localization. The less bacteria are in the ER compartment, the more BMDCs are activated.
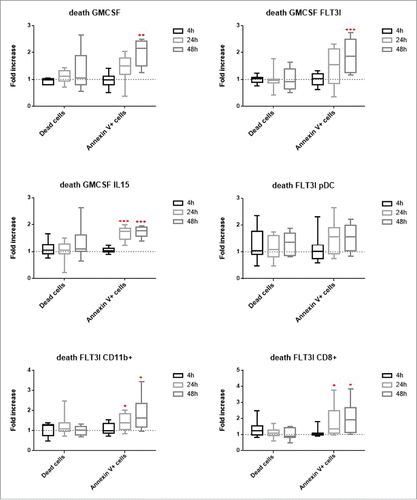
BMDCs death
To compare the effect of B. abortus infection on different BMDCs subsets we also decided to check the effect on cell death. To this aim, we used a combination of a dead cell staining and Annexin V labeling (). Annexin V stained phosphatidylserine in the outer leaflet, sign of the early stage of programmed cell death. Results show that none of the BMDC models were stained for the dead cell marker. However, all DCs except Flt3l pDC BMDCs were positive for Annexin V at 48 h post-infection. In addition, CD11b+ and CD8+ Flt3l BMDCs and G/IL15-DCs were stained by Annexin V at 24 h post-infection. These results indicate that an early activation of DC induce an early Annexin V staining.
Figure 4. Cell death BMDCs from C57BL/6 mice were infected at a MOI of 30. 4h, 24h and 48h post-infection, cells were fixed and stained with Annexin V and with Fixable Viability Dye eFluor 506 to assess cell death. Results are presented in box plot and each point represent at least 5 experiments. Statistical analysis were performed using a ratio paired T test (paired and parametric) to compare mean of fluorescence of more than 100 000 cells in non-infected vs infected conditions. Statistical significance represent difference between infected and non-infected conditions. P values > 0.05 were not consider significant, p values < 0.05 are represent with *, p values < 0.01 are represent with **, p values < 0.001 are represent with *** and p values < 0.0001 are represent with ****.
We then checked for BMDCs proliferation by measuring BrdU incorporation and no significant differences were obtained upon B. abortus infection (data not shown).
Gene expression profile
To highlight some specific patterns, we analyzed BMDC gene expression profiles by comparing the fold increase in infected cells as compared to non-infected cells. Statistical analysis was performed by using the Comparative CT Method (ΔΔ CT Method) given by: 2–ΔΔCT. The dotted line represent a fold increase of 2, the statistical significant threshold in this method ().
Figure 5. IL12, TNFα, IFNγ, IL6, IFNα, IFNβ, IL10 IL1β and NOS2 gene expression profile BMDCs from C57BL/6 mice were infected at a MOI of 30. 2h, 4h, 24h and 48h post-infection, cells were recovered and RNA were extracted. QPCR were performed to measure fold increase between non infected and infected conditions. Statistical analysis was performed by using the Comparative CT Method (ΔΔ CT Method) given by. 2–ΔΔCT. The dotted line represent a fold increase of 2, the statistical significant threshold in this method.
At 2 h post-infection, IFNα, IL1β, nitric oxide synthase 2 (NOS2) and IL10 started to be up-regulated in all BMDCs subsets. At 8, 24 and 48 h post-infection all genes tested were upregulated. IL12 and IL1β gene expression followed the same kinetics in all of the BMDCs, with an increase from 8 h to 24 h and a decrease at 48 h post-infection. However, we identified some important differences between DC subsets. G-DC infection induced a strong and specific IL10 upregulation at 48 h post-infection. This strong IL10 up-regulation may explain that G-DC are less activated than all the other BMDCs. Analysis of the expression of maturation markers and CFUs counts showed that G-DC and G/FL-DC respond in the same way to B. abortus infection. Gene expression of these 2 subsets showed similar kinetics except for IL10. It is noteworthy that gene upregulation was lower in G-DCs than in the other BMDC models for almost all of the gene tested. We previously showed that G/IL15-DC infection induced an early upregulation of surface maturation markers. Gene expression profile showed many differences with G-DC. Kinetics of expression was different for IFNγ, IFNβ, TNFα and IL6. IFNγ gene was overexpressed earlier as compared to all the model tested and was strongly down regulated at 48 h post-infection. IFNβ, TNFα and IL6 were expressed later than in other subsets with a peak at 24 h of infection for IFNβ and after 48 h of infection for TNFα and IL6. FL-DC gene overexpression was the highest observed for TNFα, IFNγ, IL6, IFNα, IFNβ, IL1β and NOS2. Again, these results are in line with all the previous results showing an early important FL-DC maturation.
We checked the expression of the chemokine C-C chemokine ligand 2 (CCL2) and its receptor C-C chemokine receptor (CCR) 2 () as they correlate with DC maturation.Citation47,48 A fold-increase of 2 represented by the dotted line shows the statistical significant threshold.
Figure 6. CCL2, CCR2 and CCR7 gene expression profile BMDCs from C57BL/6 mice were infected at a MOI of 30. 2h, 4h, 24h and 48h post-infection, cells were recovered and RNA were extracted. QPCR were performed to measure fold increase between non infected and infected conditions. Statistical analysis was performed by using the Comparative CT Method (ΔΔ CT Method) given by: 2–ΔΔCT. The dotted line represent a fold increase of 2 or 0.5, the statistical significant threshold in this method for respectively an up-regulation or a downregulation.
CCL2 also called monocyte chemotactic protein 1 (MCP-1) is essential for monocyte recruitment from bone marrow to inflammatory sites. Upon B. abortus infection in all the BMDCs, we found an increased expression of CCL2. However, we noticed different levels of up-regulation between these subsets. G-DC exhibited the lowest increase. In contrast infection of FL-DC was responsible for a 300-fold increase of the CCL2 expression as compared to the case of non-infected control cells. CCR2 expression is known to be down-regulated upon DC activation. Here, results showed that CCR2 expression significantly decreased at 48 h post-infection. In G/15-DC, CCR2 expression started to decrease at 24 h post-infection. Interestingly, G-DC presents the lowest down-regulation of CCR2.
Then we checked the expression of CCR7 (). This chemokine receptor has been identified as a key regulator of immune cells trafficking to lymph node, expressed upon DC maturation.Citation47,49-51 Results showed a slight upregulation at 24 h post-infection in G-DC, G/FL-DC and G/15-DC. Interestingly, B. abortus infection induced a strong upregulation of CCR7 starting from 8 h post-infection in FL-DC.
Cytokine secretion
To assess the functional maturation of BMDCs, we also measured cytokine secretion by recovering BMDCs culture supernatants at 24 h and 48 h post-infection. We tested IL6, IL10, IL1β IL12p40 and 70, IFNγ, TNFα and CCL2 ().
Figure 7. Cytokine secretion in BMDCs supernatants BMDCs from C57BL/6 mice were infected at a MOI of 30. 24h and 48h post-infection, cells supernatant were recovered and cytokine concentration was determined by CBA and ELISA analysis. Statistical analysis was performed using a Wilcoxon test (paired and non-parametric) to compare non-infected vs infected conditions and a Mann-Whitney test (unpaired and non-parametric) to compare results between infected BMDCs models. P values over 0.05 were not considered as significant. Statistical significance between non infected and infected conditions are presented in red and between models in black. P values > 0.05 were not consider significant, p values < 0.05 are represent with *, p values < 0.01 are represent with **, p values < 0.001 are represent with *** and p values < 0.0001 are represent with ****.
At 24 h and 48 h post-infection, TNFα, IL6, IL12p40, IL1β and CCL2 were significantly secreted by all BMDCs models.
At 24 h post-infection, only G/IL15-DC and FL-DC secreted IL12p70 and IFNγ. IL10 was not significantly secreted by any BMDCs. We can notice that G/IL15-DC secreted higher amounts of IL12p70, TNFα, IFNγ, IL1β and IL6 than all the other models.
At 48 h post-infection, G-DC secreted low levels of IL12p70 and G/FL-DC produced IL12p70 and IFNγ. G-DC and FL-DC significantly up-regulated IL10 production, as it has been shown analyzing gene expression. Interestingly, G/IL15-DC TNFα, IFNγ and IL6 secretion decreased when compared to 24 h post-infection time point.
Discussion
The present study shows that Brucella is capable of replicating in all the BMDCs models tested with a high infection rate at early time points in G/15-DCs and FL-DCs. In contrast, G-DC and G/FL-DC are more activated than the other studied DC models and consequently this may prevent intracellular bacteria to be efficiently targeted to the ER replicative niche. This is illustrated by the fact that in G/15-DC and FL-DC, the percentage of BCV surrounded by ribosomes is lower than in G-DC and G/FL-DC. These results can be correlated to all previous works on Brucella intracellular survival, which have shown that BCVs need to fuse with ER membranes in order to ensure a safe replication.
One of the major characteristics of DC is the activation of naïve T cells. This process is initiated by DC maturation followed by antigen presentation. The influence of BMDCs infection on T cell proliferation and activation needs to be determined. It has been shown that upon Brucella infection of G-DC, control of DC maturation impedes T cell proliferation.Citation20 The different levels of DC maturation observed in the other models G/15-DCs and FL-DCs may change the outcome of DC function allowing then T cell activation.
We show that G-DC and G/FL-DC response to infection is comparable, with an exception concerning migration capacity. This result is in agreement with previous studies, which compared G-DC and G/FL-DC function and concluded that adding GMCSF to FL-DC inhibits pDC and CD8+ differentiation and induces production of CD11b+ DC almost identical to G-DC.Citation41,52 The key difference between these 2 models concerns IL10 secretion at 48 h post-infection. Interestingly, a study showed that IL10 inhibition in G-DC induces Brucella clearance with an increase in IL12p70 and TNFα secretion.Citation30 IL10 secretion can explain the weak secretion of these 2 cytokines in the G-DC model and the low level of maturation observed when compared to the other models G/15-DCs and FL-DCs.
Here, we show that G/15-DC maturation was followed by a strong pro-inflammatory cytokine gene up-regulation and a strong IFNγ and IL12p70 production. These results can be correlated with literature in which G/15-DCs have been shown as great producers of IL12p70 and IFNγ.Citation53 Moreover, it is known that IFNγ plays an important role in mediating Brucella resistance,Citation54-56 but in G/15-DC model Brucella significantly survives and proliferates. In this context, pro-inflammatory cytokine secretion was not sufficient to impede bacterial replication. In vivo, we can expect an efficient stimulation of macrophages with a important IFNγ production. To investigate this point, it will be interesting to test whether G/15-DC cytokine production can stimulate macrophages and induce a killing effect on Brucella.
Gene expression and cytokine secretion showed apparent discrepancies. This can be explain by at least 2 different aspects. It is known that mRNA and protein half-life can vary from minutes to days and, as a result, experimental quantification may not reflect the effective production. However, discrepancies observed can also be due to a real mechanism induced by Brucella infection. As already discussed in Martirosyan et al.Citation57 a strong cytokine synthesis may trigger the activation of the proteasome machinery leading to intracellular cytokine degradation and consequently the decrease of their secretion.
It has been shown that Brucella induces splenic DC migration and maturation.Citation34 We show that FL-DC infection increases the maturation of CD8+ and CD11b+ DCs and a strong CCR7 upregulation. As FL-DCs can be considered as splenic DC equivalents, we demonstrate here that FL-DC represents a good model to study Brucella interaction with splenic DC.
Altogether, this study may help to open a field of a wide range of studies on interactions between Brucella and DC subtypes.
Disclosure of Potential Conflicts of Interest
No potential conflicts of interest were disclosed.
Acknowledgments
The EM observations and analyses were performed by AP and CdC in the PiCSL EM core facility (Institut de Biologie du Développement/Aix Marseille Université, Marseille), a member of the France BioImaging French research infrastructure. We thank the members of this EM facility for expert technical assistance and Lionel Spinelli for advices in statistics.
Additional information
Funding
References
- Seleem MN, Boyle SM, Sriranganathan N. Brucellosis: a re-emerging zoonosis. Vet Microbiol 2010; 140:392-8; PMID:19604656; http://dx.doi.org/10.1016/j.vetmic.2009.06.021
- Skendros P, Pappas G, Boura P. Cell-mediated immunity in human brucellosis. Microbes Infect 2011; 13:134-42; PMID:21034846; http://dx.doi.org/10.1016/j.micinf.2010.10.015
- Barquero-Calvo E, Chaves-Olarte E, Weiss DS, Guzmán-Verri C, Chacón-Díaz C, Rucavado A, Moriyón I, Moreno E. Brucella abortus uses a stealthy strategy to avoid activation of the innate immune system during the onset of infection. PLoS One 2007; 2:e631; PMID:17637846; http://dx.doi.org/10.1371/journal.pone.0000631
- Pizarro-Cerda J, Méresse S, Parton RG, van der Goot G, Sola-Landa A, Lopez-Goñi I, Moreno E, et al. Brucella abortus transits through the autophagic pathway and replicates in the endoplasmic reticulum of nonprofessional phagocytes. Infect Immun 1998; 66:5711-24; PMID:9826346
- Pizarro-Cerda J, Moreno E, Sanguedolce V, Mege JL, Gorvel JP. Virulent Brucella abortus prevents lysosome fusion and is distributed within autophagosome-like compartments. Infect Immun 1998; 66:2387-92; PMID:9573138
- Comerci DJ, Martinez-Lorenzo MJ, Sieira R, Gorvel JP, Ugalde RA. Essential role of the VirB machinery in the maturation of the Brucella abortus-containing vacuole. Cell Microbiol 2001; 3:159-68; PMID:11260139; http://dx.doi.org/10.1046/j.1462-5822.2001.00102.x
- Delrue RM, Martinez-Lorenzo M, Lestrate P, Danese I, Bielarz V, Mertens P, De Bolle X, Tibor A, Gorvel JP, Letesson JJ. Identification of Brucella spp. genes involved in intracellular trafficking. Cell Microbiol 2001; 3:487-97; PMID:11437834; http://dx.doi.org/10.1046/j.1462-5822.2001.00131.x
- Celli J, de Chastellier C, Franchini DM, Pizarro-Cerda J, Moreno E, Gorvel JP. Brucella evades macrophage killing via VirB-dependent sustained interactions with the endoplasmic reticulum. J Exp Med 2003; 198:545-56; PMID: 12925673; http://dx.doi.org/10.1084/jem.20030088
- Starr T, Ng TW, Wehrly TD, Knodler LA, Celli J. Brucella intracellular replication requires trafficking through the late endosomal/lysosomal compartment. Traffic 2008; 9:678-94; PMID:18266913; http://dx.doi.org/10.1111/j.1600-0854.2008.00718.x
- Arellano-Reynoso B, Lapaque N, Salcedo S, Briones G, Ciocchini AE, Ugalde R, Moreno E, Moriyón I, Gorvel JP. Cyclic beta-1,2-glucan is a Brucella virulence factor required for intracellular survival. Nat Immunol 2005; 6:618-25; PMID:15880113; http://dx.doi.org/10.1038/ni1202
- Forestier C, Deleuil F, Lapaque N, Moreno E, Gorvel JP. Brucella abortus lipopolysaccharide in murine peritoneal macrophages acts as a down-regulator of T cell activation. J Immunol 2000; 165:5202-10; PMID:11046053; http://dx.doi.org/10.4049/jimmunol.165.9.5202
- Lapaque N, Moriyon I, Moreno E, Gorvel JP. Brucella lipopolysaccharide acts as a virulence factor. Curr Opin Microbiol 2005; 8:60-6; PMID:15694858; http://dx.doi.org/10.1016/j.mib.2004.12.003
- Lapaque N, Takeuchi O, Corrales F, Akira S, Moriyon I, Howard JC, Gorvel JP. Differential inductions of TNF-alpha and IGTP, IIGP by structurally diverse classic and non-classic lipopolysaccharides. Cell Microbiol 2006; 8:401-13; PMID:16469053; http://dx.doi.org/10.1111/j.1462-5822.2005.00629.x
- Merad M, Sathe P, Helft J, Miller J, Mortha A. The dendritic cell lineage: ontogeny and function of dendritic cells and their subsets in the steady state and the inflamed setting. Annu Rev Immunol 2013; 31:563-604; PMID:23516985; http://dx.doi.org/10.1146/annurev-immunol-020711-074950
- Schlitzer A, McGovern N, Ginhoux F. Dendritic cells and monocyte-derived cells: two complementary and integrated functional systems. Semin Cell 2015; Dev Biol; PMID:25957517
- Reizis B, Bunin A, Ghosh HS, Lewis KL, Sisirak V. Plasmacytoid dendritic cells: recent progress and open questions. Annu Rev Immunol 2011; 29:163-83; PMID:21219184; http://dx.doi.org/10.1146/annurev-immunol-031210-101345
- Billard E, Cazevieille C, Dornand J, Gross A. High susceptibility of human dendritic cells to invasion by the intracellular pathogens Brucella suis, B. abortus, and B. melitensis. Infect Immun 2005; 73:8418-24; PMID:16299342; http://dx.doi.org/10.1128/IAI.73.12.8418-8424.2005
- Billard E, Dornand J, Gross A. Brucella suis prevents human dendritic cell maturation and antigen presentation through regulation of tumor necrosis factor alpha secretion. Infect Immun 2007; 75:4980-9; PMID:17635859; http://dx.doi.org/10.1128/IAI.00637-07
- Billard E, Dornand J, Gross A. Interaction of Brucella suis and Brucella abortus rough strains with human dendritic cells. Infect Immun 2007; 75:5916-23; PMID:17938225; http://dx.doi.org/10.1128/IAI.00931-07
- Salcedo SP, Marchesini MI, Lelouard H, Fugier E, Jolly G, Balor S, Muller A, Lapaque N, Demaria O, Alexopoulou L, et al. Brucella control of dendritic cell maturation is dependent on the TIR-containing protein Btp1. PLoS Pathog 2008; 4:e21; PMID:18266466; http://dx.doi.org/10.1371/journal.ppat.0040021
- Billard E, Dornand J, Gross A. VirB type IV secretory system does not contribute to Brucella suis' avoidance of human dendritic cell maturation. FEMS Immunol Med Microbiol 2008; 53:404-12; PMID:18625010; http://dx.doi.org/10.1111/j.1574-695X.2008.00441.x
- Heller MC, Watson JL, Blanchard MT, Jackson KA, Stott JL, Tsolis RM. Characterization of Brucella abortus infection of bovine monocyte-derived dendritic cells. Vet Immunol Immunopathol 2012; 149:255-61; PMID:22884262; http://dx.doi.org/10.1016/j.vetimm.2012.07.006
- Archambaud C, Salcedo SP, Lelouard H, Devilard E, de Bovis B, Van Rooijen N, Gorvel JP, Malissen B. Contrasting roles of macrophages and dendritic cells in controlling initial pulmonary Brucella infection. Eur J Immunol 2010; 40:3458-71; PMID:21108467; http://dx.doi.org/10.1002/eji.201040497
- Salcedo SP, Marchesini MI, Degos C, Terwagne M, Von Bargen K, Lepidi H, Herrmann CK, Santos Lacerda TL, Imbert PR, Pierre P, et al. BtpB, a novel Brucella TIR-containing effector protein with immune modulatory functions. Front Cell Infect Microbiol 2013; 3:28; PMID:23847770; http://dx.doi.org/10.3389/fcimb.2013.00028
- Surendran N, Hiltbold EM, Heid B, Sriranganathan N, Boyle SM, Zimmerman KL, Witonsky SG. Heat-killed and gamma-irradiated Brucella strain RB51 stimulates enhanced dendritic cell activation, but not function compared with the virulent smooth strain 2308. FEMS Immunol Med Microbiol 2010; 60:147-55; PMID:20812951; http://dx.doi.org/10.1111/j.1574-695X.2010.00729.x
- Surendran N, Hiltbold EM, Heid B, Sriranganathan N, Boyle SM, Zimmerman KL, Makris MR, Witonsky SG. Live Brucella abortus rough vaccine strain RB51 stimulates enhanced innate immune response in vitro compared to rough vaccine strain RB51SOD and virulent smooth strain 2308 in murine bone marrow-derived dendritic cells. Vet Microbiol 2011; 147:75-82; PMID:20594772; http://dx.doi.org/10.1016/j.vetmic.2010.06.001
- Surendran N, Hiltbold EM, Heid B, Akira S, Standiford TJ, Sriranganathan N, Boyle SM, Zimmerman KL, Makris MR, Witonsky SG. Role of TLRs in Brucella mediated murine DC activation in vitro and clearance of pulmonary infection in vivo. Vaccine 2012; 30:1502-12; PMID:22234268; http://dx.doi.org/10.1016/j.vaccine.2011.12.036
- Conde-Alvarez R, Arce-Gorvel V, Iriarte M, Manček-Keber M, Barquero-Calvo E, Palacios-Chaves L, Chacón-Díaz C, Chaves-Olarte E, Martirosyan A, von Bargen K, et al. The lipopolysaccharide core of Brucella abortus acts as a shield against innate immunity recognition. PLoS Pathog 2012; 8:e1002675; PMID:22589715; http://dx.doi.org/10.1371/journal.ppat.1002675
- Gil-Ramirez Y, Conde-Álvarez R, Palacios-Chaves L, Zúñiga-Ripa A, Grilló MJ, Arce-Gorvel V, Hanniffy S, Moriyón I, Iriarte M. The identification of wadB, a new glycosyltransferase gene, confirms the branched structure and the role in virulence of the lipopolysaccharide core of Brucella abortus. Microb Pathog 2014; 73:53-9; PMID:24927935; http://dx.doi.org/10.1016/j.micpath.2014.06.002
- Corsetti PP, de Almeida LA, Carvalho NB, Azevedo V, Silva TM, Teixeira HC, Faria AC, Oliveira SC. Lack of endogenous IL-10 enhances production of proinflammatory cytokines and leads to Brucella abortus clearance in mice. PLoS One 2013; 8:e74729; PMID:24069337; http://dx.doi.org/10.1371/journal.pone.0074729
- Gorvel L, Textoris J, Banchereau R, Ben Amara A, Tantibhedhyangkul W, von Bargen K, Ka MB, Capo C, Ghigo E, Gorvel JP, et al. Intracellular bacteria interfere with dendritic cell functions: role of the type I interferon pathway. PLoS One 2014; 9:e99420; PMID:24915541; http://dx.doi.org/10.1371/journal.pone.0099420
- Copin R, De Baetselier P, Carlier Y, Letesson JJ, Muraille E. MyD88-dependent activation of B220-CD11b+LY-6C+ dendritic cells during Brucella melitensis infection. J Immunol 2007; 178:5182-91; PMID:17404301; http://dx.doi.org/10.4049/jimmunol.178.8.5182
- Serbina NV, Salazar-Mather TP, Biron CA, Kuziel WA, Pamer EG. TNF/iNOS-producing dendritic cells mediate innate immune defense against bacterial infection. Immunity 2003; 19:59-70; PMID:12871639; http://dx.doi.org/10.1016/S1074-7613(03)00171-7
- Copin R, Vitry MA, Hanot Mambres D, Machelart A, De Trez C, Vanderwinden JM, Magez S, Akira S, Ryffel B, Carlier Y, et al. In situ microscopy analysis reveals local innate immune response developed around Brucella infected cells in resistant and susceptible mice. PLoS Pathog 2012; 8:e1002575; PMID:22479178; http://dx.doi.org/10.1371/journal.ppat.1002575
- Inaba K, Inaba M, Romani N, Aya H, Deguchi M, Ikehara S, Muramatsu S, Steinman RM. Generation of large numbers of dendritic cells from mouse bone marrow cultures supplemented with granulocyte/macrophage colony-stimulating factor. J Exp Med 1992; 176:1693-702; PMID:1460426; http://dx.doi.org/10.1084/jem.176.6.1693
- Guilliams M, Ginhoux F, Jakubzick C, Naik SH, Onai N, Schraml BU, Segura E, Tussiwand R, Yona S. Dendritic cells, monocytes and macrophages: a unified nomenclature based on ontogeny. Nat Rev Immunol 2014; 14:571-8; PMID:25033907; http://dx.doi.org/10.1038/nri3712
- Brasel K., De Smedt T, Smith JL, Maliszewski CR. Generation of murine dendritic cells from flt3-ligand-supplemented bone marrow cultures. Blood 2000; 96:3029-39; PMID:11049981
- Naik SH, Proietto AI, Wilson NS, Dakic A, Schnorrer P, Fuchsberger M, Lahoud MH, O'Keeffe M, Shao QX, Chen WF, et al. Cutting edge: generation of splenic CD8+ and CD8- dendritic cell equivalents in Fms-like tyrosine kinase 3 ligand bone marrow cultures. J Immunol 2005; 174:6592-7; PMID:15905497; http://dx.doi.org/10.4049/jimmunol.174.11.6592
- Bohannon JK, Cui W, Toliver-Kinsky T. Endogenous Fms-like tyrosine kinase-3 ligand levels are not altered in mice after a severe burn and infection. BMC Immunol 2009; 10:47; PMID:19715582; http://dx.doi.org/10.1186/1471-2172-10-47
- Cheers C, Haigh AM, Kelso A, Metcalf D, Stanley ER, Young AM. Production of colony-stimulating factors (CSFs) during infection: separate determinations of macrophage-, granulocyte-, granulocyte-macrophage-, and multi-CSFs. Infect Immun 1988; 56:247-51; PMID:3257205
- Zhan Y, Vega-Ramos J, Carrington EM, Villadangos JA, Lew AM, Xu Y. The inflammatory cytokine, GM-CSF, alters the developmental outcome of murine dendritic cells. Eur J Immunol 2012; 42:2889-900; PMID:22806691; http://dx.doi.org/10.1002/eji.201242477
- Mohamadzadeh M, Berard F, Essert G, Chalouni C, Pulendran B, Davoust J, Bridges G, Palucka AK, Banchereau J. Interleukin 15 skews monocyte differentiation into dendritic cells with features of Langerhans cells. J Exp Med 2001; 194:1013-20; PMID:11581322; http://dx.doi.org/10.1084/jem.194.7.1013
- Saikh KU, Khan AS, Kissner T, Ulrich RG. IL-15-induced conversion of monocytes to mature dendritic cells. Clin Exp Immunol 2001; 126:447-55; PMID:11737061; http://dx.doi.org/10.1046/j.1365-2249.2001.01672.x
- Pulendran B, Dillon S, Joseph C, Curiel T, Banchereau J, Mohamadzadeh M. Dendritic cells generated in the presence of GM-CSF plus IL-15 prime potent CD8+ Tc1 responses in vivo. Eur J Immunol 2004; 34:66-73; PMID:14971031; http://dx.doi.org/10.1002/eji.200324567
- Regamey N, Obregon C, Ferrari-Lacraz S, van Leer C, Chanson M, Nicod LP, Geiser T. Airway epithelial IL-15 transforms monocytes into dendritic cells. Am J Respir Cell Mol Biol 2007; 37:75-84; PMID:17363780; http://dx.doi.org/10.1165/rcmb.2006-0235OC
- Perera PY, Lichy JH, Waldmann TA, Perera LP. The role of interleukin-15 in inflammation and immune responses to infection: implications for its therapeutic use. Microbes Infect 2012; 14:247-61; PMID:22064066; http://dx.doi.org/10.1016/j.micinf.2011.10.006
- Vecchi A, Massimiliano L, Ramponi S, Luini W, Bernasconi S, Bonecchi R, Allavena P, Parmentier M, Mantovani A, Sozzani S. Differential responsiveness to constitutive vs. inducible chemokines of immature and mature mouse dendritic cells. J Leukoc Biol 1999; 66:489-94; PMID:10496320
- Serbina NV, Pamer EG. Monocyte emigration from bone marrow during bacterial infection requires signals mediated by chemokine receptor CCR2. Nat Immunol 2006; 7:311-7; PMID:16462739; http://dx.doi.org/10.1038/ni1309
- Forster R, Schubel A, Breitfeld D, Kremmer E, Renner-Müller I, Wolf E, Lipp M. CCR7 coordinates the primary immune response by establishing functional microenvironments in secondary lymphoid organs. Cell 1999; 99:23-33; PMID:10520991; http://dx.doi.org/10.1016/S0092-8674(00)80059-8
- Randolph GJ, Ochando J, Partida-Sanchez S. Migration of dendritic cell subsets and their precursors. Annu Rev Immunol 2008; 26:293-316; PMID:18045026; http://dx.doi.org/10.1146/annurev.immunol.26.021607.090254
- Jimenez F, Quinones MP, Martinez HG, Estrada CA, Clark K, Garavito E, Ibarra J, Melby PC, Ahuja SS. CCR2 plays a critical role in dendritic cell maturation: possible role of CCL2 and NF-kappa B. J Immunol 2010; 184:5571-81; PMID:20404272; http://dx.doi.org/10.4049/jimmunol.0803494
- Masurier C, Pioche-Durieu C, Colombo BM, Lacave R, Lemoine FM, Klatzmann D, Guigon M. Immunophenotypical and functional heterogeneity of dendritic cells generated from murine bone marrow cultured with different cytokine combinations: implications for anti-tumoral cell therapy. Immunology 1999; 96:569-77; PMID:10233743; http://dx.doi.org/10.1046/j.1365-2567.1999.00728.x
- Feili-Hariri M, Falkner DH, Morel PA. Polarization of naive T cells into Th1 or Th2 by distinct cytokine-driven murine dendritic cell populations: implications for immunotherapy. J Leukoc Biol 2005; 78:656-64; PMID:15961574; http://dx.doi.org/10.1189/jlb.1104631
- Zhan Y, Cheers C. Endogenous gamma interferon mediates resistance to Brucella abortus infection. Infect Immun 1993; 61:4899-901; PMID:8406893
- Murphy EA, Parent M., Sathiyaseelan J, Jiang X, Baldwin CL. Immune control of Brucella abortus 2308 infections in BALB/c mice. FEMS Immunol Med Microbiol 2001; 32:85-8; PMID:11750226; http://dx.doi.org/10.1111/j.1574-695X.2001.tb00536.x
- Murphy EA, Sathiyaseelan J, Parent MA, Zou B, Baldwin CL. Interferon-gamma is crucial for surviving a Brucella abortus infection in both resistant C57BL/6 and susceptible BALB/c mice. Immunology 2001; 103:511-8; PMID:11529943; http://dx.doi.org/10.1046/j.1365-2567.2001.01258.x
- Martirosyan A, Ohne Y, Degos C, Gorvel L, Moriyón I, Oh S, Gorvel JP. Lipopolysaccharides with acylation defects potentiate TLR4 signaling and shape T cell responses. PLoS One 2013; 8:e55117; PMID:23390517; http://dx.doi.org/10.1371/journal.pone.0055117