
ABSTRACT
Edwardsiella piscicida is the leading pathogen threatening worldwide aquaculture industries. The 2-component system (TCS) EsrA-EsrB is essential for the pathogenesis of this bacterium. However, little is known about the regulon and regulatory mechanism of EsrA-EsrB or about the factors that mediate the interaction of TCS with bacterial hosts. Here, our RNA-seq analysis indicated that EsrB strongly induces type III and type VI secretion systems (T3/T6SS) expression and that it modulates the expression of both physiology- and virulence-associated genes in E. piscicida grown in DMEM. EsrB binds directly to a highly conserved 18-bp DNA motif to regulate the expression of T3SS and other genes. EsrB/DMEM-activated genes include 3 known and 6 novel T3SS-dependent effectors. All these effector genes are highly induced by EsrB during the late stage of in vivo infection in fish. Furthermore, although in vivo colonization by the bacterium relies on EsrB and T3/T6SS expression, it does not require the expression of individual effectors other than EseJ. The mutant lacking these 9 effectors showed significant defects in in vivo colonization and virulence toward turbot, and, more importantly, a high level of protection against challenges by wild-type E. piscicida, suggesting that it may represent a promising live attenuated vaccine. Taken together, our data demonstrate that EsrB plays a global regulatory role in controlling physiologic responses and the expression of T3SS and its cognate effector genes. Our findings will facilitate further work on the mechanism of molecular pathogenesis of this bacterium during infection.
Introduction
During growth in a dynamic environment or infection of a specific host and disease progression, bacterial pathogens must correspondingly adjust their gene expression profiles to adapt to the changing signals present in these scenarios. Two-component system (TCS)-mediated signal transduction is one of the vital strategies adopted by bacteria to enable dynamic changes in virulence- and stress adaptation-related gene expression.Citation1,Citation2 TCS typically consists of a membrane-bound sensor histidine kinase (HK) that perceives environmental stimuli and a response regulator (RR) that usually controls gene expression and has been shown to modify numerous cellular processes, e.g., virulence, quorum sensing, biofilm formation, and antibiotic resistance. These responses confer upon bacteria the capacity to efficiently adapt to various niches and lifestyles.Citation3 Elucidating the genes controlled by TCS will facilitate the understanding of the mechanisms underlying TCS scouting of environmental/host cues and switching gene expression and ultimately lead to the development of antibacterial therapies.Citation4
Edwardsiella piscicida (formerly included in E. tarda),Citation5,Citation6,Citation7,Citation8 a member of the Enterobacteriaceae, colonizes a broad range of hosts including fish and mammals and causes fatal hemorrhagic septicemia and gastro- and extra-intestinal infections.Citation9,Citation10,Citation11,Citation12 As a leading pathogen that threats fresh and seawater aquaculture farms, E. piscicida causes huge economic losses to the world aquaculture industry, especially for farmed flatfish (turbot and flounder). A number of virulence factors are involved in the pathogenesis of this bacterium, including adhesins and temperature-sensitive hemagglutinin (Tsh), which bind to host surfaces and initiate infection,Citation13,Citation14,Citation15 and EthA hemolysin, which facilitates invasion and the process of internalization into hosts.Citation16 Once it enters the host tissues, the Edwardsiella bacterium utilizes several factors, including gadB to counteract the host's defenses,Citation17 siderophores to acquire nutrients within the host, and extracellular enzymes to aid bacterial spreading.Citation18,Citation19,Citation20,Citation21
E. piscicida invades and colonizes various cells, including Hep-2, HeLa, epithelioma papillosum of carp (EPC), macrophage-like cells J774A.1 and fish primary phagocytes.Citation22,Citation23,Citation24,Citation25 E. piscicida attaches to host cells and translocates effector proteins into these cells via type III and type VI secretion systems (T3SS and T6SS, respectively), which are necessary for bacterial survival, replication and pathogenesis.Citation22,Citation26 These 2 secretion systems enable the bacterium to enter, survive and replicate inside epithelial cells and phagocytes and to spread and invade deeper tissues.Citation18,Citation23,Citation27 At present, only 3 T3SS effectors have been documented in E. piscicida. EseG (ETAE_0866) is a T3SS effector that localizes the host membrane fraction after translocation; it destabilizes microtubules when overexpressed in mammalian cells through a conserved domain that includes amino acid residues 142–192.Citation28,Citation29 EseJ (ETAE_0888) is also a translocated T3SS effector; it reduces bacterial adhesion to EPC cells and facilitates intracellular bacterial replication.Citation30 ETAE_1757 was recently identified as a novel T3SS effector that is translocated into the host nucleus and inhibits the phosphorylation of MAPK in host cells.Citation24 Identification and characterization of other T3SS and T6SS effectors and their roles in pathogenicity will facilitate understanding of the exquisite mechanisms of the bacterium's interaction with its hosts.
Genome-wide analysis indicates that 33 putative TCS systems are encoded by E. piscicida.Citation5 Systematic mutation of the single RR gene reveals that EsrA-EsrB is the most essential TCS in E. piscicida pathogenesis.Citation31 Like their counterparts SsrA, SsrB and SPI-2 in Salmonella,Citation32,Citation33,Citation34 EsrA and EsrB and the associated T3SS locus may be horizontally acquired and may have evolved to coordinate the expression of virulence and adaptation to host microenvironments by the reprogramming of ancestral genes unlinked to the T3SS locus.Citation6 Although the exact stimulus recognized by HK EsrA remains elusive,Citation35 EsrA-EsrB plays a key role in regulating the expression and secretion of T3SS and T6SS by directly binding to the promoters of T3SS genes and to that of EsrC, which further regulates the expression of other T3SS and T6SS genes in the bacterium.Citation22,Citation36,Citation37 It is still unknown whether other genes, especially those associated with the invasion process, and their regulatory mechanisms are controlled by EsrB during in vivo and in vitro infection of hosts. With its critical role in the regulation of pathogenesis in the bacterium, EsrB merits consideration as a valuable target for the construction of a live attenuated vaccine against edwardsiellosis in fish.Citation38,Citation39
In this study, we compared the transcriptomes of E. piscicida wild-type and ΔesrB strains cultured in Dulbecco's Modified Eagle's Medium (DMEM) that induces expression of T3SS and T6SS genes and may mimic conditions encountered during infection of macrophages.Citation40,Citation41,Citation42,Citation43 This comparison can contribute to a detailed understanding of E. piscicida pathogenesis and the mechanisms underlying its interaction with its hosts.
Results
RNA-seq profiling of the E. piscicida transcriptome
Previous genomic and comparative genomic analyses established that E. piscicida EIB202, like other strains of this species classified as E. tarda genotype I (EdwGI), encodes one set of T3SS genes and one set of T6SS genes.Citation5,Citation6 In the T3SS gene cluster, the concomitant 2-component system (TCS) EsrA-EsrB is essential for the bacterium's pathogenesis.Citation6,Citation31 To better decipher the regulatory roles and the regulatory mechanisms of the response regulator EsrB, we performed RNA-seq analysis with EIB202 and ΔesrB RNA isolated from LB (n = 3) and DMEM cultures (n = 3) and compared their differential gene expression. DMEM was used to induce the expression of T3SS and T6SS proteins possibly by mimicry of in vivo or intracellular condition.Citation40,Citation41,Citation42,Citation43 When grown in LB, there was no apparent growth difference between WT and ΔesrB, whereas in DMEM, the growth of ΔesrB was markedly faster than that of WT, suggesting a regulatory role of EsrB in E. piscicida metabolic pathways during growth in DMEM (Figs. S1A and S1B). Approximately 2.7∼7.1 million high-quality reads were obtained from each RNA sample (Fig. S2A). Because rRNAs were removed, most (greater than 97%) of these reads corresponded to the sense strand of annotated ORFs or to non-coding RNAs (unannotated regions) (Fig. S2B). The correlation coefficient (R2) of normalized expression per gene between biologic replicates ranged from 0.96 to 0.98, and most of T3SS and T6SS genes were induced only in samples of WT E. piscicida cultured in DMEM (Fig. S3).
Comparative analysis of E. piscicida gene expression under different conditions
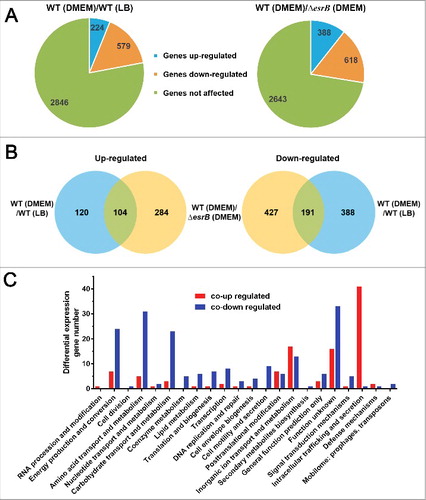
To identify genes that are differentially expressed under different conditions, i.e., WT in DMEM vs. WT in LB and WT in DMEM vs. ΔesrB in DMEM, we used DESeq, a differential expression analysis package that models read abundance using a negative binomial distribution.Citation44 Numerous genes scattered on the chromosome were affected under both comparisons (, Table S1). Most significantly, 30 of 35 T3SS cluster genes (ETAE_0854-ETAE_0888) and all of the 16 T6SS (ETAE_2428-ETAE_2443) cluster genes were significantly upregulated by >4-fold in both comparisons (). When the data from WT cultures grown in DMEM or LB were compared, 224 (6%) and 579 (16%) of the annotated 3,649 annotated chromosome ORFs and 53 plasmid ORFsCitation5 were found to be up and downregulated (> 4-fold, Padj < 1 × 10⁻²), respectively (). More remarkably, 388 (11%) and 618 (17%) genes were up and downregulated (> 4-fold, Padj < 1 × 10⁻⁵), respectively, when WT and ΔesrB cultures grown in DMEM were compared. These data suggested that EsrB may serve both as a repressor and as an activator in E. piscicida. To gain insight into the extent to which EsrB and growth in DMEM account for gene expression profiles, we compared the RNA-seq data and observed significant overlaps between different comparisons. The Venn diagrams in show overlaps among genes with increased () or decreased () transcript abundance in response to the different conditions. There are 104 co-upregulated genes and 191 co-downregulated genes (> 4-fold, Padj < 1 × 10⁻²) in these comparisons. Both EsrB and DMEM highly induced the expression of T3SS and T6SS genes, which comprise over one-third of the co-upregulated genes (Table S1). Of note, over one-third (n = 49) of the genes identified as differentially expressed are annotated as function unknown. Thus, 295 differentially expressed genes were identified and classified into COG categories (). Genes associated with intracellular trafficking and secretion, i.e., the T3SS and T6SS genes, represented the most highly enriched category of genes induced by EsrB and DMEM. Notably, the genes repressed by EsrB and DMEM are involved in energy production, in the metabolism of amino acids, carbohydrates, coenzymes and lipids, in protein biosynthesis (transcription and translation) and in cell motility.
Figure 1. RNA-seq analysis of differential gene expression of wild type (WT) and ΔesrB cultured in DMEM (n = 3) and LB (n = 3) based on normalized transcript levels. The middle circles correspond to forward and reverse NCBI gene annotation and include named genes (blue), hypothetical genes (gray), rRNA (orange) and tRNA (pink). The outermost and innermost circles show the forward and reverse log2 of differential abundance in WT in DMEM versus WT in LB (left) or WT vs. ΔesrB in DMEM (right), respectively. ORFs whose abundance is significantly higher or lower (fold > 4, Padj < 1 × 10⁻²) than the normalized average expression level are shown in green and red, respectively. The regions highlighted in blue and yellow correspond to T3SS and T6SS, respectively.
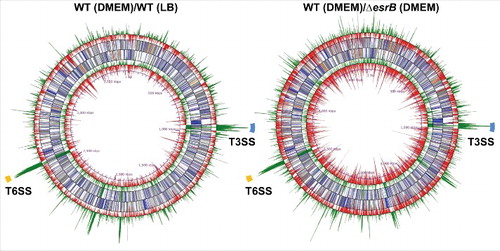
Figure 2. Comparative analyses of the E. piscicida transcriptional response to DMEM and EsrB abrogation. (A) Pie charts representing differentially transcribed genes in WT and ΔesrB cells grown in DMEM and LB. (B) Venn diagrams showing overlaps among genes with significantly increased (left) or decreased (right) transcript abundance (fold > 4, Padj < 1 × 10⁻²) in response to the different culture conditions. (C) COG categories of co-upregulated (red) or co-downregulated (blue) genes cultured under different conditions as indicated in (B).
To gain further insight into how E. piscicida gene expression is related to pathogenesis and physiology, we grouped some differentially expressed virulence genes based on their MA plots (). This analysis further demonstrated that several functional categories of genes, including those regulated by T3SS and T6SS, are significantly enriched among the differentially expressed genes ( and , Table S1). The iron acquisition system is essential for survival as well as for host colonization by Edwardsiella.Citation15,Citation37,Citation45,Citation46 Here, many genes associated with iron sequestering and transporters (hemin uptake and siderophore-mediated iron uptake systems) were, interestingly, found to be highly induced under both EsrB and DMEM growth conditions. DMEM is nutrient-depleted, therefore, it is likely that iron transport genes were upregulated to enhance uptake of the iron needed for growth in this medium. We further tested this by growing the WT and ΔesrB strains in LB and DMEM to which the iron chelator, DP, had been added (Figs. S1C and S1D). A fur (ferric uptake regulator) null mutant (fur−) was used as a control and it was significantly impaired in its growth in all the conditions tested. In DMEM supplemented with DP, all the strains grew extremely slowly, whereas in LB medium containing DP, WT grew faster than ΔesrB (P<0.05), indicating that esrB is essential for proper functioning of the iron uptake system in the bacterium.
Figure 3. MA plots showing changes in gene expression between WT in DMEM vs. LB (A) and WT vs. ΔesrB in DMEM (B). The log2 of the ratio of the abundances of each transcript between the 2 conditions (M) is plotted against the average log2 of the abundance of that transcript in both conditions (A). T3SS, T6SS, iron uptake, effectors, surface structure and effector genes are highlighted.
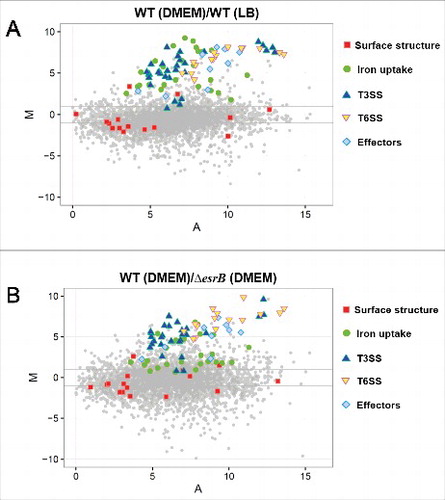
In contrast, annotated ORFs associated with hemolysins (ETAE_0818, ETAE_0821, ETAE_1008, ETAE_2089, ETAE_2937, ETAE_3034–3045) were among the genes whose expression was co-downregulated, as were 3 adhesion genes (ETAE_0315, ETAE_0323 and ETAE_2842) and 3 genes associated with outer membrane proteins (ETAE_0817, ETAE_1267 and ETAE_1528) (). The expression of these early-stage virulence genes (grouped as surface-structure-related genes) was temporally different from that of T3SS and T6SS, which is consistent with previous findings that during intracellular survival of the bacterium inside macrophages, expression of T3SS proteins such as EsaC and EseB is significantly increased, whereas the production of flagellar proteins and EthA is decreased.Citation16 Interestingly, our previous RNA-seq data showed that an intracellular E. piscicida population released from pyroptotic macrophages has enhanced virulence compared with DMEM-cultured bacteria.Citation47 In general, the results showed that T6SS genes were significantly upregulated and that most of the T3SS genes remained unchanged (Fig. S4). These findings suggest that the real conditions in the intracellular environment may vary from those during growth in DMEM or that there are other unknown factors that specifically trigger EsrB-dependent T6SS expression at various stages of infection.
As a global regulator, EsrB may regulate multiple pathways simultaneously. RNA-seq data showed that some metabolic genes were indeed regulated by EsrB, as with the DMEM condition. Some genes encoding nutrient-transporting systems that transport essential nutrients for bacterial growth and proliferation were co-upregulated (Table S1). On the other hand, due to the limited nutrients present in DMEM, several genes associated with basal metabolism and protein synthesis were co-downregulated in DMEM and by EsrB; these included dehydrogenase genes, carbohydrate transport genes and amino acid transport system genes. Genes associated with nitrite/nitrate reduction reactions that require metal ions as catalysts were also co-downregulated. Our data indicate that EsrB, the global transcription factor, serves as a repressor and an activator of metabolic and virulence genes, specifically T3/T6SS genes, thereby enabling the bacterium to adapt to different conditions and niches.
EsrB binds directly to the promoters of T3SS and other genes at a conserved 18-bp consensus motif
We further investigated how EsrB controls the expression of the above-described genes. We first confirmed that EsrB is essential for the expression of the T3SS and T6SS proteins during growth in DMEM. Our investigation indicated that 7 extracellular proteins, EseB\C\D\J from T3SS and EvpC\P\I from T6SS, were detected when WT was cultured in DMEM but were absent from WT grown in LB and from ΔesrB grown in DMEM ( and ), similar to the findings for other E. piscicida strains.Citation30,Citation36 The AraC family regulator EsrC, which is encoded in the T3SS gene cluster, is essential for T3SS and T6SS gene expression.Citation36,Citation37 When EsrC was abrogated, the extracellular T3/T6 proteins were also missing, and the introduction of an EsrC expression plasmid into the mutant restored T3/T6SS protein production (), suggesting that both EsrB and EsrC control T3/T6SS expression. Electrophoretic mobility shift assays (EMSAs) showed that EsrB bound specifically to a DNA probe that included the upstream regions of the esrC and esaM genes in the T3SS gene cluster (). In comparison to the negative control gyrB, to which EsrB does not bind (), both esrC and esaM were significantly enriched by EsrB as measured by the ChIP-qPCR test (). We performed DNase I protection assays to map the binding sites for EsrB in the PesrC and PesaM regions and found 2 distinct EsrB binding sites in these 2 promoter regions ( and ). Taken together, the data show that EsrB binds directly to the promoter regions of esrC (−74- −57 relative to ATG) and esaM (−76- −59), indicating that EsrB plays both direct and indirect roles in the regulation of T3SS.
Figure 4. EsrB binds directly to a specific DNA motif to control the expression of T3SS and other genes. (A) ECP profiles of EIB202 WT and ΔesrB were detected by SDS-PAGE. Strains were cultured in LB and DMEM, respectively, at 30°C for 24 h without shaking. (B) Total protein secreted when the strains were grown in LB or DMEM conditions. The secreted proteins were quantitatively assayed against controls consisting of DMEM. **, P < 0.01 based on one-way ANOVA. (C) EMSA of the indicated promoter regions using purified EsrB. The amounts of EsrB protein used are indicated; 20 ng of each Cy5-labeled probe was added to the EMSA mixtures. The specificity of the shifts was verified by adding a 10-fold excess of nonspecific competitor DNA poly(dI·dC) to the EMSA mixtures. Bound (B) and unbound (U) DNA bands are indicated. (D) ChIP-qPCR analysis was used to determine the binding of EsrB to target promoter regions in E. piscicida. The results shown are normalized to the expression of the control gene gyrB and the results from the sample without EsrB, which was arbitrarily set as 1. The results were calculated using the ΔΔCT method. (E-F) Footprinting analysis of EsrB binding to a binding site in the esrC and esaM promoter. Electropherograms of a DNase I digest of the promoter probes (200 ng) after incubation with 0 or 66 µM EsrB are shown. The respective nucleotide sequences that were protected by EsrB are indicated below, and the specific binding motifs are highlighted. (G) Alignment of the EsrB-binding motifs from the promoter regions of EsrB-controlled genes as revealed by RNA-seq analysis. The established binding motifs from ssaG and ssaM in Salmonella enterica are also shown. P-values are shown for the genes identified with FIMO. (H) The EsrB binding motif derived from the binding sequences (G) generated by the MEME tool. The height of each letter represents the relative frequency of each base at the given position in the consensus sequence.
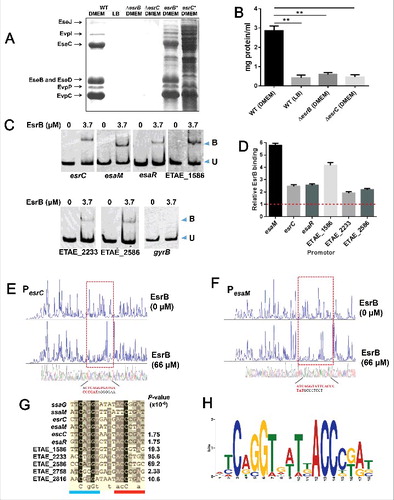
The identification of 2 binding motifs in esrC and esaM, together with the list of genes regulated by EsrB as revealed by RNA-seq, enabled us to identify an additional 7 promoter regions containing a putative EsrB binding box using the program FIMO (G and H). Alignment of these binding sequences indicated a highly conserved consensus sequence similar to the SsrB binding motif in ssaM and ssaG from Salmonella enterica.Citation33 Similar to the Salmonella SsrB binding box, the heptameric sequence (ATCAGGT) was identified in a 7–4–7 tail-to-tail architecture that created an 18-bp degenerate palindrome. This palindrome was also found at other sites in the T3SS region (ETAE_0873 (escC) and esaR) in addition to esrC and esaM. Other non-T3SS genes containing a putative EsrB binding consensus include ETAE_2816 encoding for a BadM/Rrf2 family transcriptional regulator, ETAE_2758 encoding a putative T2 ribonuclease, and ETAE_2233 (artM), and ETAE_2586 (sdhA) that are related to metabolic pathways in arginine utilization and tricarboxylic acid (TCA) cycle. Among these genes, ETAE_2816, ETAE_2233, and ETAE_2586 were significantly downregulated by EsrB as revealed by RNA-seq ( and Table S1).
EMSAs were further performed with the specific promoter regions of esaR, ETAE_2233, ETAE_2586, and ETAE_1586 (see below) containing the binding box; the results confirmed that there are functional DNA elements for EsrB binding in these regions (). EsrB did not bind the promoter regions of these genes in the absence of the specific consensus sequence. Furthermore, ChIP-qPCR analysis also indicated that EsrB binds directly to the specific promoter regions of esaR, ETAE_2233, ETAE_2586, and ETAE_1586 (). Taken together, these results show that EsrB controls the expression of T3SS and other genes throughout the genome through interaction with the specific 18-bp binding box.
The EsrB regulon includes T3SS effectors that are translocated into HeLa cells with different efficiencies
Based on the above-mentioned observations that EsrB directly binds to and switches on the expression of T3/T6SS clustered genes as well as other genes scattered on the chromosome in E. piscicida, we hypothesized that their respective translocated effector genes might be simultaneously controlled by EsrB or growth in DMEM. Thus, TEM-1 based effector translocation assays were performed to determine whether any of the co-upregulated genes are potential translocated effectors. In this assay, effector-β-lactamase fusions are translocated into host cells, where their β-lactamase activity results in cleavage of the CCF2 substrate and emission of blue light at 450 nm; in the absence of β-lactamase activity and the preservation of intact CCF2, excitation at 409 nm results in intramolecular FRET and the emission of green light at 520 nmCitation29,Citation48 (Fig. S5A). A total of 6 hemin uptake genes, 5 putative siderophore synthesis and uptake genes, and 26 T3/T6SS apparatus genes were excluded from the 104 co-upregulated genes, resulting in 67 remaining candidates; these were subjected to further translocation assays (Fig. S5B). A total of 9 candidate genes showed positive extracellular secretion (Fig. S6B) and intracellular translocation () in HeLa cells and are very likely to be effectors of E. piscicida. The amino acid sequences of the 9 effector proteins were analyzed by bioinformatics (). Most of the putative effectors, except for EseG and EseJ, were scattered on the chromosome outside the T3SS gene cluster (Fig. S6A). EseG (ETAE_0866), a known T3SS effector in Edwardsiella bacteria, plays an important role in microtubule disassembly.Citation29 EseJ (ETAE_0888) is a newly identified T3SS effector that has been shown to inhibit bacterial adhesion to EPC cells and to facilitate intracellular replication.Citation30 Translocation of this full-sized effector (1359 aa) into EPC cells was verified by the cAMP-based translocation assay.Citation30 EseN (ETAE_1757, formerly EseH)Citation24 was recently identified as a T3SS effector and as a homolog of SpvC in Salmonella and of OspF in Shigella flexneri; these proteins have been shown to translocate to the host nucleus and to inhibit the phosphorylation of proteins in the JNK MAPK pathways. Thus, in a translocation assay that used the expression plasmid pCX340 without the effector gene as a negative control, all 3 of these gene products were validated as effectors ().
Figure 5. Identification of 9 EsrB-regulated putative effectors using HeLa cell translocation assays. (A) HeLa cells were infected with EIB202 WT, ΔT3SS, or ΔT6SS strains expressing TEM-1 fused to the 67 candidate genes. Seven hours after infection, the HeLa cells were washed and loaded with CCF2-AM. Translocation of the TEM effectors into host cells causes the cleavage of the CCF2 product, resulting in the emission of a blue fluorescence signal, whereas uncleaved CCF2 emits green fluorescence upon excitation at 409 nm. Bar = 100 µm. (B) Translocation was further determined by counting the ratio of blue cells to total cells in the foci (n = 5). *, P < 0.05 based on Student's t-test. (C) Translocation analysis based on a single-time-point translocation (STPT) assay as detailed in Materials and Methods. All the experiments were performed independently at least 3 times with 5 parallel samples.
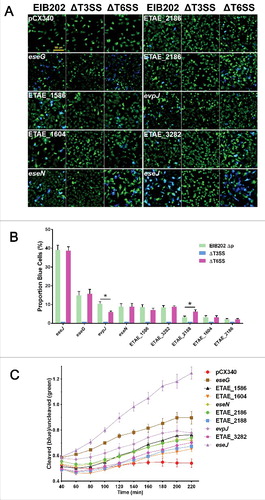
Table 1. Putative E. piscicida T3SS effectors identified by comparative transcriptomic analysis.
The remaining 6 EsrB/DMEM-regulated genes represent novel putative effectors ( and ). ETAE_1586 may function either as a releasing peptidase or as a toxin, as it has a papain-fold toxin domain that is commonly found in bacterial polymorphic toxin systems. ETAE_1604 has an exosort_VPLPA motif and thus may function as an exosortase. ETAE_2186 is a putative thioredoxin (Trx) with the universally conserved active site -Cys-Gly-Pro-Cys-. ETAE_2188 is a hypothetical protein with a conserved DUF1471 domain. ETAE_2438 has a PAAR (proline-alanine-alanine-arginine repeat protein)-like motif that facilitates the formation of a sharp conical extension of the VgrG spike, which facilitates T6SS-mediated secretion.Citation49 ETAE_3282 is a hypothetical protein without any conserved sequence, motif or structure. To determine whether the 9 translocation-positive candidates are substrates of T3SS or T6SS, pCX340-derived plasmids expressing the candidate effector-TEM fusions were transformed into T3SS and T6SS mutants lacking the corresponding apparatus genes (EseBCD for T3SS and EvpAB for T6SS), and the TEM-1 translocation assay was performed as described above. All 9 candidates were translocated into HeLa cells in a T3SS-dependent manner (). Various translocation efficiencies were observed for the putative effectors; the ETAE_0888 (EseJ) and ETAE_0866 (EseG) fusions displayed the highest translocation efficiencies, and ETAE_1604 and ETAE_2186 displayed the lowest translocation efficiencies (). Quantitative end point (2 h) translocation analysis also indicated that T6SS might be involved in modulating the translocation efficiencies of ETAE_2438 and ETAE_2188 (). Translocation of these effectors was further analyzed using single-time-point translocation (STPT) assays; the result indicated that all effectors reached their respective maximal levels in the host cells after ∼4 h observation (). Taken together, RNA-seq analysis led to the conclusion that 9 candidate T3SS-dependent effectors were directly (e.g., ETAE_1586, ) or indirectly controlled by EsrB in vitro and translocated into host cells. These findings will facilitate the further detailed study of the molecular basis of E. piscicida pathogenesis.
EsrB is essential for the expression of effector genes in vivo and in vitro
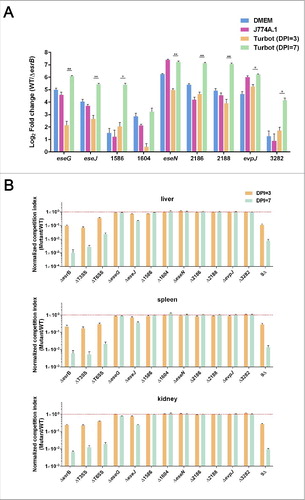
We further investigated the influence of EsrB on effector gene expression during infection of J774A.1 macrophages and turbot fish. WT and ΔesrB released from J774A.1 were prepared.Citation47 Healthy turbots were infected intraperitoneally (i.p.) with WT and ΔesrB at a dosage of 105 CFU/fish. The livers, major immune-organ and colonization site for E. piscicida,Citation64 from 5 fish for each replicate were harvested at 3 and 7 DPI. As a control to verify the RNA-seq analysis results, WT and ΔesrB cells grown in DMEM were also harvested. RNA samples were extracted from 3 replicates and analyzed by qRT-PCR. The results showed that, compared with the housekeeping gene gyrB, EsrB strongly induced the expression of the 9 effector genes when EIB202 was grown in vitro in DMEM (). Similarly, the 9 effector genes were highly upregulated by EsrB in J774A.1 and turbot, especially at 7 DPI, to different extents (), verifying the EsrB-dependence of effector gene expression in vitro and in vivo. It is notable that expression of all 9 effector genes was dramatically triggered at the late stage of infection (7 DPI) in turbot compared with 3 DPI. This suggests that unknown host factor(s) resulting from the bacterial infection might further exacerbate the EsrB dependency of T3SS gene expression in vivo as the infection progresses.
Figure 6. Characterization of the in vitro and in vivo expression of the putative effectors (A) and their fitness contribution in E. piscicida during infection of turbot fish (B). (A) qRT-PCR analysis of the expression of the putative effectors during bacterial growth in DMEM, J774A.1 or in vivo in turbot fish at 3 or 7 DPI. The preparation of total mRNA from E. piscicida WT and ΔesrB cells grown in the above-mentioned conditions is detailed in Materials and Methods. *P < 0.05, **P < 0.01 based on Student's t-test. (B) Barcoded WT and in-frame deletion mutants of the putative effectors were recovered from turbot fish inoculated with a pool of WT and mutant strains, and competitive indices (CI) were calculated based on the ratios of individual mutant/WT tags in output vs. input. Data from liver, spleen and kidney at 3 and 7 DPI are shown as the mean ± SEM. *P < 0.05, **P < 0.01 based on ANOVA followed by Dunnett's test for multiple comparisons comparing the data with the corresponding WT (barcode A,B)/WT(barcode C,D). All the experiments were conducted in triplicate with liver, spleen, and kidney samples that were pooled (n = 5) at each time point.
The putative effector genes are required for colonization in turbot
We are intrigued by the possible roles of these EsrB-dependent effectors in bacterial colonization of the host. Therefore, the turbot model was used to perform competitive index sequencing (CI-seq) analysis of candidate effector genes that might contribute to bacterial survival and growth. We generated 9 deletion mutants of the respective effector genes as well as a mutant with the deletion of all 9 effector genes (9Δ). All these mutants, together with WT bacteria and the ΔT3SS and ΔT6SS mutants, were barcoded,Citation63 and their competitive indices were measured. The WT bacteria were tagged with 4 bar-coded sequences; the other strains each received 2 specific tags, as technical replicates to determine the reliability of sequencing. The bacteria were mixed in equal proportions, co-injected into turbot, and harvested at 3 and 7 DPI from the livers, spleens and kidneys of 3 biologic replicates of infected fish. For each replicate, 5 fish tissues were sampled and pooled to maximally normalize the variations in individual fish. CI-seq libraries were prepared and subjected to sequencing on the Miseq platform. There was an excellent correspondence between the 2 technical replicates (R2 = 0.9578) and the 3 biologic replicates (R2 = 0.96–0.97) (Fig. S7). The data revealed that the ΔesrB, ΔT3SS, and ΔT6SS mutants showed significantly lower CIs (∼1 to 3 logs) in the livers, spleens, and kidneys of the infected fish at both 3 and 7 DPI (). Interestingly, the mutant lacking all 9 putative effectors (9Δ) displayed dramatic colonization deficiency similar to that of the ΔesrB, ΔT3SS, and ΔT6SS mutants in all the sampled tissues (). As previously reported, EseG seems to play no dominant role in in vivo colonization by E. piscicida.Citation29 Except for the ETAE_0888 mutant, no other mutants displayed defective colonization compared with WT. The strain with the deletion of ETAE_0888 (ΔeseJ) showed a marginal reduction in CI at 3 DPI and a significant (∼5-fold) decrease at 7 DPI (), demonstrating the essential role of ETAE_0888 (EseJ) in in vivo colonization. These data also suggest that during the progress of infection, dynamic changes and possible redundancy in the effectors interacting with the host occur.
Systematic disruption of the effectors leads to attenuation of virulence and immune protection in vivo
We characterized the virulence of WT, ΔesrB, ΔT3SS or 9Δ strains toward turbots. The results indicated that the LD50 value of EIB202 was 2.2 × 10³ CFU/fish (). The ΔesrB mutant showed the highest virulence attenuation, and 109 CFU of ΔesrB bacteria killed only 20 percent of the tested turbot, consistent with an LD50 value greater than 109 CFU/fish. The ΔT3SS and 9Δ mutants showed LD50 values of 7.4 × 10⁶ and 1.1 × 10⁷ CFU/fish, respectively. The infection dynamics of the above-mentioned strains in turbot organs (liver, spleen, kidney, and intestine) were determined to test the propagation ability of the mutants (). Over a 4-week observation period, WT bacteria showed explosive growth in all the organs of infected turbot, whereas the ΔesrB, ΔT3SS, and 9Δ mutants all displayed significant defects in propagation in the organs, confirming that the putative effectors contribute to the in vivo fitness and colonization ability of the bacterium ().
Figure 7. (see previous page) Evaluation of virulence and vaccine efficiency of 9Δ in turbot fish. (A) Virulence was analyzed in turbot. Fish were inoculated intramuscularly (i.m.) with a series of dilutions of the WT and mutant strains. The infected fish were monitored for 3 weeks. (B) Infection kinetics of E. tarda strains in turbot. Following i.m. infection with the corresponding strains at a dose of 1 × 10⁵ CFU/fish, the fish were sampled in triplicate at 0, 1, 3, 5, 7, 10, 14, 18, 22, and 28 d. The organs (liver, spleen, kidney, and intestine) from 3 fish were mixed and homogenized, and serial dilutions of the homogenates were plated on DHL agar plates. The bacterial count was normalized by dividing the bacterial count (n = 3) by the weight of the mixed sample. *, P < 0.05; **, P < 0.01 based on student's t-test analysis of the bacterial counts at 14 DPI. (C) Survival curve of vaccinated turbots after challenge. Vaccinated or PBS mock-vaccinated turbot were challenged by injection of WT bacteria. The survival curves were recorded for 28 d after challenge. ***, P < 0.001 based on Kaplan-Meier survival analysis with a log rank test with Prism software (Graphpad Software). The derived relative protection index (RPS) of each strain is shown in the right panel. *, P < 0.05 based on one-way ANOVA. (D) Serum IgM titers against E. piscicida at 35 DPI were assayed by ELISA. The data reflect the mean absorbance and SEM (n = 5).
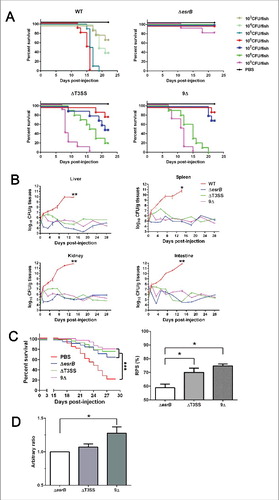
The strong virulence attenuation (∼3 logs) and restricted in vivo propagation observed in the 9Δ strain suggest that these effectors might be promising potential targets for the construction of a live attenuated vaccine (LAV). To test this idea, we inoculated healthy turbot with PBS or with WT and the mutant strains. The control group of fish injected with PBS showed 80% accumulated mortality (). The mortality rates of the fish vaccinated with ΔesrB, ΔT3SS and 9Δ were 32.9%, 23.9% and 20.2%, respectively, with corresponding relative protection ratios (RPSs) of 58.9%, 70.1% and 74.8% (). Production of serum antibodies against each of the E. piscicida mutants was further analyzed (). ELISA analysis showed that the antibody titer of fish vaccinated with 9Δ was significantly higher than that of fish vaccinated with ΔesrB. Collectively, these results demonstrate that systematic disruption of the putative effectors leads to dramatic virulence attenuation and that such disruption has strategic merit for the development of a promising LAV.
Discussion
Edwardsiella piscicida is a Gram-negative, broad-host-range pathogen that causes hemorrhagic septicemia in many commercially important fish species.Citation11,Citation12 A better understanding of E. piscicida pathogenesis may make it possible to produce an appropriate and effective vaccine to prevent edwardsiellosis. Several virulence factors have been reported to be involved in the pathogenesis of this bacterium, including T3SS, which enables it to escape phagocytic killing and to replicate intracellularly in phagocytes,Citation22 and T6SS, which also contributes to the establishment of colonization inside the host.Citation26 The EsrA-EsrB TCS has been shown to be essential for regulation of the expression of T3SS and T6SS.Citation31,Citation37 However, the scope of the regulatory roles of EsrA-EsrB on the virulence and physiology of Edwardseilla bacteria is still unknown. We used RNA-seq analysis to compare the gene expression of E. piscicida grown in DMEM, a condition that mimics bacterial growth during the infection of macrophages,Citation40,Citation41,Citation42,Citation43 and, to resolve the regulatory role of EsrB, upon EsrB abrogation. These analyses resulted in the finding of a conserved EsrB binding consensus motif in the regulated genes and a repertoire of T3SS-dependent effectors, including 3 established effectors and 6 putative novel effectors that are essential for E. pisicida infection of its host.
Multiple RNA-seq-based comparative analysis of the transcriptomes of WT E. piscicida grown under various conditions (LB, DMEM, and J774A.1) provided an overview of the differential expression of virulence genes in E. piscicida ( and Fig. S4). In addition to the T3SS- and T6SS-associated genes, iron uptake- and transport- associated genes were significantly upregulated under DMEM and J774A.1 conditions, confirming that the uptake of iron and certain other essential nutrients is essential for the growth of the bacterium in intracellular niches ( and Figs. S1 and S4). This is expected, as iron is important for bacterial growth, and natural seawater and the body of the bacterial host contain low concentrations of freely available iron. Iron has also been confirmed to be involved in the regulation of virulence gene expression.Citation15,Citation18,Citation37 Most genes associated with the early stage of infection, e.g., those encoding adhesin, hemolysin, proteins of fimbria and flagella, and some outer membrane proteins,Citation50 were downregulated when the bacteria were grown in DMEM (, Fig. S4) rather than in LB or J774A.1. Specifically, EsrB could significantly down-regulate flgC, fliP, and other flagellar biosynthesis related genes (Table S1), which was also oberved for SsrB in S. enterica,Citation32 reinforcing the idea that these surface structures (including flagella) may not be required for intracellular survival and/or that their expression patterns during infection differ from those of the T3SS and T6SS genes.
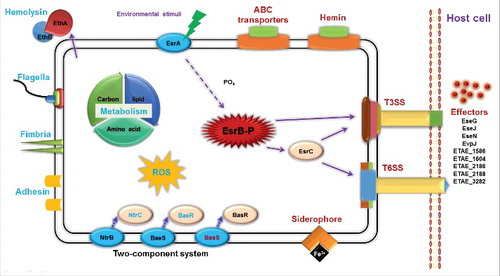
In addition to the previous findings that EsrB is important for the expression of virulence-associated loci (T3SS and T6SS) in E. piscicida ( and ),Citation31 our comparative analysis also intriguingly demonstrated that EsrB acts as a global regulator, controlling the expression of ∼990 genes involved in numerous pathways ( and ). Many of these affected genes are also modulated by growth in DMEM (, Table S1). It is likely that coordinated control of the expression of these genes makes it possible for the bacterium to respond to different environments, rewire its regulatory networks and adapt to new conditions/niches. Indeed, other 2-component signal transduction systems, including BasSR, NtrBC, and BaeSR, are differentially expressed upon EsrB deletion when cells are grown under DMEM conditions. Some nutrient transport genes that ensure the uptake of essential nutrients were co-upregulated; these include the genes for the amino acid transport protein AzlC (ETAE_2754), the mannose-specific PTS system ManZ/Y/X (ETAE_1557–1559), and the molybdate ABC transporter ModA/B/C (ETAE_0924–0926) (, Table S1). In contrast, some basal metabolism and protein synthesis genes were co-downregulated; these included the genes encoding the arginine transport system ArtP/I/M/J, the glutamine transport system GlnP/Q, and the glutamate/aspartate transport system GltJ/K/L (, Table S1). Genes encoding ArtM (ETAE_2233) contains an EsrB binding consensus sequence which mediates direct binding of EsrB to repress artM expression (, , and , Table S1). Another aspect of regulatory roles of EsrB by its directly binding to and downregulation of ETAE_2586 (sdhA) might be associated to inhibition of TCA cycle and electrons transfer in E. piscicida during infection (, , and , Table S1). Thus, EsrB is a multifaceted factor that controls the expression of genes associated with both physiologic adaptation and virulence. Our recent comparative proteomics investigation also indicated that several dozen proteins involved in information storage and processing, cellular processes and signaling, and metabolism were significantly differentially expressed in WT and esrB mutant strains. Intriguingly, EsrB participates in the reactive oxygen species stress response by negatively regulating the expression of KatB/KatG, SodB and Tpx.Citation51 Taken together, the gene expression profiling results presented here delineate i) the spatio-temporal variations in gene expression patterns that occur outside and inside the host cells, and ii) the variations in environmental cues and physiologic signals that trigger virulence/metabolism-related gene expression in E. piscicida during infection ().
Figure 8. Schematic overview of the regulatory roles of TCS EsrA-EsrB in E. piscicida. The virulence master regulator EsrB can modulate the expression of genes associated with various processes during infection. In particular, unknown signals from the intracellular environment trigger a phosphorylation relay from EsrA to EsrB, which then directly or indirectly activates T3SS, T6SS and cognate effector translocation into the host cells. EsrB-activated processes are depicted in red; those inhibited by EsrB are shown in blue.
The mapping of the regulatory logic of a regulator facilitates a mechanistic understanding of how it deploys within the regulatory architecture to permit a given signal input to result in a fine-tuned gene expression output. With the distinct EsrB binding motifs from esrC and esaM promoter and EsrB regulated genes available, we identified an 18-bp consensus motif to which EsrB binds directly. Interestingly, this consensus sequence is highly conserved in the previously established SsrB binding motifs of Salmonella enterica and Sodalis glossinidus Citation33; both of these species belong to a neighboring genus of Edwardsiella bacteria.Citation5 The 18-bp consensus motif also contains 7–4–7 architecture with ATCGGGT palindrome repeats and is similarly localized to the promoter region of T3SS genes, i.e., esrC, esaM, escC, and esaR, as well as the effector gene (ETAE_1586) ( and ). Elaborate mutation analysis has demonstrated that the architecture of the SsrB binding motif is flexible and that even a single dyad of the palindromic sequence can activate gene expression.Citation33 Future similar functional analysis of the EsrB binding motif will help map more binding sites across the genome and will specifically facilitate the identification of additional effector candidate genes. Mutational analysis will also illuminate the molecular basis and dependence of the interaction of EsrB with the cognate binding motifs.
Althogh TCS EsrA-EsrB behaves similarily as its counterpart SsrA-SsrB in Salmonella in regarding to regulation of the expression of T3SS genes and related effectors ( and ),Citation33 these 2 TCSs differ from each other. The genes esrA and esrB are divergently transcribed with their distinct promoters, while ssrA and ssrB share the same promoter (Fig. S6A).Citation5,Citation33 Meanwhile, there is no EsrC homolog in Salmonella. These variations suggest that these 2 TCSs might have their distinct expression and regulation paradigms. In Edwardsiella bacteria, EsrC is subjected to tight regulation of EsrA-EsrB (, Table S1), and facilitates the expression of T3SS and T6SS genes.Citation36 As an AraC-type regulator, EsrC could activate and repress gene expression depending on various conditions, Citation36 thus enabling the different regulatory roles for EsrB in Edwardsiella as compared with SsrB in Salmonella. Specifically, as the thorough search with FIMO didn't find an EsrB binding site in T6SS genes (data not shown), and could only identify several direct interactions of EsrB to T3SS genes (esrC, esaM, escC, and esaR) and one in effector gene (ETAE_1586) (), we thus hypothesize that EsrC shall play important roles in mediating EsrB regulation of T3SS and T6SS genes’ expression (), especially in the expression of T3SS effectors by binding directly to these genes in E. piscicida (), as documented in E. ictaluri and E. tarda.Citation35,Citation36,Citation37 Our data support the idea that the regulatory circuits of SsrB/EsrB family proteins have been well conserved during evolution ().Citation33 However, it will be intriguing to decipher further the DNA module that choreographs EsrB-mediated pathogenic behavior and physiologic adaptation in Edwardsiella infection.
Both DMEM and EsrB strongly induce the expression of the T3SS and T6SS genes ( and ). We thus anticipated that mining of the co-upregulated genes might lead to the identification of T3SS- or T6SS-dependent effectors. Indeed, the established TEM-1 translocation assay allowed us to identify 3 known effectors and 6 novel effectors among the 104 co-upregulated genes (). In many cases, type III secretion is activated upon host cell contact and depends on specific regulatory proteins.Citation52,Citation53 Furthermore, internalization of bacteria is required for the translocation of T6SS effectors into phagocytic cells.Citation54 These 2 mechanisms procedurally direct protein secretion and translocation, and more effectors are translocated into host cells after bacteria-host contact, thereby dictating the terms of bacterium-host cell interactions. Future work with different translocation systems, e.g., use of the cyaA fusion assay and cell line models, might permit the identification of additional effectors. Furthermore, the TEM-1 assay relies on β-lactamase, which is a relatively large tag that may not be compatible with T6SS, whereas T3SS can even translocate the notable effector EseJ (ETAE_0888), which may be as large as ∼150 kD, with high efficiency and at high translocation rates ( and Fig. S6B). This may underlie the finding that all the effectors identified in this study were T3SS-dependent. Furthermore, the bioinformatics analysis and the results of the gel shift assays suggested that EsrB might both directly (e.g., ETAE_1586) ( and ) and indirectly regulate the expression of these effector genes, which might also contribute to their different expression levels or translocation rates ( and Fig. S6B).
Phylogenomic investigation has established that Edwardsiella bacteria can be classified into at least 5 species that contain various sets of T3SS loci in their genomes; these species are E. ictaluri (1), E. piscicida (1), E. tarda (0), E. anguillarum (2), and E. hoshinae (0). In silico analysis indicated that all 9 putative T3SS effectors harbor domains that probably directly interact with the host (). Recently, Dubytska et al. identified 9 putative T3SS effectors using bioinformatics and a cyaA-based translocation assay.Citation55 Of these 9 effectors, 5 contain leucine-rich repeat protein (LRR) domains with various numbers of repeats. Interestingly, stringent BLASTP analysis indicated that, among the 9 effectors identified here, ETAE_3282 is not found in the published E. ictaluri genomes. At the same time, ETAE_3282, 1586 and 1757 (EseN) are not shared by E. anguillarum. All 9 putative effectors appeared to be absent from the genomes of E. hoshinae ATCC33379 and E. tarda ATCC15947 (Tables 1 and S2). Furthermore, of the reported list of 9 effectors in E. ictaluri, only EseG and EseN are shared by E. piscicida, and the remaining 7 effectors are absent in all the other species,Citation55 suggesting a specific basis for the evolution of pathogenic mechanisms and host specificity in the evolutionary history of these Edwardsiella species.
E. piscicida is able to evade host immune defenses and to proliferate in epithelial cells and phagocytes.Citation18,Citation38,Citation47 T3SS has been shown to be essential for the bacterium to colonize and cause disease in the hosts. Although all 9 of the identified effectors are highly induced in vivo in the host, we asked which effectors are potentially essential for the pathogenicity of the bacterium (, ). CI-seq experiments indicated that of the 9 effectors identified, only EseJ (ETAE_0888) is essential for bacterial colonization in fish (). A previous investigation indicated that EseJ plays multifaceted roles in E. piscicida by reducing bacterial adhesion to EPC cells and facilitating intracellular bacterial replication by inhibiting the host's ROS production.Citation30 However, given the marginal virulence attenuation observed (2.3-fold increase in LD50) when EseJ was deletedCitation30 along with the fact that no significant decrease in CI index was found for other strains, we speculated that redundant roles or pathways are targeted by the effectors. We might also speculate that these effectors seem not to be involved in the interaction of T3SS with other factors or in facilitating secretion caused by other effectors. The detailed molecular functions of ETAE_0888 and other effectors are currently under investigation.
It was intriguing to find that the strain with the deletion of the 9 effectors (9Δ) showed dramatic virulence attenuation, although residual virulence could be observed; high doses (> 107 CFU/fish) of 9Δ could cause fish death. This could be attributed to the presence of intact T6SS and to the translocation of other unknown effectors by functional T3SS. However, the finding that 9Δ could not propagate efficiently in fish, along with the potent protection it provided against WT challenge when inoculated into naïve fish at a low dose, demonstrated that systematic disruption of the effectors will be a valuable strategy for the construction of a highly efficient live attenuated vaccine for use in the aquaculture industry. This is reasonable, as in the host the T3SS translocation apparatus or its needle structure will be highly induced and assembled, and these structures have been demonstrated to represent important protective antigens that are recognized by host immune systems.Citation39,Citation56 Indeed, 9Δ seemed to be more immunogenic and triggered higher antibody titers and RPS than the ΔesrB stain and the ΔT3SS mutant, in which the T3SS translocation apparatus is abrogated ( and ).
In conclusion, our data provide a wealth of information regarding E. piscicida gene expression during infection, especially in macrophages. The data also provide clues about the environment this bacterium encounters within the host and the effectors that govern the bacterial response and its interaction with various host niches. Moreover, EsrA-EsrB, which governs global regulatory cycles, was confirmed to be essential for E. piscicida infection and colonization of the host. In addition to controlling genes involved in the physiologic response to the host environment, EsrB also controls the expression of T3SS of T6SS and that of a repertoire of T3SS-dependent effectors that are crucial for the bacterium's interaction with the host during the process of infection. The overview of the gene expression response to host environment stimuli and the dissection of global regulatory roles of EsrB facilitated the identification of a set of T3SS-dependent effectors, thereby advancing the study of the molecular basis of the bacterium's pathogenesis and disease control strategies. Finally, we anticipate that even greater understanding of the interplay between fish hosts and leading pathogens will be obtained by future RNA-seq-based analyses of the dynamic transcriptomes of both the pathogen and the host during infection progression.
Materials and methods
Bacterial growth and cell culture
The bacterial strains used in this study are listed in . Edwardsiella piscicida strains were grown overnight at 30°C in Tryptic Soy Broth (TSB), on tryptic soy agar (TSA), or on des-oxycholate hydrogen sulfide lactose (DHL) plates. Escherichia coli strains were cultured in Luria broth (LB) at 37°C. For the induction of T3SS and T6SS proteins, E. piscicida strains were statically grown in Dulbecco's Modified Eagle's Medium (DMEM) at 30°C. E. coli Top10F′, DH5α and CC118 λpir were used for plasmid harvest, and SM10 λpir was used for plasmid conjugation. When required, appropriate antibiotics were included in the medium at the following concentrations: 100 μg/ml carbenicillin, 10 μg/ml colistin, 12.5 μg/ml tetracycline, 34 μg/ml chloramphenicol, 25 μg/ml gentamicin, and 50 μg/ml kanamycin. HeLa cells (ATCC CCL−2) and J774A.1 cells (ATCC TIB-67) were cultured at 37°C in a 5% CO2 atmosphere in DMEM supplemented with 10% fetal bovine serum (FBS).
Table 2. Strains and plasmids used in this study.
Construction of deletion mutants
In-frame deletion mutants were generated by sacB-based allelic exchange as described previously.Citation57 Upstream and downstream fragments were generated by PCR using the primer pairs P1/P2 and P3/P4, respectively; the primer sequences are given in Table S3. Overlap PCR with primer pair P1/P4 was used to generate fragments with in-frame deletions. The resulting fragments were cloned into the sacB suicide vector pDMK after linearization of the vector with BglII/SphI and were transformed into CC118 λpir; clones were validated using the primer pair pDMK-PF/PR. After sequencing, the plasmids were transformed into sm10 λpir and then mated into EIB202 by conjugation. Double crossover processes were selected sequentially on TSA medium containing Col and Kan and then on TSA with 12% (v/v) sucrose to complete homologous recombination. The targeted mutants were confirmed by PCR and by sequencing of the region surrounding the deletion. The 9Δ strain was obtained by 8 additional runs of double crossover processes.
ECP preparation and western blotting
EIB202 was seeded into 50 ml of DMEM and cultured at 30°C for 24 h. EIB202 ΔP with pCX340 was subcultured in DMEM with tetracycline and induced with 0.4 mM isopropyl-β-D-thiogalactopyranoside (IPTG) before harvesting. After pelleting of the cells at 5000 rpm for 5 min, the cell-free supernatant containing added protease inhibitors was filtered through a 0.22-μm low-protein-binding Millex filter (Millipore) and then concentrated to 250 μl using a 10,000-molecular-weight-cutoff Amicon Ultra-15 centrifugal filter device (Millipore). The protein concentration of the supernatant was determined using a Bradford protein assay kit. For SDS-PAGE, 25 μl loading buffer was added to bacterial cell pellets that had been resuspended in phosphate-buffered saline (PBS) or concentrated supernatant, and the samples were boiled for 10 min. SDS-PAGE was used to compare the ECP profiles of EIB202 strains. For western blotting, SDS-PAGE-separated proteins were transferred to polyvinylidene difluoride (PVDF) membranes (Millipore). The membranes were blocked with 10% nonfat milk in PBS containing 0.05% Tween-20, incubated with a 1:2000 dilution of mouse monoclonal TEM-1 (ab12251 antibody, abcam) or RNAP (4RA2 antibody, Santa Cruz) antibodies, and then incubated with a 1:2000 dilution of anti-mouse peroxidase-conjugated IgG secondary antibodies (Sigma). Finally, the blots were visualized using ECL reagent (Thermo Fisher).
Total RNA extraction and mRNA enrichment
The WT strain and the ΔesrB mutant were cultured in LB and DMEM, respectively, at 30°C without shaking for 24 h. RNA samples were extracted using an RNA isolation kit (Tiangen). DNase I (Promega) and Ribo-Zero-rRNA removal kits for Gram-negative bacteria (Epicentre) were used to remove DNA and rRNA following the manufacturer's instructions. Prior to reverse transcription, regular PCR was routinely performed using the isolated RNA sample as a template to confirm that there was no DNA contamination. Samples used for RNA-seq were validated using an Agilent 2100 Bioanalyzer (Agilent Technologies), and the final concentration was measured using a Qubit 2.0 Fluorometer (Thermo Fisher).
RNA-seq transcriptome generation and data analysis
First-strand cDNA synthesis from rRNA-depleted samples was performed using TruSeq RNA sample Prep (Illumina). The cDNA was purified using the RNA Clean and Concentrator-25 kit (Zymo Research). Following second-strand synthesis, the reactions were cleaned up with AMPure XP beads followed by end repair, adenylation of 3’ ends and ligation of adapters. The reaction products were cleaned with AMPure XP beads and treated with uracil-N-glycosylase using the AmpErase kit (Applied Biosystems). Finally, PCR (10 cycles) was used to amplify the library and to enrich the fragments that were ligated to the sequencing adapters. Libraries were sequenced on the HiSeq 2000 platform to yield 100-base-pair end-reads. Adapter sequences and low-quality bases (PHRED quality scores ≤ 5) were trimmed by the Trimmomatic package using the default parameters, and truncated reads smaller than 35 bp were discarded.Citation58 Then, the BWA program Citation59 was used to align the remaining reads to the reference sequences of E. piscicida EIB202 (Chr, CP001135.1; plasmid, CP001136.1). The number of reads mapped to each gene was determined by Picard tools (http://broadinstitute.github.io/picard/faq.html) and normalized to the reads per kilobase of genic region per million mapped reads (RPKM) to obtain the relative level of expression. An analysis of variance was performed on the average expression of the 2 biologic replicates to identify genes that showed differential expression under 2 tested conditions (adjusted P < 0.05 and fourfold change). The differential expression analysis was performed using the DEGseq package.Citation44 The changes of interest were validated using qRT-PCR. The RNA-seq data sets have been deposited in the NCBI GenBank under accession number SRP077869.
Cloning, expression, and purification of EsrB
Full-length EsrB was amplified using the primer pair esrB-for/rev (Table S3) derived from EIB202 genomic DNA. The PCR product was subcloned into pET28a and then transformed into E. coli BL21 (DE3) cells for expression to generate EsrB. An overnight culture was inoculated into LB broth containing 50 μg/ml kanamycin and grown until the OD600 reached 1.2. Protein expression was induced with 0.5 mM isopropyl 1-thio-β-D-galactopyranoside, and the cells were grown at 25°C overnight. The cells were then harvested by centrifugation and resuspended in lysis buffer (20 mM HEPES, 20% (w/v) sucrose, 250 mM NaCl, 7.5 mM MgCl2·6H2O, 1 mM DTT, 10 mM imidazole, pH 7.0). The cell suspension was subjected to high pressure followed by centrifugation to obtain the soluble protein, which was applied to a nickel column (Biorad) and eluted with binding buffer (250 mM NaCl, 20 mM HEPES, 1 mM DTT, 5% (w/v) glycerol, pH 7.0) containing 300 mM imidazole. The eluted fractions were analyzed by 12% SDS-PAGE. Fractions containing EsrB were pooled and dialyzed against binding buffer without imidazole. Protein fractions were stored at -80°C after quick-freezing in liquid nitrogen.
Electrophoretic mobility shift and DNase I footprinting assays
For the electrophoretic mobility shift assays (EMSA), purified 6His-tagged EsrB was incubated with various Cy5-labeled DNA probes (Table S3) in a total volume of 20 μl (1 μl EsrB, 20 ng DNA probe, 250 ng poly (dI-dC), and 17.5 μl binding buffer). After the mixture was incubated at 25°C for 30 min, the samples were resolved by 6% polyacrylamide gel electrophoresis in 0.5 × TBE (Tris/boric acid/EDTA) buffer on ice at 100 V for 120 min. The gels were scanned using a Typhoon FLA 9500 (GE Healthcare).
Dye primer-based DNase I footprinting assays were performed as described previously.Citation60 Briefly, the promoter region was PCR amplified using pfu DNA polymerase and M13F-47 and M13R-48 primers, which carry 6-FAM at the 5’ end (Table S3). The FAM-labeled probes were purified using a Wizard SV Gel and PCR Clean-Up System (Promega) and quantified using a NanoDrop 2000C (Thermo Fisher). For each assay, 200 ng of the probes were incubated with different amounts of EsrB in a total volume of 20 μl. After the mixture was incubated for 30 min at 25°C, 5 μl of a solution containing 0.2 μl DNase I (Promega) and 2.5 μl of reaction buffer were added. The mixture was then incubated for 1 min at 25°C. The reaction was stopped by the addition of 5 μl DNase I stop solution. The samples were extracted with phenol/chloroform and precipitated with ethanol, and the pellets were dissolved in 10 μl of MiniQ water. Approximately 2 μl of digested DNA was added to 7.75 μl of HiDi formamide (Applied Biosystems) and 0.25 μl of GeneScan-500 LIZ size standards (Applied Biosystems). The samples were analyzed on a 3730 DNA Analyzer with a G5 dye set that was run on an altered default genotyping module that increased the injection time to 30 s and the injection voltage to 3 kV. The results were analyzed using GeneMarker 2.2.0 (SoftGenetics).
ChIP-qPCR
Five optical density units of bacterial genomic DNA (gDNA) were extracted using gDNA extraction columns according to the product manual (Tiangen). The gDNA was diluted in 100 µl MiniQ water to a final concentration of 100 ng/µl in a 0.5 ml tube. Sonication was performed in a Bioruptor machine (Diagenode) with 30 s ON/ 90 s OFF for 12 cycles. The sheared DNA length was in the range of 200–600 bp as shown by electrophoresis in a 2% agarose gel. The sheared DNA was used as the input sample in the following analysis. The binding reaction was performed in a total volume of 20 μl (test group: 1 μl EsrB, 1 µl sheared gDNA, 500 ng poly (dI-dC), 17 μl binding buffer; control group: 1 µl sheared gDNA, 500 ng poly (dI-dC), 18 μl binding buffer). After the mixture was incubated for 30 min at 25°C, 5 copies were merged to obtain one 100 μl sample, and 700 μl binding buffer containing 0.5% formaldehyde was mixed with each sample at room temperature for 10 min to perform cross-linking of protein-DNA complexes. The reaction was stopped by adding 200 μl of glycine buffer. The samples were then incubated with 50 μl Dynabeads® His-Tag (Thermo Fisher) for 1 h. The beads were washed twice with 1 ml of a low-salt wash buffer (1% Triton X-100, 1 mM EDTA pH 8.0, 150 mM NaCl and 10 mM Tris-HCl pH 8.0), twice with 1 ml of a high-salt wash buffer (1% Triton X-100, 1 mM EDTA pH 8.0, 500 mM NaCl and 10 mM Tris-HCl pH 8.0) and 4 times with TE buffer (1 mM EDTA pH 8.0 and 10 mM Tris-HCl pH 8.0). The beads were resuspended in 200 μl elution buffer (10 mM EDTA and 50 mM Tris-HCl pH 8.0), 8 μl of 5 M NaCl was added to each sample, and the tubes were incubated at 65°C overnight to reverse the DNA-protein crosslinking. The output DNA was extracted with phenol/chloroform and precipitated with ethanol, and the pellets were dissolved in 30 μl of MiniQ water.
The enriched DNA targets were amplified using qPCR with the primers listed in Table S3 and calculated using the following ΔΔCT method. For each DNA target, ΔCT of the input fraction and output fraction was calculated in both the test and control groups. Each value was then divided by the corresponding ΔCT that was obtained for the nonspecific gyrB intragenic region. The enrichment ratio was calculated from the ΔΔCT value of the test group divided by that of the control group. FIMO (http://meme-suite.org/tools/fimo) was used to search similar sequences from genes regulated by EsrB based on RNA-seq.
Construction of TEM-1 fusions
The pCX340 plasmid was digested with NdeI/KpnI or NdeI/EcoRI (NEB) at 37°C for 1 h for linearization. PCR amplification with the primers listed in Table S3 was performed to obtain each candidate effector's ORF fragments from the EIB202 genome. Overlap PCR was performed to eliminate restriction sites without amino acid changes if the ORFs contained an NdeI restriction site or any 2 or all of the 3 restriction sites. The products were ligated with pMD19-T using solution I (TaKaRa) and transformed into Top10F’. After sequencing with M13-F/R, the plasmids were digested with NdeI/KpnI or NdeI/EcoRI, ligated with linearized pCX340 and transformed into DH5a. Clones were validated using the primer pair pCX340-F/R. The resulting plasmids were transformed into EIB202 ΔP, ΔT3SS and ΔT6SS by electroporation (2000 V, 3 ms). The expression of TEM-1 fusions was validated by western blotting with anti-β lactamase antibody (abcam).
Translocation assay
Vectors expressing 67 E. piscicida candidate proteins fused to TEM-1 were transformed into WT and T3SS and T6SS mutant strains by electroporation. To evaluate the translocation of TEM-1 fusions, β-lactamase activity in infected HeLa cells was measured as described previously with minor modifications.Citation29 HeLa cells were seeded into wells of a 24-well glass-bottom black plate at 1.5 × 10⁵ cells per well in DMEM with 10% fetal bovine serum (FBS) for 18 h at 35°C in a 5% CO2 incubator. Bacteria were inoculated into TSB, supplemented with tetracycline, and grown at 35°C without shaking the night before infection. The HeLa cells were washed once with DMEM, and bacteria were applied to the HeLa cells at a multiplicity of infection (MOI) of 100 in DMEM without serum. Three hours later, the HeLa cell monolayers were washed 3 times with pre-warmed DMEM, and the infection was allowed to proceed for an additional 4 h in DMEM. The HeLa cells were washed once with DMEM and loaded with the fluorescent substrate CCF2/AM (LiveBLAzer-FRET B/G Loading Kit, Invitrogen). The cells were incubated in the dark for 2 h at 35°C and then observed under a Nikon A1R confocal microscope. Blue cells (TEM-1-positive) and total cells in different foci were counted to determine the proportion of blue cells (PBC). In addition, the infection process was performed as above for the single-time-point translation (STPT) assay. Immediately after addition of the CCF2/AM substrate solution, the plates were placed in a plate reader (Spectramax m5e, Molecular Devices) set at 35°C. The cells were excited at 409 nm, and emission at 465 nm and 525 nm was recorded as cleaved (blue) and uncleaved (green) fluorescence at 20-min intervals.
Preparation of macrophage-released E. piscicida
Macrophage-released E. piscicida were prepared as described previously.Citation47 WT and ΔesrB were grown overnight in TSB at 30°C with shaking and then diluted into fresh TSB with shaking at 30°C until the optical density at 600 nm reached 0.8. Suspensions of harvested bacteria in PBS were added to macrophage cells at a MOI of 10:1. The plates were then centrifuged at 600 g for 10 min. After 8 h infection, the supernatant was centrifuged at 600 g for 5 min to remove cellular debris, and the harvested supernatant was further centrifuged at 13,000 g for 10 min to collect the macrophage-released bacteria.
Quantitative real-time PCR (qRT-PCR)
One microgram of RNA was used as a template for first-strand cDNA synthesis with the PrimeScript reverse transcriptase (Takara). qRT-PCR analysis was performed in a total volume of 20 μl containing 1 μl of diluted cDNA, 1 μl of each primer (10 mM stock, Table S3), 10 μl of FastStart Universal SYBR Green Master and 7 μl deionized water. qRT-PCR was performed with the 7500 RealTime PCR System (Applied Biosystems) under the following conditions: 95°C for 10 min and 40 cycles at 95°C for 15 s and 60°C for 1 min. Melting curve analysis of the amplification products was performed at the end of each PCR to confirm that only one PCR product had been amplified. Relative quantification was performed using the comparative CT (2−ΔΔCT) method,Citation61 with the housekeeping gyrB gene as an internal standard.
Turbot maintenance, LD50 assay, infection dynamics, immunization and challenge
Turbot maintenance, immunization and challenge were performed as described previously.Citation38,Citation57 Healthy turbot weighing 30 ± 3 g were acclimatized in an aerated tank for at least 2 weeks with a continuous flow of sand-filtered seawater at 14 ∼16°C. For characterization of in vivo expression of the putative effectors, 40 fish were intraperitoneal (i.p.) challenged with 100 μl WT or ΔesrB suspension (106 CFU/ml). At 3 and 7 d after injection (DPI), the livers of 5 fish from each group were aseptically collected, and RNA samples were obtained from liver using an RNA isolation kit (Tiangen). For the investigation of LD50 values, 160 fish were infected intramuscularly (i.m.) with 4 dilutions of bacterial suspensions of WT, ΔesrB, ΔT3SS or 9Δ respectively, 10 fish i.m. injected with PBS were included as control. The mortality rates were recorded over a period of 3 weeks after infection. The LD50 values were calculated by the method described by Fernández et al.Citation62 For the investigation of infection kinetics, suspensions of each strain were spectrophotometrically adjusted to OD600 as 1. The fish in the treatment group (∼35 turbot for each strain) were challenged by i.m. injection of 100 μl of bacterial suspension (106 CFU/ml), while the control group containing 35 turbot received 100 μl PBS per fish. Three fish from each group were sampled at 0, 1, 3, 5, 7, 10, 14, 18, 22 and 28 DPI. Liver, spleen, kidney and intestine were aseptically sampled and weighed to normalize the samples. Then, the organs were digested with trypsin and homogenized in 500 μl PBS. The homogenates were serially diluted and plated in triplicate on DHL plates containing Col or Amp; the plates were incubated at 30°C for 48 h. The colonies that displayed black centers were counted. For immunization and challenge, healthy turbots were randomly grouped with 120 fish per group. The fish were inoculated by i.p. injection with 106 CFU of ΔesrB, ΔT3SS or 9Δ respectively in 0.1 ml PBS or with 0.1 ml PBS as control and kept in 100 L tanks supplied with aerated sand-filtered seawater at 16°C. At 35 d post-inoculation, serum samples were collected from each group, and the fish were evenly sub-grouped into 30 fish per container and i.m. challenged with wild-type EIB202 at a dose of 4 × 10³ CFU/fish (approx. 2 × LD50) in 0.1 ml of PBS.Citation57 Relative percent survival (RPS) was calculated according to the following formula: RPS = (1- % mortality of immunized fish/% mortality of PBS mock-immunized fish) × 100%. All turbot experiments were conducted at the aquaculture station in Yantai, Shandong Province, China, according to protocols approved by the Animal Care Committee of the East China University of Science and Technology (2006272). The Experimental Animal Care and Use Guidelines of the Ministry of Science and Technology of China (MOST-2011–02) were followed.
Competitive index sequencing (CI-seq)
CI-seq was performed in turbot via sequence tag–based analysis.Citation63 WT E. piscicida and 13 mutants (ΔesrB, ΔT3SS, ΔT6SS, Δ0866, Δ0888, Δ1586, Δ1604, Δ1757, Δ2186, Δ2188, Δ2438, Δ3282 and 9Δ) were tagged with 4 (for WT) or 2 distinct 16-bp barcodes, respectively, at a neutral chromosome site between ETAE_3536 (glms) and ETAE_3537. Briefly, pNQ705G was digested with SacI/XbaI. The glms fragments (500 bp) were PCR-amplified using the primer pair GLMS_F/R (Table S3), digested with SacI/XbaI and ligated with linearized pNQ705G. The resulting plasmids were transformed into WT E. piscicida or mutants by conjugation. Cultures of bacteria were equivalently mixed after determination of OD600, the genomic DNA of bacterial mixtures was extracted as input, and 50 turbots were then infected i.p. with 100 μl of bacterial suspension containing 1 × 10⁵ mixed bacteria. The livers, spleens and kidneys of 5 fish were respectively pooled at 3 and 7 DPI and homogenized in 1 ml of PBS. The homogenates were plated on LB agar plates supplemented with Col and Gm and incubated at 30°C for 24 h. Genomic DNA of the bacteria washed out from the plates was extracted as output. A total of 20 mg genomic DNA was sheared into 200 - 800 bp fragments in a Bioruptor (Diagenode) set at 30 s ON/ 90 s OFF for 12 cycles. Libraries were constructed using the VAHTS Turbo DNA library preparation kit (Vazyme) and sequenced on an Illumina MiSeq platform. The reads were processed and mapped to the barcode sequences that represented each strain. The number of mutant output reads was normalized according to the following formula: Normalized mutant output reads (NMO) = mutant output reads (MO) × average WT input reads (AWI) / average mutant input reads (AMI).
Enzyme-linked immunosorbent assay (ELISA)
ELISA was performed as described previously.Citation64 Sera were collected from the infected fish at 5 weeks post-vaccination. The serum was diluted 20-fold in PBS and used for ELISA. Microtiter plate wells were coated with 100 μl of killed bacteria by overnight incubation at 4°C. Excess cells were discarded, and the wells were blocked with 100 ml of PBS containing 2% bovine serum albumin (BSA) for 3 h at 22°C. After removing the blocking solution and washing 3 times with PBS containing 0.05% Tween-20 (PBST), 100 ml of serially diluted turbot serum was placed in each well for 3 h at 22°C. The plates were washed and incubated with 100 ml of mouse anti-turbot IgM monoclonal antibody (Aquatic Diagnostic) for 1 h, washed 3 times, and further incubated with 100 ml of goat anti-mouse IgG-HRP (Tiangen) (1:1000) for 1 h at 22°C. Finally, the wells were washed 3 times, and TMB solution (Tiangen) was added as a color-developing substrate. After the addition of 2 M H2SO4 to terminate the reaction, the absorbance at 450 nm was recorded using a Spectramax plate reader (Molecular Devices).
Disclosure of potential conflicts of interest
No potential conflicts of interest were disclosed.
KVIR_S_1323157.zip
Download Zip (1.6 MB)Funding
This work was supported by National Natural Science Foundation of China under grant number 31430090 and 31400122; the Ministry of Agriculture of China under grant number CARS-50 and nyhyzx-201303047; and the Shanghai Pujiang Program under grant number 16PJD018. K.Y.L was supported by Natural Sciences and Engineering Research Council of Canada (NSERC) Discovery Grant (372373–2010) and X.H.Z was supported by NIH R01AI118943
References
- Stock AM, Robinson VL, Goudreau PN. Two-component signal transduction. Annu Rev Biochem 2000; 69:183-215; PMID:10966457; https://doi.org/10.1146/annurev.biochem.69.1.183
- Mitrophanov AY, Groisman EA. Signal integration in bacterial two-component regulatory systems. Genes Dev 2008; 22(19):2601-11; PMID:18832064; https://doi.org/10.1101/gad.1700308
- Li L, Wang Q, Zhang H, Yang M, Khan MI, Zhou X. Sensor histidine kinase is a beta-lactam receptor and induces resistance to beta-lactam antibiotics. Proc Natl Acad Sci U S A 2016; 113(6):1648-53; PMID:26831117; https://doi.org/10.1073/pnas.1520300113
- Rasko DA, Moreira CG, Li DR, Reading NC, Ritchie JM, Waldor MK, Williams N, Taussig R, Wei S, Roth M. Targeting QseC signaling and virulence for antibiotic development. Science 2008; 321(5892):1078-80; PMID:18719281; https://doi.org/10.1126/science.1160354
- Wang Q, Yang M, Xiao J, Wu H, Wang X, Lv Y, Xu L, Zheng H, Wang S, Zhao G. Genome sequence of the versatile fish pathogen Edwardsiella tarda provides insights into its adaptation to broad host ranges and intracellular niches. PLoS One 2009; 4(10):e7646; PMID:19865481; https://doi.org/10.1371/journal.pone.0007646
- Yang M, Lv Y, Xiao J, Wu H, Zheng H, Liu Q, Zhang Y, Wang Q. Edwardsiella comparative phylogenomics reveal the new intra/inter-species taxonomic relationships, virulence evolution and niche adaptation mechanisms. PLoS One 2012; 7(5):e36987; PMID:22590641; https://doi.org/10.1371/journal.pone.0036987
- Abayneh T, Colquhoun DJ, Sorum H. Edwardsiella piscicida sp. nov., a novel species pathogenic to fish. J Appl Microbiol 2013; 114(3):644-54; PMID:23167785; https://doi.org/10.1111/jam.12080
- Shao S, Lai Q, Liu Q, Wu H, Xiao J, Shao Z, Wang Q, Zhang Y. Phylogenomics characterization of a highly virulent Edwardsiella strain ET080813(T) encoding two distinct T3SS and three T6SS gene clusters: Propose a novel species as Edwardsiella anguillarum sp. nov. Syst Appl Microbiol 2015; 38(1):36-47; PMID:25466920; https://doi.org/10.1016/j.syapm.2014.10.008
- Janda JM, Abbott SL. Infections associated with the genus Edwardsiella: the role of Edwardsiella tarda in human disease. Clin Infect Dis 1993; 17(4):742-8; PMID:8268359; https://doi.org/10.1093/clinids/17.4.742
- Thune RL, Stanley LA, Cooper RK. Pathogenesis of gram-negative bacterial infections in warmwater fish. Ann Rev Fish Dis 1993; 3:37-68; https://doi.org/10.1016/0959-8030(93)90028-A
- Leung KY, Siame BA, Tenkink BJ, Noort RJ, Mok YK. Edwardsiella tarda - virulence mechanisms of an emerging gastroenteritis pathogen. Microbes Infect 2012; 14(1):26-34; PMID:21924375; https://doi.org/10.1016/j.micinf.2011.08.005
- Park SB, Aoki T, Jung TS. Pathogenesis of and strategies for preventing Edwardsiella tarda infection in fish. Vet Res 2012; 43(1):67; PMID:23035843; https://doi.org/10.1186/1297-9716-43-67
- Sakai T, Kanai K, Osatomi K, Yoshikoshi K. Identification of a 19.3-kDa protein in MRHA-positive Edwardsiella tarda: putative fimbrial major subunit. FEMS Microbiol Lett 2003; 226(1):127-33; PMID:13129618; https://doi.org/10.1016/S0378-1097(03)00608-6
- Sakai T, Matsuyama T, Sano M, Iida T. Identification of novel putative virulence factors, adhesin AIDA and type VI secretion system, in atypical strains of fish pathogenic Edwardsiella tarda by genomic subtractive hybridization. Microbiol Immunol 2009; 53(3):131-9; PMID:19302523; https://doi.org/10.1111/j.1348-0421.2009.00108.x
- Hu YH, Sun L. The global regulatory effect of Edwardsiella tarda Fur on iron acquisition, stress resistance, and host infection: A proteomics-based interpretation. J Proteomics 2016; 140:100-10; PMID:27102497; https://doi.org/10.1016/j.jprot.2016.04.005
- Wang X, Wang Q, Xiao J, Liu Q, Wu H, Zhang Y. Hemolysin EthA in Edwardsiella tarda is essential for fish invasion in vivo and in vitro and regulated by two-component system EsrA-EsrB and nucleoid protein HhaEt. Fish Shellfish Immunol 2010; 29(6):1082-91; PMID:20832475; https://doi.org/10.1016/j.fsi.2010.08.025
- Srinivasa RP, Lim TM, Leung KY. Functional genomics approach to the identification of virulence genes involved in Edwardsiella tarda pathogenesis. Infect Immun 2003; 71(3):1343-51; PMID:12595451; https://doi.org/10.1128/IAI.71.3.1343-1351.2003
- Wang X, Wang Q, Xiao J, Liu Q, Wu H, Xu L, Zhang Y. Edwardsiella tarda T6SS component evpP is regulated by esrB and iron, and plays essential roles in the invasion of fish. Fish Shellfish Immunol 2009; 27(3):469-77; PMID:19563898; https://doi.org/10.1016/j.fsi.2009.06.013
- Jiao XD, Zhang M, Cheng S, Sun L. Analysis of Edwardsiella tarda DegP, a serine protease and a protective immunogen. Fish Shellfish Immunol 2010; 28(4):672-7; PMID:20060910; https://doi.org/10.1016/j.fsi.2010.01.004
- Lv Y, Yin K, Shao S, Wang Q, Zhang Y. Comparative proteomic analysis reveals new components of the PhoP regulon and highlights a role for PhoP in the regulation of genes encoding the F1F0 ATP synthase in Edwardsiella tarda. Microbiology 2013; 159(7):1340-51; PMID:23657683; https://doi.org/10.1099/mic.0.066803-0
- Zhou ZJ, Sun BG, Sun L. Edwardsiella tarda Sip1: A serum-induced zinc metalloprotease that is essential to serum resistance and host infection. Vet Microbiol 2015; 177(3-4):332-40; PMID:25899393; https://doi.org/10.1016/j.vetmic.2015.03.030
- Tan YP, Zheng J, Tung SL, Rosenshine I, Leung KY. Role of type III secretion in Edwardsiella tarda virulence. Microbiology 2005; 151(7):2301-13; PMID:16000720; https://doi.org/10.1099/mic.0.28005-0
- Okuda J, Kiriyama M, Suzaki E, Kataoka K, Nishibuchi M, Nakai T. Characterization of proteins secreted from a type III secretion system of Edwardsiella tarda and their roles in macrophage infection. Dis Aquat Organ 2009; 84(2):115-21; PMID:19476281; https://doi.org/10.3354/dao02033
- Hou M, Chen R, Yang D, Nunez G, Wang Z, Wang Q, Zhang Y, Liu Q. Identification and functional characterization of EseH, a new effector of the type III secretion system of Edwardsiella piscicida. Cell Microbiol 2017;19(1): e12638; https://doi.org/10.1111/cmi.12638
- Strauss EJ, Ghori N, Falkow S. An Edwardsiella tarda strain containing a mutation in a gene with homology to shlB and hpmB is defective for entry into epithelial cells in culture. Infect Immun 1997; 65(9):3924-32; PMID:9284172
- Zheng J, Leung KY. Dissection of a type VI secretion system in Edwardsiella tarda. Mol Microbiol 2007; 66(5):1192-206; PMID:17986187; https://doi.org/10.1111/j.1365-2958.2007.05993.x
- Xie HX, Lu JF, Rolhion N, Holden DW, Nie P, Zhou Y, Yu XJ. Edwardsiella tarda-induced cytotoxicity depends on its type III secretion system and flagellin. Infect Immun 2014; 82(8):3436-45; PMID:24891103; https://doi.org/10.1128/IAI.01065-13
- Fang S, Zhang L, Lou Y, Yang D, Wang Q, Zhang Y, Liu Q. Intracellular translocation and localization of Edwardsiella tarda type III secretion system effector EseG in host cells. Microb Pathog 2016; 97:166-71; PMID:27208750; https://doi.org/10.1016/j.micpath.2016.05.008
- Xie HX, Yu HB, Zheng J, Nie P, Foster LJ, Mok YK, Finlay BB, Leung KY. EseG, an effector of the type III secretion system of Edwardsiella tarda, triggers microtubule destabilization. Infect Immun 2010; 78(12):5011-21; PMID:20855515; https://doi.org/10.1128/IAI.00152-10
- Xie HX, Lu JF, Zhou Y, Yi J, Yu XJ, Leung KY, Nie P. Identification and functional characterization of the novel Edwardsiella tarda effector EseJ. Infect Immun 2015; 83(4):1650-60; PMID:25667268; https://doi.org/10.1128/IAI.02566-14
- Lv Y, Xiao J, Liu Q, Wu H, Zhang Y, Wang Q. Systematic mutation analysis of two-component signal transduction systems reveals EsrA-EsrB and PhoP-PhoQ as the major virulence regulators in Edwardsiella tarda. Vet Microbiol 2012; 157(1-2):190-9; PMID:22227416; https://doi.org/10.1016/j.vetmic.2011.12.018
- Brown NF, Rogers LD, Sanderson KL, Gouw JW, Hartland EL, Foster LJ. A horizontally acquired transcription factor coordinates Salmonella adaptations to host microenvironments. mBio 2014; 5(5):e1714-27; https://doi.org/10.1128/mBio.01727-14
- Tomljenovic-Berube AM, Mulder DT, Whiteside MD, Brinkman FS, Coombes BK. Identification of the regulatory logic controlling Salmonella pathoadaptation by the SsrA-SsrB two-component system. PLoS Genet 2010; 6(3):e1000875; PMID:20300643; https://doi.org/10.1371/journal.pgen.1000875
- Desai SK, Winardhi RS, Periasamy S, Dykas MM, Jie Y, Kenney LJ. The horizontally-acquired response regulator SsrB drives a Salmonella lifestyle switch by relieving biofilm silencing. Elife 2016; 5: e10747; PMID:26880544; https://doi.org/10.7554/eLife.10747
- Rogge ML, Thune RL. Regulation of the Edwardsiella ictaluri type III secretion system by pH and phosphate concentration through EsrA, EsrB, and EsrC. Appl Environ Microbiol 2011; 77(13):4293-302; PMID:21551284; https://doi.org/10.1128/AEM.00195-11
- Zheng J, Tung SL, Leung KY. Regulation of a type III and a putative secretion system in Edwardsiella tarda by EsrC is under the control of a two-component system, EsrA-EsrB. Infect Immun 2005; 73(7):4127-37; PMID:15972502; https://doi.org/10.1128/IAI.73.7.4127-4137.2005
- Chakraborty S, Sivaraman J, Leung KY, Mok YK. Two-component PhoB-PhoR regulatory system and ferric uptake regulator sense phosphate and iron to control virulence genes in type III and VI secretion systems of Edwardsiella tarda. J Biol Chem 2011; 286(45):39417-30; PMID:21953460; https://doi.org/10.1074/jbc.M111.295188
- Yang W, Wang L, Zhang L, Qu J, Wang Q, Zhang Y. An invasive and low virulent Edwardsiella tarda esrB mutant promising as live attenuated vaccine in aquaculture. Appl Microbiol Biotechnol 2015; 99(4):1765-77; PMID:25431010; https://doi.org/10.1007/s00253-014-6214-5
- Lan MZ, Peng X, Xiang MY, Xia ZY, Bo W, Jie L, Li XY, Jun ZP. Construction and characterization of a live, attenuated esrB mutant of Edwardsiella tarda and its potential as a vaccine against the haemorrhagic septicaemia in turbot, Scophthamus maximus (L.). Fish Shellfish Immunol 2007; 23(3):521-30; PMID:17478097; https://doi.org/10.1016/j.fsi.2006.11.002
- Gao ZP, Nie P, Lu JF, Liu LY, Xiao TY, Liu W, Liu JS, Xie HX. Type III secretion system translocon component EseB forms filaments on and mediates autoaggregation of and biofilm formation by Edwardsiella tarda. Appl Environ Microbiol 2015; 81(17):6078-87; PMID:26116669; https://doi.org/10.1128/AEM.01254-15
- Rao PS, Yamada Y, Tan YP, Leung KY. Use of proteomics to identify novel virulence determinants that are required for Edwardsiella tarda pathogenesis. Mol Microbiol 2004; 53(2):573-86; PMID:15228535; https://doi.org/10.1111/j.1365-2958.2004.04123.x
- Nydam SD, Shah DH, Call DR. Transcriptome analysis of Vibrio parahaemolyticus in type III secretion system 1 inducing conditions. Front Cell Infect Microbiol 2014; 4:1; PMID:24478989; https://doi.org/10.3389/fcimb.2014.00001
- Aguilera L, Ferreira E, Gimenez R, Fernandez FJ, Taules M, Aguilar J, Vega MC, Badia J, Baldoma L. Secretion of the housekeeping protein glyceraldehyde-3-phosphate dehydrogenase by the LEE-encoded type III secretion system in enteropathogenic Escherichia coli. Int J Biochem Cell Biol 2012; 44(6):955-62; PMID:22433988; https://doi.org/10.1016/j.biocel.2012.03.002
- Anders S, Huber W. Differential expression analysis for sequence count data. Genome Biol 2010; 11(10):R106; PMID:20979621; https://doi.org/10.1186/gb-2010-11-10-r106
- Hirono I, Tange N, Aoki T. Iron-regulated haemolysin gene from Edwardsiella tarda. Mol Microbiol 1997; 24(4):851-6; PMID:9194711; https://doi.org/10.1046/j.1365-2958.1997.3971760.x
- Santander J, Golden G, Wanda SY, Curtiss RR. Fur-regulated iron uptake system of Edwardsiella ictaluri and its influence on pathogenesis and immunogenicity in the catfish host. Infect Immun 2012; 80(8):2689-703; PMID:22615248; https://doi.org/10.1128/IAI.00013-12
- Zhang L, Ni C, Xu W, Dai T, Yang D, Wang Q, Zhang Y, Liu Q. Intramacrophage infection reinforces the virulence of Edwardsiella tarda. J Bacteriol 2016; 198(10):1534-42; PMID:26953340; https://doi.org/10.1128/JB.00978-15
- Charpentier X, Oswald E. Identification of the secretion and translocation domain of the enteropathogenic and enterohemorrhagic Escherichia coli effector Cif, using TEM-1 beta-lactamase as a new fluorescence-based reporter. J Bacteriol 2004; 186(16):5486-95; PMID:15292151; https://doi.org/10.1128/JB.186.16.5486-5495.2004
- Shneider MM, Buth SA, Ho BT, Basler M, Mekalanos JJ, Leiman PG. PAAR-repeat proteins sharpen and diversify the type VI secretion system spike. Nature 2013; 500(7462):350-3; PMID:23925114; https://doi.org/10.1038/nature12453
- Wang X, Wang Q, Yang M, Xiao J, Liu Q, Wu H, Zhang Y. QseBC controls flagellar motility, fimbrial hemagglutination and intracellular virulence in fish pathogen Edwardsiella tarda. Fish Shellfish Immunol 2011; 30(3):944-53; PMID:21288493; https://doi.org/10.1016/j.fsi.2011.01.019
- Yin K, Wang Q, Xiao J, Zhang Y. Comparative proteomic analysis unravels a role for EsrB in the regulation of reactive oxygen species stress responses in Edwardsiella piscicida. FEMS Microbiol Lett 2016; 364(1):fnw269; PMID:27915248; https://doi.org/10.1093/femsle/fnw269
- Mota LJ, Cornelis GR. The bacterial injection kit: type III secretion systems. Ann Med 2005; 37(4):234-49; PMID:16019722; https://doi.org/10.1080/07853890510037329
- Coburn B, Sekirov I, Finlay BB. Type III secretion systems and disease. Clin Microbiol Rev 2007; 20(4):535-49; PMID:17934073; https://doi.org/10.1128/CMR.00013-07
- Ma AT, McAuley S, Pukatzki S, Mekalanos JJ. Translocation of a Vibrio cholerae type VI secretion effector requires bacterial endocytosis by host cells. Cell Host Microbe 2009; 5(3):234-43; PMID:19286133; https://doi.org/10.1016/j.chom.2009.02.005
- Dubytska LP, Rogge ML, Thune RL. Identification and characterization of putative translocated effector proteins of the Edwardsiella ictaluri type III secretion system. mSphere 2016; 1(3):e00039-16; PMID:27303737; https://doi.org/10.1128/mSphere.00039-16
- Wang B, Mo ZL, Xiao P, Li J, Zou YX, Hao B, Li GY. EseD, a putative T3SS translocon component of Edwardsiella tarda, contributes to virulence in fish and is a candidate for vaccine development. Mar Biotechnol 2010; 12(6):678-85; PMID:20072793; https://doi.org/10.1007/s10126-009-9255-5
- Xiao J, Wang Q, Liu Q, Xu L, Wang X, Wu H, Zhang Y. Characterization of Edwardsiella tarda rpoS: effect on serum resistance, chondroitinase activity, biofilm formation, and autoinducer synthetases expression. Appl Microbiol Biotechnol 2009; 83(1):151-60; PMID:19283379; https://doi.org/10.1007/s00253-009-1924-9
- Bolger AM, Lohse M, Usadel B. Trimmomatic: a flexible trimmer for Illumina sequence data. Bioinformatics 2014; 30(15):2114-20; PMID:24695404; https://doi.org/10.1093/bioinformatics/btu170
- Li H, Durbin R. Fast and accurate short read alignment with Burrows-Wheeler transform. Bioinformatics 2009; 25(14):1754-60; PMID:19451168; https://doi.org/10.1093/bioinformatics/btp324
- Gu D, Guo M, Yang M, Zhang Y, Zhou X, Wang Q. A sigmaE-mediated temperature gauge controls a switch from LuxR-mediated virulence gene expression to thermal stress adaptation in Vibrio alginolyticus. PLoS Pathog 2016; 12(6):e1005645; PMID:27253371; https://doi.org/10.1371/journal.ppat.1005645
- Livak KJ, Schmittgen TD. Analysis of relative gene expression data using real-time quantitative PCR and the 2(-Delta Delta C(T)) Method. Methods 2001; 25(4):402-8; PMID:11846609; https://doi.org/10.1006/meth.2001.1262
- Fernandez AI, Perez MJ, Rodriguez LA, Nieto TP. Surface phenotypic characteristics and virulence of Spanish isolates of Aeromonas salmonicida after passage through fish. Appl Environ Microbiol 1995; 61(5):2010-12; PMID:7646039
- Abel S, Abel ZWP, Chang HH, Davis BM, Lipsitch M, Waldor MK. Sequence tag-based analysis of microbial population dynamics. Nat Methods 2015; 12(3):223-6, 3-226; PMID:25599549; https://doi.org/10.1038/nmeth.3253
- Xiao J, Chen T, Liu B, Yang W, Wang Q, Qu J, Zhang Y. Edwardsiella tarda mutant disrupted in type III secretion system and chorismic acid synthesis and cured of a plasmid as a live attenuated vaccine in turbot. Fish Shellfish Immunol 2013; 35(3):632-41; PMID:23732848; https://doi.org/10.1016/j.fsi.2013.05.022
- Xiao J, Wang Q, Liu Q, Wang X, Liu H, Zhang Y. Isolation and identification of fish pathogen Edwardsiella tarda from mariculture in China. Aquac Res 2008; 40(1):13-7; https://doi.org/10.1111/j.1365-2109.2008.02101.x
- Dennis JJ, Zylstra GJ. Plasposons: modular self-cloning minitransposon derivatives for rapid genetic analysis of gram-negative bacterial genomes. Appl Environ Microbiol 1998; 64(7):2710-5; PMID:9647854
- Liang W, Wang S, Yu F, Zhang L, Qi G, Liu Y, Gao S, Kan B. Construction and evaluation of a safe, live, oral Vibrio cholerae vaccine candidate, IEM108. Infect Immun 2003; 71(10):5498-504; PMID:14500467; https://doi.org/10.1128/IAI.71.10.5498-5504.2003
- Milton DL, Norqvist A, Wolf-Watz H. Cloning of a metalloprotease gene involved in the virulence mechanism of Vibrio anguillarum. J Bacteriol 1992: 174(22):7235-44; PMID:1429449; https://doi.org/10.1128/jb.174.22.7235-7244.1992
- Wang SY, Lauritz J, Jass J, Milton DL. A ToxR homolog from Vibrio anguillarum serotype O1 regulates its own production, bile resistance, and biofilm formation. J Bacteriol 2002; 184(6):1630-9; PMID:11872714; https://doi.org/10.1128/JB.184.6.1630-1639.2002