
ABSTRACT
White nose syndrome (WNS) is caused by the psychrophilic fungus Pseudogymnoascus destructans that can grow in the environment saprotrophically or parasitically by infecting hibernating bats. Infections are pathological in many species of North American bats, disrupting hibernation and causing mortality. To determine what fungal pathways are involved in infection of living tissue, we examined fungal gene expression using RNA-Seq. We compared P. destructans gene expression when grown in culture to that during infection of a North American bat species, Myotis lucifugus, that shows high WNS mortality. Cultured P. destructans was grown at 10 to 14 C and P. destructans growing in vivo was presumably exposed to temperatures ranging from 4 to 8 C during torpor and up to 37 C during periodic arousals. We found that when P. destructans is causing WNS, the most significant differentially expressed genes were involved in heat shock responses, cell wall remodeling, and micronutrient acquisition. These results indicate that this fungal pathogen responds to host-pathogen interactions by regulating gene expression in ways that may contribute to evasion of host responses. Alterations in fungal cell wall structures could allow P. destructans to avoid detection by host pattern recognition receptors and antibody responses. This study has also identified several fungal pathways upregulated during WNS infection that may be candidates for mitigating infection pathology. By identifying host-specific pathogen responses, these observations have important implications for host-pathogen evolutionary relationships in WNS and other fungal diseases.
Introduction
Fungal pathogens have emerged as major threats to biodiversityCitation1 and human health.Citation2 The diversity of these infectious eukaryotes and their hosts present new challenges in characterizing the interactions between host, pathogen, and the environment that lead to pathogenesis. One successful approach is to use systems biology to compare whole-transcriptome changes in gene expression between the pathogen infecting the host, the host without the pathogen, and the pathogen without the host.Citation3-5 This dual RNA-Seq approach can be used to identify genetic factors from the pathogen that contribute to host colonization and manipulation of host-pathogen interactions.
Among fungal emerging infectious diseases, white-nose syndrome (WNS) in bats has spread from Eurasia, where it is endemic, to North America,Citation6-8 where it is decimating several species of hibernating bats. Susceptible species, such as the little brown myotis (Myotis lucifugus) have shown population declines up to 90% in affected hibernacula.Citation9-11 WNS is caused by Pseudogymnoascus destructans, a psychrophilic fungus that grows in cold hibernacula and causes cutaneous infections in bats while they hibernate. During WNS, P. destructans invades the skin tissue, forming subcutaneous lesions identified as cupping erosions by histopathology.Citation12 The infection disrupts the hibernation behavior of susceptible bats and leads to more frequent arousals from torpor, premature energy depletion, electrolyte imbalance, and death.Citation13-16
WNS does not affect all species of bats equally. Many, but not all, North American species are being severely affected,Citation17,18 while most European bats can host P. destructans infections, but have low mortality from WNS.Citation19-22 Coevolution of P. destructans and Eurasian bats, such as Daubenton's myotis (M. daubentonii), appears to have adapted these populations to a commensal or parasitic relationship with lower pathology.Citation8 North American bats, on the other hand, have yet to benefit from such selection against extirpation of the host speciesCitation23 and some species face the possibility of regional extinctions.Citation10,18,24 The virulence of the P. destructans infection is controlled by a combination of the environment (i.e., temperature and humidity of the hibernaculum), the host (and the host's response to infection), and the pathogen (and the pathogen's response to the host).Citation25 In this study, we focus on the third component of this epidemiological triangle by dissecting the genetic components that allow P. destructans to infect hosts and become a virulent pathogen.
Whether P. destructans remains a commensal parasite or becomes pathogenic is determined by host-pathogen interactions.Citation8,26 We have previously examined the host response of the WNS-susceptible M. lucifugus to P. destructans infection in the wing membrane and found robust gene expression changes in the host during hibernation.Citation27 We now shift our focus to characterize previously hypothesized virulence attributes of the fungus that include immune evasion, nutrient acquisition, stress responses, and tissue invasion.Citation28,29 We measured P. destructans gene expression at the whole-transcriptome level, comparing expression patterns between the fungus when growing in culture and when infecting a North American bat species.
Results
Two different groups of samples were used to measure gene expression in P. destructans for this study (). Gene expression during infection of M. lucifugus was measured in the MyLu samples of wing tissue from 6 individual P. destructans- infected M. lucifugus collected 60–120 minutes after arousal from hibernation in caves in Kentucky, USA. Gene expression in P. destructans during infection was compared with 4 samples from the 20631–21 strain of P. destructans growing in culture at 10–14°C for 23 d on Sabouraud dextrose agar plates ().
Table 1. RNA-Seq data sets used for analysis and RSEM expected counts
Comparison of infected and uninfected bats
Prior to comparing the expression of P. destructans genes during host infection to those in culture, we confirmed that infection levels in host tissues were sufficient to measure pathogen gene expression by quantifying the number of RNA-Seq reads that mapped to the P. destructans transcriptome (Table S1). Compared to a group of samples from M. lucifugus not infected with P. destructans (Figure S1), the samples from the infected bats from Kentucky showed significantly higher levels of P. destructans transcripts (t = 8.84, p < 0.00001). In the wing samples from infected bats, we found that 5990 ± 324 P. destructans genes were expressed at a minimum count of 1, representing 63% of all P. destructans genes (Table S1). These samples expressed 13 512 ± 357 M. lucifugus genes, representing 52% of all bat genes. Using a minimum of 1 count in any sample, the cultured samples expressed 8825 genes and the wing samples expressed 7264 genes of 9575 known P. destructans genes (Table S1). These results indicate that sufficient read depth was obtained in this data set to measure P. destructans gene expression, at least for the majority of genes.
Comparison of P. destructans gene expression during WNS and culture
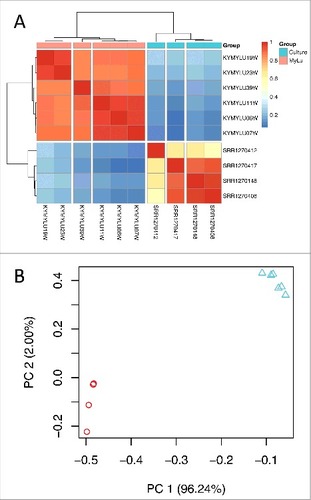
Using both hierarchical clustering () and principal component analysis (), we found that the patterns of P. destructans gene expression were similar in each group of samples (cultured or WNS). We observed a small batch effect between the cultured samples that were grown at different times and sequenced differently (). We also found that samples from bats KY19 and KY23, which came from a different cave in the same county as bats KY06, KY07, and KY11,Citation27 clustered separately from these samples and from sample KY39, which came from a different county. These results suggest that some of the differences in gene expression that we observe within the 2 groups could be due to variations in the environmental conditions or genetic differences between the P. destructans isolated growing in different hibernacula. However, the largest differences appear to be due to the different growth conditions between culture and growth on bats.
Figure 1. Gene expression of P. destructans in culture and when infecting M. lucifugus. (a) Hierarchical clustering of differentially expressed P. destructans trimmed mean of M-values (TMM)-normalized gene expression levels using Pearson correlation complete-linkage clustering with Euclidean distances. Scale shows Pearson correlation coefficient. Vertical breaks in the heatmap indicate clustering supported by bootstrap analysis at a confidence of 99% and the horizontal break indicates separate clustering of the different groups of samples. (b) Principal component analysis of global P. destructans gene expression using log2-transformed TMM-normalized expression levels. The principal components PC1 and PC2 represent 96% and 2% of the variance in the data, respectively. Triangles represent the MyLu samples and circles represent the culture samples
We then compared P. destructans gene expression during WNS infection of M. lucifugus to the 20631–21 strain of P. destructans grown in culture using both edgeR (, , ) and DESeq2 (). Because of the lower depth of sequencing for the WNS samples, we then filtered the results to exclude any P. destructans genes that were not expressed in at least 2 of the 6 MyLu samples. With a cutoff of 0.001 for FDR and a 2-fold minimum change, similar results were obtained using these 2 different analysis methods (), with the majority of the genes identified as differentially expressed by edgeR also being identified by DESeq2.
Figure 2. Expression levels of differentially expressed P. destructans genes. Heatmaps show the expression level in counts per million (CPM) of (a) the 94 P. destructans genes upregulated in the MyLu samples compared with the Culture samples or (b) the 117 genes upregulated in the Culture samples compared with the MyLu samples. Genes were identified as differentially expressed (FDR < 0.001) by both edgeR and DESeq2 and expressed (CPM > 0) in at least 2 of the MyLu samples. The scale is log10 CPM with a maximum of 4.5 (a) or 4.1 (b)
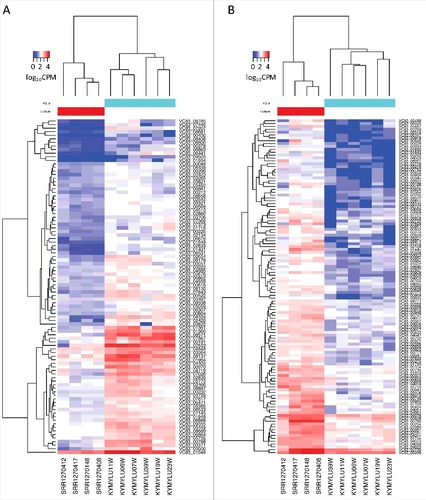
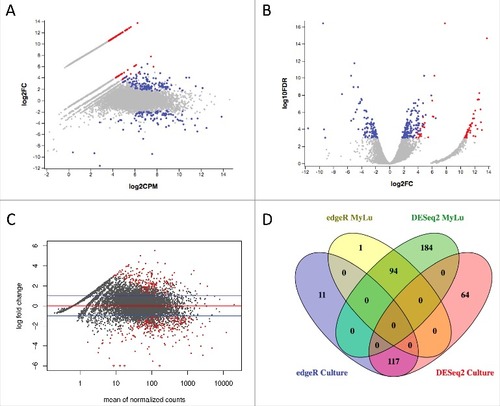
Figure 3. Differential P. destructans gene expression in culture and when infecting M. lucifugus. (a) Expression of P. destructans genes is compared by edgeR between culture and M. lucifugus infection with an MA plot. The mean expression level (log2 counts per million (CPM)) and the fold change (log2 FC) are shown for each gene. Genes more highly expressed in culture are on the upper half of the graph and those more highly expressed in M. lucifugus tissue in the lower half. Blue points indicate differential expression (FDR ≤ 0.001 determined by edgeR) that are expressed in at least 2 MyLu samples. Red points indicate significant differential expression for genes that were not expressed in at least 2 MyLu samples. An interactive version of this graph is available as Data Set S2. After unzipping File S2 and opening the html file in a web browser, hover over each point to view the annotation metadata for that gene and the expression level (in log2CPM) for each sample. Individual genes can be found by searching, for example by entering VC83_01361 in the search box. (b) Expression of P. destructans genes is compared by edgeR between culture and M. lucifugus infection with a volcano plot. The fold change (log2) and the FDR (log10) are shown for each gene. Genes more highly expressed in culture are on the right half of the graph and those more highly expressed in M. lucifugus tissue in the left half. Blue points indicate differential expression (FDR ≤ 0.001 determined by edgeR), with colors as for (a). An interactive version of this graph is available as Data Set S3 and can be manipulated as described above. (c) Expression of P. destructans genes is compared by DESeq2 between culture and M. lucifugus infection with an MA plot. The mean expression level and the fold change (log2) are shown for each gene. The red line indicates equal expression and the blue line indicate a 2-fold change. Genes more highly expressed in culture are on the upper half of the graph and those more highly expressed in M. lucifugus tissue in the lower half. Red points indicate differential expression (FDR ≤ 0.001 determined by DESeq2). (d) A Venn diagram compares the number of P. destructans genes identified as differentially expressed by edgeR and DESeq2. The number of genes shared by edgeR and DESeq2, or unique to each method, are shown using a maximum FDR of 0.001 and minimum fold change of 2 for genes upregulated in M. lucifugus infections or upregulated in culture after removing genes not expressed in at least 2 of the MyLu samples. Table S2 lists results for all P. destructans genes
Using the subset of genes identified by both edgeR and DESeq2, 94 P. destructans genes were identified as more highly expressed during WNS infection of M. lucifugus, and 117 genes were more highly expressed in P. destructans growing in culture (, Table S2). Using our Trinotate annotation, we identified 39 genes that showed significant changes in expression during WNS whose putative functions could contribute to virulence by affecting tissue invasion, the heat shock response, nutrient acquisition, immune evasion, and other pathways ().
Table 2. Selected P. destructans genes differentially expressed between culture and WNS-affected M. lucifugus that have putative functions implicated in fungal virulence
We specifically examined the expression levels of secreted proteases, because they have been implicated in the pathogenesis of WNS.Citation30,31 Protease genes were identified by homology and by PFAM analysisCitation32 and the expression of these genes was compared in the 5 culture samples and 6 M. lucifugus WNS samples (Table S2). lists selected protease genes and demonstrates that the genes for subtilase-family proteases are more highly expressed during culture than during tissue invasion. Other proteases are highly expressed during host infection, such as VC83_01361, the P. destructans homolog of the Aspergillus fumigatus major allergen Aspf2, show lower gene expression when P. destructans is growing in culture.
Table 3. Expression of selected P. destructans protease genes
To further explore the functional pathways that regulate infection, gene ontology enrichment analysis was performed using the genes identified by edgeR at a maximum FDR of 0.05 and minimum fold-change of 2. We examined the annotated functions of P. destructans genes upregulated in either M. lucifugus infections or in culture (). This analysis determined that several pathways involved in peptide and nitrogen metabolism are significantly enriched in P. destructans during infection (FDR < 0.05). While growing in culture, P. destructans showed enrichment of oxidation-reduction and transport pathways (FDR < 0.001) and depletion of other metabolic pathways (FDR < 0.05).
Table 4. Gene ontology analysis of P. destructans pathways altered during WNS
Discussion
We determined how parasitism affects the expression patterns of P. destructans genes by comparing expression levels between the fungus in culture and during host infection. We used dual RNA-Seq data and an approach that simultaneously mapped the reads to both host and pathogen transcriptomes followed by the removal of reads that mapped to host transcripts. This approach allowed for the estimation of expression levels of P. destructans genes with high levels of confidence by using RSEM to control for the uncertainty of multi-mapped reads. We compared gene expression changes of the cultured 20631–21 North American strain of P. destructans to infection of a naïve North American species. Although the data set had limited read depth for P. destructans genes in the M. lucifugus samples, we observed significant differential gene expression in 211 genes, or 2.2% of the 9575 known P. destructans genes. This initial study has validated this approach to identifying changing patterns of pathogen gene expression. Future studies will be needed to overcome some of the limitations of the currently available data sets by using greater read depth for the dual RNA-Seq data, better matching environmental conditions in vitro to those in hibernacula, and using the identical isolate of P. destructans for both data sets. Future work could also compare changes in P. destructans gene expression during infection of North American or European bat species that show more resistance to WNS mortality than M. lucifugus.Citation8,19,20,33,34
As expected, we found that the transition from abiotic to parasitic growth was accompanied by many changes in P. destructans gene expression. Differences in temperature and humidity could also contribute to the differences in gene expression that we observed. Some of the gene expression changes are also presumably due to alterations in nutrient availability, such as the increased expression of lipase (VC83_00616) in vivo due to the high lipid content of mammalian skin. Although the cultured P. destructans was not grown on the same substrate that it would find in the environment, many of the gene expression changes that we observed appear consistent with adaptation to the host environment, rather than changes due to nutrient sources. For example, the increased expression of heat shock genes is consistent with the response to arousal from torpor to euthermic body temperatures that occurred 60 to 120 minutes before collecting the M. lucifugus samples.Citation27 Correspondingly, a single sample from a bat that was allowed to become euthermic only briefly did not show upregulation of P. destructans heat shock genes (unpublished results). Thermal stress caused by a febrile response in the human host has been shown to activate a heat shock response in Candida albicans, preventing deleterious protein unfolding and aggregation.Citation35 This heat shock response could be important for fungal survival in our system, as bats arouse to euthermic temperatures several times throughout hibernation (thus several times throughout P. destructans infection), and susceptible populations arouse from torpor more frequently during WNS.Citation13,14,36
Consistent with a response of the pathogen to evade host immune recognition, we also found large increases and decreases in expression of genes involved in fungal cell wall structures (). The fungal cell wall is composed of an inner layer of chitin, a middle layer of β-glucans, and an outer layer of mannose. The cell wall provides rigidity and structure, however is also highly dynamic. The pattern recognition receptor Dectin-1 has been shown to be a receptor for fungal 1,3-β glucans and 1,6-β glucans,Citation37,38 thus cell wall components serve to alert the mammalian immune system of a fungal pathogen. We have observed that Dectin-1 and several other C-type lectin domain family members are significantly upregulated in bat tissues infected with P. destructans.Citation27 Consistent with this host observation, we detected significant alterations in P. destructans enzymes predicted to be involved in fungal cell wall remodeling (). VC83_00788 and VC83_04729, homologs of Endochitinase 1, an enzyme which randomly cleaves and breaks down chitin, are upregulated 11.6 and 6.3-fold, respectively, while VC83_05104, a homolog of Chitin synthase 4 is downregulated 3.4-fold in P. destructans during infection compared with culture. Two homologs to Glucan endo-1,3-β glucosidases were differentially regulated; VC83_07327 was upregulated in P. destructans during infection while VC83_09076 was upregulated during culture. These enzymes presumably regulate cell wall β-glycan turnover and catabolism of β-glycansCitation39 by removal of non-reducing terminal glucosyl residues from saccharides and glycosides.
Additionally, 3 Mannan endo-1,6-α mannosidases that were differentially expressed between P. destructans actively infecting a host and growing in culture (). Two were upregulated in culture (VC83_00261 and VC83_01650), and one was upregulated during WNS (VC83_07145). Mannan endo-1,6-α mannosidases are required for normal synthesis of the cell wall and alkaline pH-induced hypha formation, as well as being responsible for random hydrolysis of α-mannosidic linkages in unbranched mannans.Citation40 It is likely that the changes in Glucan endo-1,3-β glucosidase and Mannan endo-1,6-α mannosidase gene expression that we observed upon the switch from abiotic growth to host colonization leads to substantial alterations in the cell wall structures. The resulting differences in saccharide and glycoside branching patterns in the cell wall could make the pathogen less recognizable to the mammalian immune system.
Alternatively, these changes in cell wall enzyme gene expression could be due to changes in metabolic pathways that accompany the shift from abiotic to infectious niches. Different carbon sources can modulate cell wall structure and virulence in C. albicans.Citation41,42 It is possible that changes in cell wall structures are caused by differences in metabolism when infecting bats, rather than direct adaptation to the host.
Alterations in cell wall structures also accompany shifts in the morphological growth type of fungi, such as a shift from yeast to hyphal phase in C. albicans.Citation37 However, P. destructans grows vegetatively as hyphae on both Sabouraud's dextrose agar medium in culture,Citation43,44 and when forming cupping erosions in the wing tissue of the host.Citation12,19 Thus there is no difference in morphotype between our cultured and WNS P. destructans samples that might explain the dramatic alterations in expression of cell wall remodeling enzymes that we observed. Consequently, we propose that changes in the β−glucan landscape on the fungal surface via cell wall remodeling are a mechanism of immune evasion for P. destructans, similar to other fungal pathogens.Citation45
Alterations of the cell wall during infection could explain the ineffectiveness of antibodies that recognize the cell wall of cultured P. destructans in providing protection from WNS.Citation46,47 These results may also explain why immunization with either cultured P. destructans or a β-glucan vaccineCitation48 did not affect the susceptibility of M. lucifugus to WNS (J. Johnson, J. McMichael, D. Reeder, and K. Field, unpublished). The antigens provided by these immunizations may not be present on the surface of P. destructans during infection because of changes in the cell wall structure that accompany the transition from abiotic to parasitic growth.
Because tissue invasion is a hallmark characteristic of P. destructans infections during WNS, we expected that expression of genes involved in degradation of the extracellular matrix would be upregulated. Unexpectedly, we found that the previously characterized subtilase-family of secreted proteasesCitation30,31 showed lower expression in P. destructans during infection than in culture. Instead, the homolog of the A. fumigatus vacuolar protease, major allergen Aspf2, showed high levels of expression during infection of M. lucifugus and was significantly upregulated compared with culture conditions. This suggests that other proteases may be better targets for preventing colonization than the subtilase-family proteases, although the possible role of Aspf2 in tissue invasion remains unknown. It is also plausible that subtilase-family proteases are regulated at a post-transcriptional level or are used by the fungus primarily during initial colonization. Therefore, further proteomic and expression time-course experiments may prove useful to further dissect the infection. Nevertheless, the abundant expression of Aspf2, known to be an A. fumigatus allergen in humans,Citation49 suggests that further investigation of IgE-mediated allergic reactions during WNS may be warranted.
Infection of hosts was also associated with changes in expression for several genes involved in the transport or homeostasis of metal ions, including zinc, iron, and copper. This fungal response may be due to limited availability of some of these micronutrients in the host, which is likely sequestering metal ions as a form of nutritional immunity.Citation27,50 Changes in micronutrient acquisition gene expression appear to be associated with host colonization, including increased expression of the zinc transporter Zrt1, the copper homeostasis factor ATX1, and a putative copper transporter, as well as the unexpected loss of siderophore import using MirB.Citation51 Homeostasis of these micronutrients is essential for normal fungal metabolism and for the ability of the pathogen to respond to the oxidative stress activated by the host immune response.Citation50 However, our gene ontology analysis () indicates that genes involved in oxidation-reduction pathways are more highly expressed during growth in culture than host colonization. Enrichment of pathways involving peptide metabolism and translation in P. destructans infecting bats () indicates that host colonization demands higher levels of protein expression than abiotic growth. Competition between the host and pathogen for micronutrients and the generation of oxidative stress likely varies over the course of infectionCitation52 and further study is needed to dissect this time course.
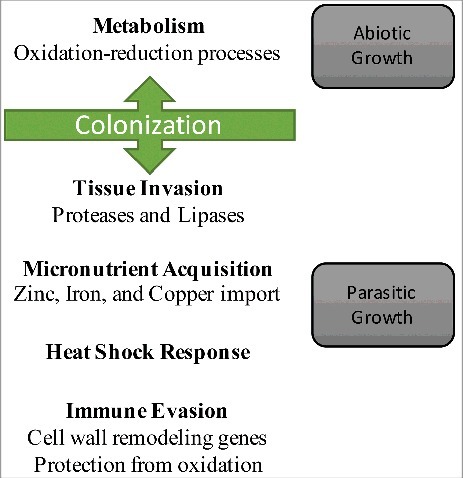
Together, these results provide a model of gene expression changes in P. destructans that accompany the transitions from abiotic to parasitic growth (). This model provides a framework to understand how the pathogen responds with phenotypic plasticity to the environment and its host to adopt a virulent phenotype. Our results also suggest approaches to minimize virulence and/or colonization by targeting immune evasion, micronutrient acquisition, tissue invasion, or the heat shock response. Efforts to understand why some species are more susceptible to WNS than others will require further examination of host-pathogen interactions to determine if the pathogen responds differently in hosts that exhibit lower WNS susceptibility.
Figure 4. Model of the P. destructans gene expression changes that accompany WNS. Gene expression changes by P. destructans are compared for abiotic and parasitic growth. The changes in gene expression that we found are associated with these phases are indicated
Materials and methods
Sample collection
Two different data sets were used for this study (). The samples for the first data set (MyLu) consisted of wing tissue from 6 individual P. destructans- infected M. lucifugus (little brown myotis) collected 60–120 minutes after arousal to euthermy from hibernation from caves in Kentucky, USA, as described previously.Citation27 Hibernacula temperatures were 4–6 C at the time of collection and, based on our previous experience, we estimate that skin temperature varied between 4 and 8 C during torpor and up to 37 C during periodic arousals. The second data set was obtained from the North American 20631–21 strain of P. destructans growing in culture by D. Akiyoshi and A. Robbins (Department of Infectious Disease and Global Health, Cummings School of Veterinary Medicine, Tufts University). The 20631–21 strain of P. destructans was obtained from D. Blehert (National Wildlife Health Center, US. Geological Survey, Madison, WI, USA). The fungus was grown in culture at 10–14°C for 23 d on Sabouraud dextrose agar plates (BD Diagnostics, #221180) (). Sabouraud dextrose agar contains nutrient sources of dextrose, pancreatic digest of casein, and peptic digest of animal tissue. RNA was isolated using a Qiagen RNeasy Lipid Tissue Kit after disruption of the cells using Zymos BashingBead Lysis Tubes and a bead beater on maximum speed for 30 sec for 3 times and then 20 sec once, with cooling on ice between each.
RNA sequencing
RNA sequencing was performed using Illumina sequencing as summarized in . Prior to analysis all data sets were quality trimmed using Trimmomatic v.0.35Citation53 with the parameters SLIDINGWINDOW:4:5 LEADING:5 TRAILING:5 MINLEN:25. For samples with paired-end sequencing, only reads with both pairs remaining after trimming were used for further analysis. Analysis of the reads using FastQC v0.11.5Citation54 and the results of STAR mapping indicate that there are no significant differences in the quality of the RNA in any of the cultured samples from the MyLu samples.
Differential expression analysis
The quality trimmed reads were aligned using STAR v.2.5.1bCitation55 to the concatenated genomes of M. lucifugus and P. destructans. For M. lucifugus, we used genome assembly Myoluc2.0 and gene models from Ensembl release 84.Citation56 For P. destructans, we used the genome assembly and gene models from Drees et al..Citation57 RSEM v1.2.2958 was then used to apply an expectation maximization algorithm to predict gene expression counts for each transcript. The expected count matrix for all samples is available in Data Set S1. To determine if the number of reads mapped to P. destructans transcripts provided sufficient statistical power to detect differential expression of these genes, we used ScottyCitation59 to analyze the expected counts generated by RSEM. We determined that 65% of P. destructans genes expressed at a minimum of 4-fold change could be detected with a p-value cutoff of 0.05. Transcripts per million (TPM) was calculated by normalizing read counts for the length of each transcript and adjusting for the library size of mapped reads for each sample.Citation58 The M. lucifugus transcripts were then removed from the analysis and differential expression was determined using only P. destructans transcripts.
Differential expression between conditions was determined using either DESeq2 v1.10.1Citation60 or edgeR v.3.12.1Citation61 after normalizing across samples using the trimmed mean of M-values (TMM) methodCitation62 and a minimum expression level of 2 TPM combined across all samples. False discovery rate (FDR) was used to control for multiple comparisons using the Benjamini-Hochberg procedure.Citation63 Hierarchical clustering was performed using R stats package v3.3.1 with Pearson correlation complete-linkage clustering of Euclidean distances. Clustering was confirmed by bootstrap analysis using pvclust v2.0–0Citation64 at an α level of 99% and 100 000 iterations. Genes without expression (expected count < 1) in at least 2 MyLu samples were excluded from the final analysis. Annotations for each gene were determined by using Trinotate v3.0, NCBI BLAST v2.2.29+Citation65 with the UniProtKB/SwissProt database (E-value cutoff of 1 × 10⁻⁴), and InterProScan v.5.20–59.0.Citation66 Gene ontology annotations were extracted from the InterProScan results and gene ontology enrichment analysis was performed using GOATOOLS v0.6.9Citation67 with enrichment or purification measured by Fisher's exact test after FDR correction.
Disclosure of potential conflicts of interest
No potential conflicts of interest were disclosed.
1342910_supp.zip
Download Zip (7.1 MB)Acknowledgments
We are grateful to Hilary Morrison (Marine Biological Laboratory, Woods Hole, Massachusetts), Donna Akiyoshi (Tufts University, North Grafton, Massachusetts), and Alison Robbins (Tufts University) for depositing RNA-Seq data sets into the Sequence Read Archive and for helpful comments. We thank Natália Martínková and Jiří C Moravec, Institute of Vertebrate Biology, Academy of Sciences of the Czech Republic, Brno, Czech Republic for valuable discussions of this manuscript. We also thank the following for assistance in collecting samples that were used in this study: Joseph Johnson at Ohio University, Athens, Ohio; Shayne Lumadue at Bucknell University; and Donna Akiyoshi and Alison Robbins at Tufts University.
Funding
This work was supported by the United States Fish and Wildlife Service grant F14AP00739 to DMR and KAF, and the Svenska Kulturfonden to TML. JM Palmer was funded by the US Forest Service (Northern Research Station).
Related Research Data
References
- Fisher MC, Henk DA, Briggs CJ, Brownstein JS, Madoff LC, McCraw SL, Gurr SJ. Emerging fungal threats to animal, plant and ecosystem health. Nature 2012; 484(7393):186-94; PMID:22498624; https://doi.org/https://doi.org/10.1038/nature10947
- Nucci M, Marr KA. Emerging fungal diseases. Clin Infect Dis 2005; 41(4):521-6; PMID:16028162; https://doi.org/https://doi.org/10.1086/432060
- Enguita F, Costa M, Fusco-Almeida A, Mendes-Giannini M, Leitão A. Transcriptomic Crosstalk between Fungal Invasive Pathogens and Their Host Cells: Opportunities and Challenges for Next-Generation Sequencing Methods. J Fungi 2016; 2(1):7; https://doi.org/https://doi.org/10.3390/jof2010007
- Schulze S, Schleicher J, Guthke R, Linde J. How to Predict Molecular Interactions between Species? Front Microbiol 2016; 7(March):1-13.
- Westermann AJ, Gorski SA, Vogel J. Dual RNA-seq of pathogen and host. Nature Rev Microbiol 2012; 10(9):618-30; PMID:22890146; https://doi.org/https://doi.org/10.1038/nrmicro2852
- Blehert DS, Hicks AC, Behr M, Meteyer CU, Berlowski-Zier BM, Buckles EL, Coleman JT, Darling SR, Gargas A, Niver R, et al. Bat white-nose syndrome: an emerging fungal pathogen? Science 2009; 323(5911):227.
- Leopardi S, Blake D, Puechmaille SJ. White-nose syndrome fungus introduced from Europe to North America. Curr Biol 2015; 25(6):R217-19; PMID:25784035; https://doi.org/https://doi.org/10.1016/j.cub.2015.01.047
- Zukal J, Bandouchova H, Brichta J, Cmokova A, Jaron KS, Kolarik M, Kovacova V, Kubátová A, Nováková A, Orlov O, et al. White-nose syndrome without borders: Pseudogymnoascus destructans infection tolerated in Europe and Palearctic Asia but not in North America. Sci Rep 2016; 6(January):19829; PMID:26821755; https://doi.org/https://doi.org/10.1038/srep19829
- Frick WF, Puechmaille SJ, Hoyt JR, Nickel BA, Langwig KE, Foster JT, Barlow KE, Bartonička T, Feller D, Haarsma A-J, et al. Disease alters macroecological patterns of North American bats. Global Ecology and Biogeography 2015; 24(7):741-9; https://doi.org/https://doi.org/10.1111/geb.12290
- Langwig KE, Frick WF, Bried JT, Hicks AC, Kunz TH, Marm Kilpatrick A. Sociality, density-dependence and microclimates determine the persistence of populations suffering from a novel fungal disease, white-nose syndrome. Ecol Lett 2012; 15(9):1050-57; PMID:22747672; https://doi.org/https://doi.org/10.1111/j.1461-0248.2012.01829.x
- Turner GG, Reeder D, Coleman JTH. A Five-year Assessment of Mortality and Geographic Spread of White-Nose Syndrome in North American Bats, with a look to the future. Update of White-Nose Syndrome in bats. Bat Res News 2011; 52(2):13-27.
- Meteyer CU, Buckles EL, Blehert DS, Hicks AC, Green DE, Shearn-Bochsler V, Thomas NJ, Gargas A, Behr MJ. Histopathologic criteria to confirm white-nose syndrome in bats. J Vet Diagn Invest 2009; 21(4):411-4; PMID:19564488; https://doi.org/https://doi.org/10.1177/104063870902100401
- Reeder DM, Frank CL, Turner GG, Meteyer CU, Kurta A, Britzke ER, Vodzak ME, Darling SR, Stihler CW, Hicks AC, et al. Frequent arousal from hibernation linked to severity of infection and mortality in bats with white-nose syndrome. PLoS ONE 2012; 7(6):e38920; PMID:22745688; https://doi.org/https://doi.org/10.1371/journal.pone.0038920
- Warnecke L, Turner JM, Bollinger TK, Misra V, Cryan PM, Blehert DS, Wibbelt G, Willis CKR. Pathophysiology of white-nose syndrome in bats: a mechanistic model linking wing damage to mortality. Biol Lett 2013; 9:20130177; PMID:23720520; https://doi.org/https://doi.org/10.1098/rsbl.2013.0177
- Cryan PM, Meteyer CU, Blehert DS, Lorch JM, Reeder DM, Turner GG, Webb J, Behr M, Verant M, Russell RE, et al. Electrolyte depletion in white-nose syndrome bats. J Wildl Dis 2013; 49(2):398-402; PMID:23568916; https://doi.org/https://doi.org/10.7589/2012-04-121
- Verant ML, Meteyer CU, Speakman JR, Cryan PM, Lorch JM, Blehert DS. White-nose syndrome initiates a cascade of physiologic disturbances in the hibernating bat host. BMC Physiol 2014; 14(1):10; PMID:25487871; https://doi.org/https://doi.org/10.1186/s12899-014-0010-4
- Langwig KE, Frick WF, Reynolds R, Parise KL, Drees KP, Hoyt JR, Cheng TL, Kunz TH, Foster JT, Kilpatrick AM. Host and pathogen ecology drive the seasonal dynamics of a fungal disease, white-nose syndrome. Proceedings of the Royal Society B. 2015; 282(1799):20142335; PMID:25473016; https://doi.org/https://doi.org/10.1098/rspb.2014.2335
- Hoyt JR, Langwig KE, Sun K, Lu G, Parise KL, Jiang T, Frick WF, Foster JT, Feng J, Kilpatrick AM. Host persistence or extinction from emerging infectious disease: insights from white-nose syndrome in endemic and invading regions. Proceedings of the Royal Society B: Biological Sciences 2016; 283(1826):20152861; https://doi.org/https://doi.org/10.1098/rspb.2015.2861
- Wibbelt G, Puechmaille SJ, Ohlendorf B, Mühldorfer K, Bosch T, Görföl T, Passior K, Kurth A, Lacremans D, Forget F. Skin Lesions in European Hibernating Bats Associated with Geomyces destructans, the Etiologic Agent of White-Nose Syndrome. PLoS ONE 2013; 8(9):e74105; PMID:24023927; https://doi.org/https://doi.org/10.1371/journal.pone.0074105
- Zukal J, Bandouchova H, Bartonicka T, Berkova H, Brack V, Brichta J, Dolinay M, Jaron KS, Kovacova V, Kovarik M, et al. White-nose syndrome fungus: A generalist pathogen of hibernating bats. PLoS ONE 2014; 9(5):e97224; https://doi.org/https://doi.org/10.1371/journal.pone.0097224
- Pikula J, Bandouchova H, Novotný L, Meteyer CU, Zukal J, Irwin NR, Zima J, Martínková N. Histopathology confirms white-nose syndrome in bats in Europe. J Wildl Dis 2012; 48(1):207-11; PMID:22247393; https://doi.org/https://doi.org/10.7589/0090-3558-48.1.207
- Van der Meij T, Van Strien AJ, Haysom KA, Dekker J, Russ J, Biala K, Bihari Z, Jansen E, Langton S, Kurali A, et al. Return of the bats? A prototype indicator of trends in European bat populations in underground hibernacula. Mammalian Biology 2015; 80(3):170-7; https://doi.org/https://doi.org/10.1016/j.mambio.2014.09.004
- Paterson S, Vogwill T, Buckling A, Benmayor R, Spiers AJ, Thomson NR, Quail M, Smith F, Walker D, Libberton B, et al. Antagonistic coevolution accelerates molecular evolution. Nature 2010; 464(7286):275-8; PMID:20182425; https://doi.org/https://doi.org/10.1038/nature08798
- Thogmartin WE, Sanders-Reed CA, Szymanski JA, McKann PC, Pruitt L, King RA, Runge MC, Russell RE. White-nose syndrome is likely to extirpate the endangered Indiana bat over large parts of its range. Biological Conservation 2013; 160:162-72; https://doi.org/https://doi.org/10.1016/j.biocon.2013.01.010
- Stevens RB. Cultural Practices in Disease Control. In: Horsfall J, Dimond A, editors. Plant pathology, an advanced treatise, Vol. 3. New York, NY, USA: Academic Press; 1960. p. 357-429.
- Casadevall A, Pirofski L. Host-pathogen interactions: the attributes of virulence. J Infect Dis 2001; 184(3):337-44; PMID:11443560; https://doi.org/https://doi.org/10.1086/322044
- Field KAKA, Johnson JS, Lilley TMTM, Reeder SMSM, Rogers EJEJ, Behr MJMJ, Reeder DMDM. The White-Nose Syndrome Transcriptome: Activation of Anti-fungal Host Responses in Wing Tissue of Hibernating Little Brown Myotis. PLoS Pathogens 2015; 11(10):1-29; https://doi.org/https://doi.org/10.1371/journal.ppat.1005168
- Whittington A, Gow NAR, Hube B. From Commensal to Pathogen: Candida albicans. In: Kurzai O, editor. Human Fungal Pathogens. 2nd ed. Berlin Heidelberg; 2014. p. 3-18.
- Brunke S, Mogavero S, Kasper L, Hube B. Virulence factors in fungal pathogens of man. Curr Opin Microbiol 2016; 32:89-95; PMID:27257746; https://doi.org/https://doi.org/10.1016/j.mib.2016.05.010
- Pannkuk EL, Risch TS, Savary BJ. Isolation and identification of an extracellular subtilisin-like serine protease secreted by the Bat Pathogen Pseudogymnoascus destructans. PLoS ONE. 2015; 10(3):e0120508; PMID:25785714; https://doi.org/https://doi.org/10.1371/journal.pone.0120508
- O'Donoghue AJ, Knudsen GM, Beekman C, Perry J a, Johnson AD, DeRisi JL, Craik CS, Bennett RJ. Destructin-1 is a collagen-degrading endopeptidase secreted by Pseudogymnoascus destructans, the causative agent of white-nose syndrome. Proc Natl Acad Sci 2015; 112(24):7478-83; https://doi.org/https://doi.org/10.1073/pnas.1507082112
- Finn RD, Bateman A, Clements J, Coggill P, Eberhardt RY, Eddy SR, Heger A, Hetherington K, Holm L, Mistry J, et al. Pfam: The protein families database. Nucleic Acids Res 2014; 42(D1):D222-30; https://doi.org/https://doi.org/10.1093/nar/gkt1223
- Bandouchova H, Bartonicka T, Berkova H, Brichta J, Cerny J, Kovacova V, Kolarik M, Köllner B, Kulich P, Martínková N, et al. Pseudogymnoascus destructans: Evidence of Virulent Skin Invasion for Bats Under Natural Conditions, Europe. Transbound Emerg Dis 2015; 62(1):1-5; PMID:25268034; https://doi.org/https://doi.org/10.1111/tbed.12282
- Frank CL, Michalski A, McDonough AA, Rahimian M, Rudd RJ, Herzog C. The resistance of a North American bat species (Eptesicus fuscus) to White-Nose Syndrome (WNS). PLoS ONE 2014; 9(12):e113958; https://doi.org/https://doi.org/10.1371/journal.pone.0113958
- Mayer FL, Wilson D, Hube B. Candida albicans pathogenicity mechanisms. Virulence 2013; 4(2):119-28; PMID:23302789; https://doi.org/https://doi.org/10.4161/viru.22913
- Lilley TMTM, Johnson JS, Ruokolainen L, Rogers EJEJ, Wilson CACA, Schell SMSM, Field KAKA, Reeder DMDDM. White-nose syndrome survivors do not exhibit frequent arousals associated with Pseudogymnoascus destructans infection. Frontiers in Zoology 2016; 13(1):12; PMID:26949407; https://doi.org/https://doi.org/10.1186/s12983-016-0143-3
- Wheeler RT, Kombe D, Agarwala SD, Fink GR. Dynamic, morphotype-specific Candida albicans beta-glucan exposure during infection and drug treatment. PLoS Pathogens 2008; 4(12):1-12; https://doi.org/https://doi.org/10.1371/journal.ppat.1000227
- Romani L. Immunity to fungal infections. Nat Rev Immunol 2011; 11(4):275-88; PMID:21394104; https://doi.org/https://doi.org/10.1038/nri2939
- Ketudat Cairns JR, Esen A. β-Glucosidases. Cell Mol Life Sci: CMLS 2010; 67(20):3389-405; PMID:20490603; https://doi.org/https://doi.org/10.1007/s00018-010-0399-2
- Kitagaki H, Wu H, Shimoi H, Ito K. Two homologous genes, DCW1 (YKL046c) and DFG5, are essential for cell growth and encode glycosylphosphatidylinositol (GPI)-anchored membrane proteins required for cell wall biogenesis in Saccharomyces cerevisiae. Mol Microbiol 2002; 46(4):1011-22; PMID:12421307; https://doi.org/https://doi.org/10.1046/j.1365-2958.2002.03244.x
- Ene I V, Adya AK, Wehmeier S, Brand AC, Maccallum DM, Gow NAR, Brown AJP. Host carbon sources modulate cell wall architecture, drug resistance and virulence in a fungal pathogen. Cell Microbiol 2012; 14(9):1319-35; PMID:22587014; https://doi.org/https://doi.org/10.1111/j.1462-5822.2012.01813.x
- Ene I V, Heilmann CJ, Sorgo AG, Walker LA, de Koster CG, Munro CA, Klis FM, Brown AJP. Carbon source-induced reprogramming of the cell wall proteome and secretome modulates the adherence and drug resistance of the fungal pathogen Candida albicans. PROTEOMICS 2012; 12(21):3164-79; PMID:22997008; https://doi.org/https://doi.org/10.1002/pmic.201200228
- Gargas A, Trest MT, Christensen M, Volk TJ, Blehert DS. Geomyces destructans sp. nov. associated with bat white-nose syndrome. Mycotaxon 2009; 108(June):147-54; https://doi.org/https://doi.org/10.5248/108.147
- Raudabaugh DB, Miller AN. Morphogenetic Effect of L-cysteine on Pseudogymnoascus destructans and Related Species. Mycosphere 2014; 5(6):737-46.
- Collette JR, Lorenz MC. Mechanisms of immune evasion in fungal pathogens. Curr Opin Microbiol 2011; 14(6):668-75; PMID:21955887; https://doi.org/https://doi.org/10.1016/j.mib.2011.09.007
- Johnson JS, Reeder DM, Lilley TM, Czirják G, Voigt CC, McMichael JW, Meierhofer MB, Seery CW, Lumadue SS, Altmann AJ, et al. Antibodies to Pseudogymnoascus destructans are not sufficient for protection against white-nose syndrome. Ecol Evol 2015; 5(11):2203-14; PMID:26078857; https://doi.org/https://doi.org/10.1002/ece3.1502
- Lilley TM, Prokkola JM, Johnson JS, Rogers EJ, Gronsky S, Kurta A, Reeder DM, Field KA. Immune responses in hibernating little brown myotis (Myotis lucifugus) with white-nose syndrome. Proceedings of the Royal Society B. 2017; 284 (1848):20162232; PMID:28179513; https://doi.org/https://doi.org/10.1098/rspb.2016.2232
- Bromuro C, Romano M, Chiani P, Berti F, Tontini M, Proietti D, Mori E, Torosantucci A, Costantino P, Rappuoli R, et al. Beta-glucan-CRM197 conjugates as candidates antifungal vaccines. Vaccine 2010; 28(14):2615-23; PMID:20096763; https://doi.org/https://doi.org/10.1016/j.vaccine.2010.01.012
- Shen HD, Lin WL, Tam MF, Chou H, Wang CW, Tsai JJ, Wang SR, Han SH. Identification of vacuolar serine proteinase as a major allergen of Aspergillus fumigatus by immunoblotting and N-terminal amino acid sequence analysis. Clin Exp Allergy 2001; 31(2):295-302; PMID:11251631; https://doi.org/https://doi.org/10.1046/j.1365-2222.2001.01026.x
- Hood MI, Skaar EP. Nutritional immunity: transition metals at the pathogen-host interface. Nat Rev Microbiol 2012; 10(8):525-37; PMID:22796883; https://doi.org/https://doi.org/10.1038/nrmicro2836
- Haas H, Eisendle M, Turgeon BG. Siderophores in fungal physiology and virulence. Annu Rev Phytopathol 2008; 46(1):149-187; PMID:18680426; https://doi.org/https://doi.org/10.1146/annurev.phyto.45.062806.094338
- Flieger M, Bandouchova H, Cerny J, Chudíčková M, Kolarik M, Kovacova V, Martínková N, Novák P, Šebesta O, Stodůlková E, et al. Vitamin B2 as a virulence factor in Pseudogymnoascus destructans skin infection. Sci Rep 2016; 6:33200; PMID:27620349; https://doi.org/https://doi.org/10.1038/srep33200
- Bolger AM, Lohse M, Usadel B. Trimmomatic: A flexible trimmer for Illumina sequence data. Bioinformatics 2014; 30(15):2114-20; PMID:24695404; https://doi.org/https://doi.org/10.1093/bioinformatics/btu170
- Andrews S. FastQC: A quality control tool for high throughput sequence data. Available from: http://www.bioinformatics.babraham.ac.uk/Projects/Fastqc/.2010
- Dobin A, Davis CA, Schlesinger F, Drenkow J, Zaleski C, Jha S, Batut P, Chaisson M, Gingeras TR. STAR: Ultrafast universal RNA-seq aligner. Bioinformatics 2013; 29(1):15-21; PMID:23104886; https://doi.org/https://doi.org/10.1093/bioinformatics/bts635
- Yates A, Akanni W, Amode MR, Barrell D, Billis K, Carvalho-Silva D, Cummins C, Clapham P, Fitzgerald S, Gil L, et al. Ensembl 2016. Nucleic Acids Res 2016; 44(D1):D710-D716; PMID:26687719; https://doi.org/https://doi.org/10.1093/nar/gkv1157
- Drees KP, Palmer JM, Sebra R, Lorch JM, Chen C, Wu C-C, Bok JW, Keller NP, Blehert DS, Cuomo CA, et al. Use of Multiple Sequencing Technologies To Produce a High-Quality Genome of the Fungus Pseudogymnoascus destructans, the Causative Agent of Bat White-Nose Syndrome. Genome Announc 2016; 4(3):e00445-16; PMID:27365344; https://doi.org/https://doi.org/10.1128/genomeA.00445-16
- Li B, Dewey CN. RSEM: accurate transcript quantification from RNA-Seq data with or without a reference genome. BMC Bioinformatics 2011; 12(1):323; PMID:21816040; https://doi.org/https://doi.org/10.1186/1471-2105-12-323
- Busby MA, Stewart C, Miller CA, Grzeda KR, Marth GT. Scotty: a web tool for designing RNA-Seq experiments to measure differential gene expression. Bioinformatics 2013; 29(5):656-7; PMID:23314327; https://doi.org/https://doi.org/10.1093/bioinformatics/btt015
- Love MI, Huber W, Anders S. Moderated estimation of fold change and dispersion for RNA-seq data with DESeq2. Genome Biol 2014; 15(12):550; PMID:25516281; https://doi.org/https://doi.org/10.1186/s13059-014-0550-8
- Robinson MD, McCarthy DJ, Smyth GK. edgeR: A Bioconductor package for differential expression analysis of digital gene expression data. Bioinformatics 2010; 26(1):139-40; PMID:19910308; https://doi.org/https://doi.org/10.1093/bioinformatics/btp616
- Robinson MD, Oshlack A. A scaling normalization method for differential expression analysis of RNA-seq data. Genome Biol 2010; 11(3):R25; PMID:20196867; https://doi.org/https://doi.org/10.1186/gb-2010-11-3-r25
- Benjamini Y, Hochberg Y. Controlling the false discovery rate: a practical and powerful approach to multiple testing. Journal of the Royal Statistical Society Series B (Methodological) 1995; 57:289-300.
- Suzuki R, Shimodaira H. Pvclust: An R package for assessing the uncertainty in hierarchical clustering. Bioinformatics 2006; 22(12):1540-42; PMID:16595560; https://doi.org/https://doi.org/10.1093/bioinformatics/btl117
- McGinnis S, Madden TL. BLAST: At the core of a powerful and diverse set of sequence analysis tools. Nucleic Acids Res 2004; 32 (suppl_2): W20-W25; PMID: 15215342; https://doi.org/https://doi.org/10.1093/nar/gkh435
- Jones P, Binns D, Chang HY, Fraser M, Li W, McAnulla C, McWilliam H, Maslen J, Mitchell A, Nuka G, et al. InterProScan 5: Genome-scale protein function classification. Bioinformatics 2014; 30(9):1236-40; PMID:24451626; https://doi.org/https://doi.org/10.1093/bioinformatics/btu031
- Tang H, Flick P, Sato K, Ramirez F, Klopfenstein D, Mungall C, Yunes J, Pedersen B. GOATOOLS: Tools for Gene Ontology. 2015; https://doi.org/https://doi.org/10.5281/ZENODO.31628