
 ?Mathematical formulae have been encoded as MathML and are displayed in this HTML version using MathJax in order to improve their display. Uncheck the box to turn MathJax off. This feature requires Javascript. Click on a formula to zoom.
ABSTRACT
The codon usage pattern can reveal the adaptive changes that allow virus survival and fitness adaptation to their particular host, as well as the external environment. Although still considered a novel influenza virus, there is an increasing number of influenza D viruses (IDVs) reported. Considering the vital role of the hemagglutinin-esterase fusion (HEF) gene in receptor binding, receptor degradation, and membrane fusion, we investigated the codon usage pattern of the IDV HEF gene to better understand its adaptive changes during evolution. Based on the HEF gene, three groups including, D/OK, D/660, and D/Japan were identified. We found a low codon usage bias, which allowed IDV to replicate in the corresponding hosts by reducing competition during evolution, that was mainly driven by natural selection and mutation pressure, with a profound role of natural selection. Furthermore, the interaction between the codon adaption index (CAI) and the relative codon deoptimization index (RCDI) revealed the adaption of IDV to multiple hosts, especially cattle which is currently considered its reservoir. Additionally, similarity index (SiD) analysis revealed that the swine exerted a stronger evolutionary pressure on IDV than cattle, though cattle is considered the primary reservoir. In addition, the conserved PB1 gene showed a similar pattern of codon usage compared to HEF. Therefore, we hypothesized that IDV has a preference to maintain infection in multiple hosts. The study aids the understanding of the evolutionary changes of IDV, which could assist this novel virus prevention and control.
Introduction
As a novel genus of the Orthomyxoviridae, influenza D virus (IDV) was first identified in 2011 and provisionally named C/swine/Oklahoma/1334/2011 (C/OK) [Citation1]. Although IDV was initially detected in swine, it was considered to be an important causative agent of bovine respiratory disease, with cattle as the primary reservoir [Citation2]. Additionally, serological surveys revealed that IDV infects small ruminants [Citation3], as well as ferrets, which are the preferred animal model to study influenza virus human infections [Citation2]. Moreover, with the increasing number of cases reported in many countries [Citation4–Citation8], it is urgent to research the adaption of this multi-host influenza virus during its evolution.
Generally, the redundancy of the genetic code allows individual amino acids to be translated by more than one codon, and thus codons encoding the same amino acid are referred to as synonymous codons [Citation9]. However, synonymous codons are not randomly selected, a phenomenon known as codon usage bias [Citation10,Citation11]. This phenomenon allows viruses to efficiently survive and adapt to their corresponding hosts, as well as the environment [Citation12,Citation13]. The codon usage pattern is influenced by natural or translational selection and mutation pressure [Citation14,Citation15], as well as other factors such as, replication, selective transcription protein structure, protein hydrophobicity and hydrophilicity, and the external environment [Citation12,Citation16,Citation17]. Most RNA viruses have a low codon usage bias [Citation12,Citation13,Citation18,Citation19], which allows efficient replication in the host cell by lowering the competition with the host genes. Comparing the codon usage pattern of virus to their specific hosts helps us better understand the fitness and escape adaptations that take place during virus evolution [Citation20]. Furthermore, influenza viruses characterize by a complete dependence on the host during replication and, in addition, their codon usage pattern is adapted to their particular hosts [Citation21].
Similar to influenza C virus (ICV), the IDV genome consists of seven RNA segments. Interestingly, the hemagglutinin-esterase fusion glycoprotein (HEF) has the same functions as the hemagglutinin (HA) and neuraminidase (NA) proteins of influenza A virus (IAV) and influenza B virus (IBV) [Citation22]. The HEF is crucial to receptor binding, damaging, and membrane fusion [Citation1]. Furthermore, except for the HEF gene and the conserved PB1 gene, the other internal genes are frequently associated with reassortment [Citation23]. Here, we analyzed all publicly available IDV HEF and PB1 gene sequences in terms of codon usage patterns. Detailed genetic analyses of emerging IDV are important for understanding and estimating the risk of ongoing transmission amongst mammals and potential public health risks as well as for developing effective countermeasures.
Materials and methods
Sequence data and phylogenetic analysis
A total of 38 complete coding sequences of the IDV HEF and 27 of the PB1 genes were downloaded from GenBank of National Center for Biotechnology Information (https://www.ncbi.nlm.nih.gov/genbank/). After removal a low-quality sequence, D/bovine/France/2986/2012, 37 sequences of HEF were left for analysis. The detailed informations of the sequences, including accession number, country and year of isolation, are listed in supplementary materials (Table S1). Sequences were aligned by muscle in MEGA 7.0 [Citation24]. The neighbor joining tree was reconstructed based on a p-distance substitution model implemented in MEGA 7.0 [Citation24] with the bootstrap value set at 1,000.
Codon usage bias parameters
Nucleotide content
The content of each nucleotide (A%, U%, G%, C%), AU, and GC were calculated using BioEdit. In addition, the nucleotide frequencies of synonymous codons at the third position (A3%, U3%, G3%, C3%) were calculated using CodonW (v1.4.2). The frequencies of synonymous G + C at the first (GC1), second (GC2), and third codon positions (GC3) were calculated using the online website: cusp (http://www.bioinformatics.nl/emboss-explorer/). The G + C at the first and second positions (GC12) was also calculated. The codons AUG, UGG, and the termination codons (UAA, UGA, UAG) were removed from the analysis.
Relative synonymous codon usage (RSCU)
To find the most commonly used synonymous codons, the RSCU values for 59 codons were calculated using MEGA7.0. A RSCU value of 1 indicates that the codons are used equally [Citation25]. Codons with RSCU values < 0.6 > 1.6 represent “under-represented” and “over-represented” codons, respectively [Citation26].
Principal component analysis (PCA)
PCA, a multivariate statistical method [Citation27], analyses the major tendency of codon usage patterns. To reduce the misleading that amino acid composition exerts on the codon usage, each strain is represented as a 59-dimensional vector, with each dimension corresponding to the RSCU value for each sense codon [Citation28].
Effective number of codons (ENC)
The ENC is a useful tool to evaluate the degree of codon usage bias. The ENC value ranges from 20 (only one codon was used) to 61 (all synonymous codons were used equally) [Citation29]. The smaller the value, the stronger the codon preference is. A value less than 35 is indicative of a strong preference [Citation30]. The value is calculated as follows:
The (k = 2,3,4,6) represents the mean
value in the k-fold degenerate amino acid family, and
was calculated as:
n represents the total number of codons to the corresponding amino acid. Additionally, the S was calculated as follows:
In the formula, the means the total number of the
codon for the corresponding amino acid.
ENC-plot analysis consists in plotting GC3s in the abscissa and the ENC value in the ordinate and is used to investigate the major factors influencing the codon usage bias, like mutation pressure, natural selection, and nucleotide composition [Citation29]. If mutation pressure is the only factor driving codon usage bias, the points will lie on the standard curve. Alternatively, if the points sit below the standard curve, it is indicative of that except for mutational pressure, other factors affect codon usage bias. The expected ENC was calculated as:
ENC expected = 2 + s +
where s is the composition of the given .
Parity rule 2 analysis (PR2)
PR2 is applied to explore the relationship of the four-codon amino acids families, with A3/(A3+U3) plotted against G3/(G3+C3), evaluating the equivalence between mutation pressure and natural selection. A = U and G = C means both the axis values are 0.5 and 0.5, indicating a balance between mutation pressure and natural selection [Citation31,Citation32].
Neutrality analysis
To determine the effect of mutation pressure on codon usage bias compared to natural selection, neutrality analysis was used. Using GC3 as a horizontal coordinate and GC12 as the vertical coordinate, the GC3 and GC12 contents of HEF genes were plotted and a regression line was calculated. Regression lines that fall near the diagonal (slope = 1.0) indicate weak external selection pressure [Citation33], whereas regression curves deviating from the diagonal indicate a significant influence of natural selection on codon usage bias [Citation34].
Codon adaptation index (CAI)
To reveal the adaptability of the HEF gene to the selected hosts, the CAI were calculated using the CAIcal SERVER (http://genomes.urv.cat/CAIcal/RCDI/) [Citation35]. The hosts including, Sus scrofa, Bos taurus, and Capra hircus based on serological evidence [Citation3]. The RSCU of the host was obtained from the Codon Usage Database (http://www.kazusa.or.jp/codon/) [Citation36]. The CAI value ranges from 0 to 1.0. The higher the CAI value, the better the virus is adapted to its host [Citation37]. Additionally, the significance regarding the respective clades and hosts were tested in variance analysis with double factor analysis without repetition.
Relative codon deoptimization index (RCDI)
The relative codon deoptimization index values of the HEF gene were calculated using the RCDI/eRCDI SERVER (http://genomes.urv.cat/CAIcal/RCDI/) [Citation38]. A value of 1.0 means that the codon usage is adapted to the host [Citation39], whereas higher than 1.0 indicates deviation from the host. Additionally, the significance regarding the respective clades and hosts were tested in variance analysis with double factor analysis without repetition.
Similarity index (SiD) analysis
To reveal the effect of the overall codon usage pattern of hosts on the HEF gene of IDV, the SiD was calculated as follows:
where i is defined as the RSCU value in the synonymous codon usage pattern of the HEF gene, thus, representing the RSCU value for the same codon. D (A, B) is the value of the SiD analysis, indicating the potential impact of the global codon usage of the hosts on the different clades of the HEF gene. The values range from 0 to 1.0 [Citation40].
Results
Phylogenetic analysis and PCA
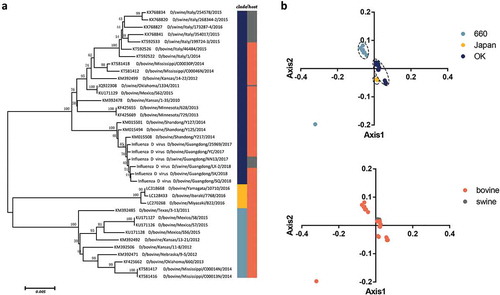
The phylogenetic tree of the HEF gene shows that there are three individual clades: D/OK type, D/660 type, and D/Japan type with high bootstrap values(). This is in agreement with previous studies showing two classical divergent clades. Additionally, the strains discovered in Japan clustered independently from the D/OK and D/660 type [Citation4,Citation41]. The strains from Japan also clustered separately in the PB1 gene phylogeny (Fig S1a).
In PCA analysis, the first and second axis were 37.57% and 23.04%, respectively, accounting for the major source of variation. Then, we explored the distribution of each HEF strain based on the RSCU values on the first two axes (). The HEF strains were mainly divided into three groups: D/660, D/Japan, and the D/OK, except for a D/660 type strain isolated from bovine that clustered separately. It is essential to note that the limited number of sequences might bias the results, and therefore these observations need further confirmation. However, despite the fact that IDV can infect two different hosts, we found several overallaps according to host using PCA analysis indicating that the major codon usage tendency is identical, to some degree, in the two hosts.
Figure 1. (a) Neighbor joining tree of the IDV HEF gene reconstructed using a p-distance model implemented in MEGA7. (b) PCA of IDV according to different clades and hosts. The D/660, D/Japan and D/OK clades and swine and bovine hosts are represented in light blue, yellow, dark blue, grey, and orange, respectively.
Codon usage bias
Nucleotide and synonymous codon composition
We found that the A (proportion: 0.3139 ± 0.00224) and U (proportion: 0.2523 ± 0.001281) nucleotides were used more frequently than C (0.1956 ± 0.00179) and G (0.2380 ± 0.00134). In addition, this tendency was similar for synonymous codons at the third position (Table S1). The average GC12 and GC3 were 46.79%, and 36.50%, respectively. Furthermore, the more abundant A and U codons were also observed in the PB1 gene (Table S1).
Relative synonymous codon usage
In addition, the RSCU value confirmed that U- and A-ended codons are more frequent than C- and G-ended codons for both the HEF or PB1 genes (Table S2). In the HEF gene, among the 18 preferred synonymous codons, 9 ended with A, followed by U-, C- and G-ended codons. When comparing the RSCU values of the individual clades of the HEF gene to the reference hosts, we found that among the 18 frequently used synonymous codons, 17 were consistently used, regardless of clade or host, except for the synonymous codons encoding Tyr. Additionally, the D/660 clade is consistent with bovine while the D/Japan and D/OK clades are consistent with swine ().
Table 1. The RSCU value of 59 codons encoding 18 amino acids according to clades and hosts of HEF gene. The optimal codons are shown in bold.
The low codon usage bias of IDV HEF gene is dominated by natural selection more than mutation pressure
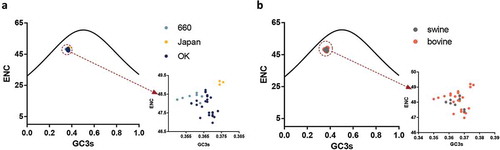
The ENC value revealed that the HEF gene has a low codon usage bias with mean ENC values of 48.3 (± 0.179), 49.12 (± 0.097), 47.90 (± 0.514), 47.93 (± 0.351), and 48.15 (± 0.587) for clades D/660, D/Japan, and D/OK, and the swine and bovine hosts, respectively (). Additionally, the mean ENC value of the PB1 gene was 49.40 (± 0.695). Next, we analyzed the factors influencing the codon usage bias of the HEF gene. The ENC-plot analysis according to different clades and hosts () shows that the data points of all the strains are below the standard curve indicative that, except for mutation pressure, other factors like natural selection, drive the codon usage of the HEF gene, in agreement with the PB1 gene (Fig S1B). Additionally, the PR2 plot shows that all the dots are separated from the region (0.5, 0.5), indicative that the degree of mutation pressure and natural selection are not equivalent regardless of clade or host species (Fig S2).
Figure 2. ENC values of the HEF gene of different clades and hosts. The D/660, D/Japan, and D/OK clades and swine and bovine hosts are represented in light blue, yellow, dark blue, grey, and orange, respectively.
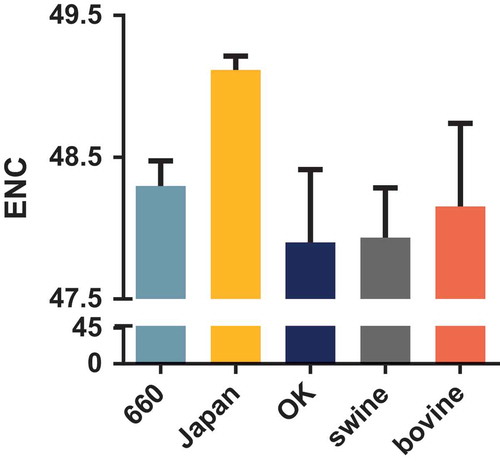
Figure 3. (a, b). ENC-plot analysis of the HEF gene, with ENC against GC3s of different clades and hosts. The black line represents the standard curve when the codon usage bias is determined by the GC3s composition only. The D/660, D/Japan and D/OK clades and swine and bovine hosts are represented in light blue, yellow, dark blue, grey and orange, respectively.
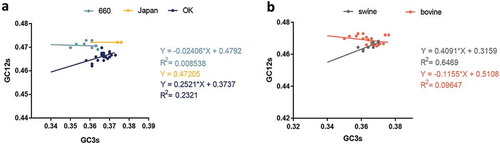
Furthermore, neutrality analysis revealed a narrow distribution and low GC3 values (35.04% to 37.58%). In order to decipher the effect of mutational pressure and natural selection in different clades and hosts, regression analysis was performed. We found no significant correlation between GC12 and GC3 in the D/OK clade (R2 = 0.2321, p = 0.0171) and in swine (R2 = 0.6469, p = 0.0161) [Citation12]. In addition, the effect of mutation pressure on the D/660, D/Japan, and D/OK clades and swine and cattle were 2.41%, 0%, 25.21%, 40.91%, and 11.55%, respectively (). The above results indicate that natural selection dominates the codon usage over mutation pressure. Additionally, neutrality analysis of the PB1 gene revealed that the effect of mutation pressure was 1.116% with a R2 = 0.00361 (Fig S1C).
Figure 4. Neutrality plot analysis of GC3s against GC12s. a and b are diagrams of different clades and host, respectively. The IDV HEF strains cluster into three clades including: D/660, D/OK and D/Japan, represented in light blue, dark blue, and yellow, respectively. The line and dot of swine and bovine are represented in grey and orange, respectively.
IDV displays a complex codon usage adaption and deoptimization pattern in the corresponding hosts
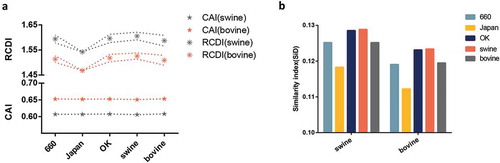
Next, we explored the three currently identified hosts (Bos taurus, Sus scrofa, and Capra hircus) against the three clades. The CAI represents the expression level of a gene based on its codon usage pattern. As shown in , the highest CAI value of all IDV strains taken together was for bovine (0.653 ± 0.003), followed closely by goat (0.647 ± 0.003) and then swine (0.607 ± 0.003). In particular, the D/660 clade had the highest CAI value (0.6527 ± 0.00378 for bovine, 0.6477 ± 0.004 for goat and 0.607 ± 0.004 for swine) compared to the other two clades, followed by the D/OK and the D/Japan clades. We also performed RCDI analysis to understand the deoptimization of all strains in relation to the individual clades. The RCDI values of all strains to swine were higher than to bovine and goat. In addition, the clades with the highest and lowest RCDI values in relation to swine were the D/OK (1.594 ± 0.0154) and D/Japan (1.5423 ± 0.0045) clades, respectively. The same trend was found for bovine and goat (). The results between different hosts in individual clade and host were significant, with a p value less than 0.01, in relation to both CAI and RCDI.
Figure 5. (a) CAI analysis (bottom panel represented by a symbol star) and RCDI analysis (upper panel represented by a symbol asterisk) of the HEF gene in relation to the natural hosts. The lines in the RCDI analysis in each host represent the upper and lower limit. (b) SiD analysis of the IDV HEF gene. The D/660, D/Japan, and D/OK clades are represented in light blue, yellow, dark blue. The swine, goat, and bovine hosts are represented in grey, dark green, and orange, respectively. The x axis represents the sequences belonging to different clades or identified in different hosts.
For the PB1 gene, the lowest CAI value was observed in swine while the RCDI value was the highest for swine (Fig S1D)
High selection pressure in swine influences the IDV codon usage pattern
To understand how the codon usage patterns of the three hosts affect the virus codon usage pattern, we performed SiD analysis (). We found that in the HEF gene, the SiD value of swine (0.126) was higher than bovine (0.120) and goat (0.117) indicating that during IDV evolution, swine had a greater impact on the virus than bovine and goat. Moreover, the D/OK clade displayed the highest value, followed by the D/660 and the D/Japan clades. Similar results observed for the PB1 gene (Fig S1E).
Discussion
IDV was first discovered in the United States, but is present in China, Japan, France, Ireland, and Italy [Citation4–Citation8]. It displays a wide range of host, in particular infecting swine and bovine, but with serological evidence in small ruminants, ferrets, and humans [Citation2,Citation3]. A recent study explored the codon usage pattern reflecting the evolutionary changes of IDV to survive and adapt to a multi-host environment based on analysis of the HEF and PB1 genes. The phylogeny based on the HEF gene revealed the existence of two clades: D/OK and D/660 [Citation23]. A later study showed that the strains detected in Japan clustered apart from others in the phylogeny [Citation41], which was confirmed in our study. Given the high degree of conservation of the PB1, its evolution in respect to codon usage pattern was also studied here.
Nucleotides A/U more frequently used and the most common at the third position of synonymous codons in both the HEF and PB1 genes. Additionally, the usage bias towards A- and U-ended codons was also revealed in RSCU analysis. We found an ENC value higher than 35, indicative of a low degree of preference. Other studies have also reported a low IAV codon usage bias, including the CIV H3N2 HA gene (ENC = 53.22 ± 0.316) [], the AIV H1N1pdm (52.50) [Citation42], and EIV H3N8 (52.09) [Citation21], which might allow the virus to replicate in the host environment by reducing competition [Citation12]. Therefore, we hypothesized that the lower codon usage pattern in IDV could aid in proliferation and facilitate infectivity in multiple hosts. Additionally, the D/Japan clade of the HEF gene displayed the lowest codon usage bias. However, this result might be biased given the limited number of sequences from Japan. Moreover, the strains isolated from swine had a higher codon usage bias compared to bovine. This might be further confirmed by CAI analysis that indicated that IDV is more adapted to bovine than swine. Both in eukaryotes and prokaryotes, the codon usage is mainly influenced by the balance of mutation pressure and natural selection [Citation43,Citation44]. Here, we found by ENC-plot and PR2 analyses that IDV is influenced by mutation pressure and natural selection with variable degrees. Generally, it is considered that the G/C or A/U abundance relate to the corresponding RSCU pattern. Thus, the tendency of mutation pressure can be verified by the preferred ended codons [Citation12]. Furthermore, using neutrality analysis we demonstrated that natural selection controls the wide IDV host range, confirmed by a slope of regression line less than 1. This might due to the weak codon usage bias in IDV was caused by natural selection when the viruses try to adapted to the host cells [Citation45].
We also analysis if the codon usage pattern relates to the specific hosts. We found that the CAI values of bovine and goat were higher than swine, in agreement with RCDI analysis [Citation46]. This phenomenon was observed for both the HEF and the PB1 genes. This might lead to a lower IDV protein synthesis in swine compared to other hosts [Citation33]. In addition, in order to ensure accurate replication, survival, and efficient pathogenicity in multi-hosts, the virus must balance between complex codon adaption and deoptimization [Citation12]. Interestingly, the SiD value of swine was higher than that of bovine and goat, indicating that the selection pressure of swine on IDV was greater than bovine and goat, in agreement with neutrality analysis, especially for the D/OK clade. We therefore hypothesize a strong link between IDV and swine, although bovine was always suggested as the primary IDV host [Citation2,Citation23]. In summary, the potential IDV natural hosts could be either swine, bovine [Citation12], or both. Thus, the threat of IDV to public health should be more carefully monitored.
In conclusion, here we analyzed the overall codon usage pattern of the IDV HEF and PB1 genes to better understand the evolutionary changes of this novel influenza virus. This study aids into the prevention of widespread IDV, although its origin and natural ecology remain unknown.
Supplemental Material
Download MS Word (34.9 KB)Disclosure statement
No potential conflict of interest was reported by the authors.
Supplemental material
Supplemental data for this article can be accessed here.
Additional information
Funding
Related Research Data
References
- Hause BM, Ducatez M, Collin EA, et al. Isolation of a novel swine influenza virus from oklahoma in 2011 which is distantly related to human influenza C viruses. PLoS Pathog. 2013;9:e1003176.
- Hause BM., Collin EA, Liu RX et al. Characterization of a novel influenza virus in cattle and swine: proposal for a new genus in the orthomyxoviridae family. Mbio. 2014;5:10.
- Quast M, Sreenivasan C, Sexton G, et al. Serological evidence for the presence of influenza D virus in small ruminants. Vet Microbiol. 2015;180:281–285.
- Murakami S, Endoh M, Kobayashi T, et al. Influenza D virus infection in herd of Cattle, Japan. Emerg Infect Dis. 2016;22:1517–1519.
- Zhai SL, Zhang H, Chen SN, et al. Influenza D virus in animal species in Guangdong Province, Southern China. Emerg Infect Dis. 2017;23:1392–1396.
- Flynn O, Gallagher C, Mooney J, et al. Influenza D virus in Cattle, Ireland. Emerg Infect Dis. 2018;24):389–391.
- Ducatez MF, Pelletier C, Meyer G. Influenza D virus in Cattle, France, 2011-2014. Emerg Infect Dis. 2015;21:368–371.
- Rosignoli, C, Faccini S, Merenda M, et al. Influenza D virus infection in cattle in Italy. Large Anim Rev. 2017;23:123–128.
- Li GR, Ji SL, Zhai XF, et al. Evolutionary and genetic analysis of the VP2 gene of canine parvovirus. Bmc Genomics. 2017;18(1):534.
- Grantham R, Gautier C, Gouy M, et al. Codon catalog usage and the genome hypothesis. Nucleic Acids Res. 1980;8(1):r49–r62.
- Marin A, Bertranpetit J, Oliver JL, et al. Variation in G+C-CONTENT and codon choice - differences among synonymous codon groups in vertebrate genes. Nucleic Acids Res. 1989;17:6181–6189.
- Butt AM, Nasrullah I, Qamar R, et al. Evolution of codon usage in Zika virus genomes is host and vector specific. Emerg Microbes Infect. 2016;5:e107.
- Li GR, Wang RY, Zhang C, et al. Genetic and evolutionary analysis of emerging H3N2 canine influenza virus. Emerg Microbes Infect. 2018;7:73.
- Ma J, Z. F, Zhang J, et al. Analysis of synonymous codon usage in dengue viruses. J Anim Vet Adv. 2013;12:88–98.
- Nasrullah I, Butt AM, Tahir S, et al. Genomic analysis of codon usage shows influence of mutation pressure, natural selection, and host features on Marburg virus evolution. BMC Evol Biol. 2015;15:1–15.
- Tao P, Dai L, Luo MC, et al. Analysis of synonymous codon usage in classical swine fever virus. Virus Genes. 2009;38:104–112.
- Moratorio G, Iriarte A, Moreno P, et al. A detailed comparative analysis on the overall codon usage patterns in West Nile virus. Infect Genet Evol. 2013;14:396–400.
- Hussain S, Rasool ST. Analysis of synonymous codon usage in Zika virus. Acta Trop. 2017;173:136–146.
- van Hemert F, van der Kuyl AC, Berkhout B. Impact of the biased nucleotide composition of viral RNA genomes on RNA structure and codon usage. J Gen Virol. 2016;97:2608–2619.
- Shackelton LA, Parrish CR, Holmes EC. Evolutionary basis of codon usage and nucleotide composition bias in vertebrate DNA viruses. J Mol Evol. 2006;62:551–563.
- Kumar N, Bidhan CB, Benjamin D.G, et al. Revelation of influencing factors in overall codon usage bias of equine influenza viruses. PLoS One. 2016;11(4):e0154376.
- Bouvier NM, Palese P. The biology of influenza viruses. Vaccine. 2008;26(26):D49–D53.
- Collin EA, Sheng Z, Lang Y, et al. Cocirculation of two distinct genetic and antigenic lineages of proposed influenza D virus in Cattle. J Virol. 2015;89:1036–1042.
- Kumar S, Stecher G, Tamura K. MEGA7: molecular evolutionary genetics analysis version 7.0 for bigger datasets. Mol Biol Evol. 2016;33:1870–1874.
- Sharp PM, Li WH. An evolutionary perspective on synonymous codon usage in unicellular organisms. J Mol Evol. 1986;24:28–38.
- Wong EHM, Smith DK, Rabadan R, et al. Codon usage bias and the evolution of influenza A viruses. Codon usage biases of influenza virus. Bmc Evol Biol. 2010;10:253.
- Gustafsson C, Govindarajan S, Minshull J. Codon bias and heterologous protein expression. Trends Biotechnol. 2004;22:346–353.
- Nishisato S. Theory and applications of correspondence-analysis - greenacre,Mj. Psychometrika. 1985;50:376–377.
- Wright F. The effective number of codons used in a gene. Gene. 1990;87:23–29.
- Comeron JM, Aguade M. An evaluation of measures of synonymous codon usage bias. J Mol Evol. 1998;47:268–274.
- Sueoka N. Intrastrand parity rules of DNA base composition and usage biases of synonymous codons (vol 40, pg 318, 1995). J Mol Evol. 1996;42:323.
- Sueoka N. Translation-coupled violation of Parity Rule 2 in human genes is not the cause of heterogeneity of the DNA G+C content of third codon position. Gene. 1999;238:53–58.
- Butt AM, Nasrullah I, Qamar R, et al. Evolution of codon usage in Zika virus genomes is host and vector specific. Emerg Microbes Infec. 2016;5:e107-e107.
- Sueoka N. Directional mutation pressure and neutral molecular evolution. Proc Natl Acad Sci U S A. 1988;85:2653–2657.
- Puigbo P, Bravo IG, Garcia-Vallve S. CAIcal: a combined set of tools to assess codon usage adaptation. Biol Direct. 2008;3:38.
- Nakamura Y, Gojobori T, Ikemura T. Codon usage tabulated from international DNA sequence databases: status for the year 2000. Nucleic Acids Res. 2000;28:292.
- Sharp PM, Li WH. The codon Adaptation Index–a measure of directional synonymous codon usage bias, and its potential applications. Nucleic Acids Res. 1987;15:1281–1295.
- Puigbo P, Aragones L, Garcia-Vallve S. RCDI/eRCDI: a web-server to estimate codon usage deoptimization. BMC Res Notes. 2010;3:87.
- Mueller S, Papamichail D, Coleman JR, et al. Reduction of the rate of poliovirus protein synthesis through large-scale codon deoptimization causes attenuation of viral virulence by lowering specific infectivity. J Virol. 2006;80:9687–9696.
- Zhou JH, Zhang J, Sun D-J, et al. The distribution of synonymous codon choice in the translation initiation region of dengue virus. PLoS One. 2013;8:e77239.
- Mekata H, Yamamoto M, Hamabe S, et al. Molecular epidemiological survey and phylogenetic analysis of bovine influenza D virus in Japan. Transbound Emerg Dis. 2018;65:e355–e360.
- Anhlan D, Grundmann N, Makalowski W, et al. Origin of the 1918 pandemic H1N1 influenza A virus as studied by codon usage patterns and phylogenetic analysis. Rna. 2011;17:64–73.
- Bulmer M. The selection-mutation-drift theory of synonymous codon usage. Genetics. 1991;129:897–907.
- Yang Z, Nielsen R. Mutation-selection models of codon substitution and their use to estimate selective strengths on codon usage. Mol Biol Evol. 2008;25:568–579.
- Shi SL, Jiang YR, Liu YQ, et al. Selective pressure dominates the synonymous codon usage in parvoviridae. Virus Genes. 2013;46:10.
- Puigbò P, Aragonès L, Garcia-Vallvé S. RCDI/eRCDI: a web-server to estimate codon usage deoptimization. BMC Res Notes. 2010;3:1–4.