
ABSTRACT
Antibiotic therapy and its consequences in bacterial and human aspects are widely investigated. Despite this, the emergence of new multidrug resistant bacteria is still a current problem. The scope of our work included the observation of changes among uropathogenic Escherichia coli strains after the treatment with a subinhibitory concentration of different antibiotics. The sensitive strains with or without virulence factors were incubated with amoxicillin, ciprofloxacin, gentamycin, or tobramycin. After each passage, the E. coli derivatives were compared to their wild types based on their susceptibility profiles, virulence genes, biofilm formations and the fingerprint profiles of PCR products amplified with using the (N)(6)(CGG)(4) primer. It turned out that antibiotics caused significant changes in the repertoire of bacterial virulence and biofilm formation, corresponding to acquired cross-resistance. The genomic changes among the studied bacteria were reflected in the changed profiles of the CGG-PCR products. In conclusion, the inappropriate application of antibiotics may cause a rapid rise of Multidrug Resistant (MDR) strains and give bacteria a chance to modulate their own pathogenicity. This phenomenon has been easily observed among uropathogenic E. coli strains and it is one of the main reasons for recurrent infections of the urinary tract.
Introduction
Extensive research provides increasingly strong evidence of the importance of uropathogenic Escherichia coli (UPEC) strains for medical and epidemiological problems. Their remarkable adaptive abilities are conductive to acute or chronic urinary tract infections (UTI) and cause serious therapeutic problems [Citation1,Citation2]. Nowadays they are not only seen as E. coli isolated from urine, but a specialized pathotype with specific mechanisms of intracellular pathogenicity, which allow for colonization of the urinary tract, avoidance of host defenses and causing damage to the uroepithelium [Citation3–Citation6]. In addition, a high spread of antibiotic resistance is observed within these pathotypes [Citation7–Citation12]. They owe this high capacity to genetic modulate, own pathogenicity and drug resistance [Citation13–Citation15]. Several urovirulence factors, such as hemolysin (the hly gene), the cytotoxic necrotizing factor type 1 (the cnf-1 gene), the P-pili (the pap genes), S-family adhesions (the sfa gene), and the bacteriocin usp (the usp gene) are coded by the genes located on pathogenicity islands (PAIs) and through this they can be quickly transferred via the horizontal gene transfer [Citation16–Citation20]. This mechanism is also observed during the transfer of the genes conditioning resistance to some antibiotics. Numerous antibiotics are recommended for the treatment of UTI [Citation21–Citation23]. They belong mainly to betalactams and cephalosporins, but aminoglycosides and fluoroquinolones are also often applied [Citation24]. In response to this – UPEC strains developed a lot of defense mechanisms against antibiotics, related to changes in protein expression or gene mutations. Furthermore, the loss of certain parts of UPEC PAIs was observed during the incubation with ciprofloxacin. This phenomenon is related to the induction of the SOS response (to global DNA damage in bacteria) induced by some antibiotics [Citation25,Citation26]. Epidemiological studies revealed that the strains with a higher drug-resistance had a lower number of virulence genes in contrast to the strains with lower drug-resistance [Citation27]. It is an established fact that the mechanisms of drug resistance belong to complex mechanisms of bacterial adaptation, regulated by many factors [Citation2,Citation28–Citation30]. The situation becomes more complicated when the antibiotic is incorrectly applied, especially during ambulatory therapy. The problem is that when the antibiotic reaches a subinhibitory concentration before the delivery of the next dose, it gives bacteria an opportunity to develop a drug resistance and modulate their own pathogenicity [Citation31]. We would like to consider these hypotheses in vitro, including different antibiotics and properties of the UPEC strains.
Materials and methods
Bacterial strains
Five clinical Escherichia coli strains isolated from the urine of patients suffering from urinary tract infection were selected for this study. They belong to the characterized bacterial collection used in previous studies [Citation30,Citation32,Citation33]. The basic criteria for their selection were the sensitivity to all analyzed antibiotics and the varied occurrence of virulence factor genes. The characteristic of these strains was presented in . E. coli ATCC 25,922 was used as the control strains during antimicrobial susceptibility testing according to the guidelines of the European Committee on Antimicrobial Susceptibility Testing (EUCAST).
Table 1. The characteristic of clinical uropathogenic E. coli strains selected for the study; 0 – lack of the gene, 1 – gene presence, S – sensitive, I – intermediately sensitive. CIP – ciprofloxacin, NOR – norfloxacin, OFX – ofloxacin, AML – amoxicillin, AMC – amoxicillin/clavulanate, PRL – piperacillin, CAZ – ceftazidime, FOX – cefoxitin, CTX – cefotaxime, IMI – imipenem, GN – gentamycin, TN – tobramycin, AK – amikacin, NET – netilmicin, NI – nitrofurantoin, W – trimethoprim, SXT – trimethoprim/sulfamethoxazole.
Experiment plan
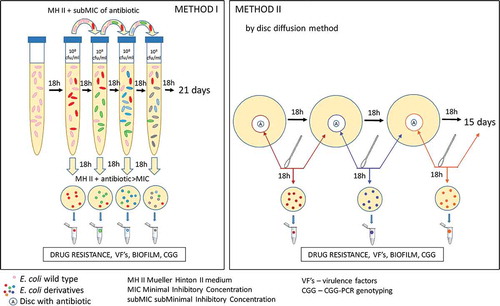
The process of selection of derivatives from E. coli wild-type strains consisted of different stages and it was dependent on the antibiotics used. In case of ciprofloxacin and amoxicillin, the experiment was performed in liquid broth (Method I). Because of the insolubility of tobramycin and gentamicin in broth – the derivatives were selected using the agar (Method II). The schematic process of the experiments was presented in . After the selection of E. coli derivatives, their antibiotic susceptibility profiles were analyzed via the Disc Diffusion Method. Resistant derivatives of E. coli were further analyzed. Their growth curves under the antibiotic pressure were compared to the standard logarithmic growth of the control strains (E. coli ATCC 25,922). Next, the stability of the generated drug resistance among derivatives was evaluated as well. Additionally, the selected derivatives of E. coli were verified using the E.coli Chromogenic Medium (Biocorp). Further, derivatives were analyzed based on the presence and expression of virulence factors genes and biofilm formation. Finally, the CGG-PCR profiles between derivatives and their wild type strains were compared.
Figure 1. The schematic description of the E. coli derivatives selection using Method I and Method II described in the Materials and Methods.
E. coli derivatives selection – Method I
The minimal inhibitory concentrations (MICs) of antibiotics (ciprofloxacin and amoxicillin) were determined for each E. coli strain in accordance with the serial dilution method. Bacterial suspensions in 0.9% NaCl were prepared from overnight cultures. The turbidity was equal to 0.5 in the McFarland standard (∼1 × 10⁸ CFU/ml). The prepared suspensions were diluted to ∼1 × 10⁶ CFU/ml in Mueller Hinton II (MHII) broth with varying concentrations of the antibiotic to the final volume of 4 ml and they incubated for 18 h in 37°C. The purity of broth was verified via swabbing of 100 µl of sterile broth onto MHII Agar plates. According to the definition of the MIC, we designated MIC as the starting point and the boundary for the determination of subminimal inhibitory concentrations (sub-MIC) of particular antibiotics. We assumed the sub-MIC to be the highest concentrations of the antibiotic in which the bacterial growth is observed. Optimized sub-MICs were further used in these studies and they were respectively: 0.008 mg/L of ciprofloxacin for E. coli No. 5, No. 16, and No.84; 0,016 mg/L of ciprofloxacin for E. coli No. 1 and No. 6; 4 mg/L of amoxicillin for E. coli No. 1, No. 5, No. 6, and No. 84; 8 mg/L of amoxicillin for E. coli No. 16.
The 40 µl of overnight bacterial inoculum was transferred to the MH II broth supplemented sub-MIC of antibiotic in a total volume of 4 ml, to the final culture concentration of ∼1 × 10⁶ CFU/ml. After 18 ± 2 h of incubation, the 40 µl of bacterial suspension was passed on to the next broth with the sub-MIC of the antibiotic. The passes were conducted according to this scheme for 21 days. E. coli wild-type strains were passed on the same way without the antibiotic and they were considered as negative control for the experiment. Simultaneously, each overnight culture was swabbed onto a MH II Agar supplemented with the antibiotic >MIC (amoxicillin >10 mg/L, ciprofloxacin >1.5 mg/L according to EUCAST MIC tables, 2016), toward the selection of antibiotic-induced derivatives. The grown colony was randomly selected as the E. coli derivative and it was multiplied and prepared in glycerol stocks to be stored in −80°C. The following analyses were conducted for the characterization of the selected derivatives.
E. coli derivatives selection – Method II
E. coli derivatives were selected using the MH II Agar with the presence of standard antibiotic disks (10µg of Gentamycin, 10 µg of Tobramycin). The experiment was prepared according to the standard disc diffusion method (EUCAST, 2018). After each overnight (18 h) bacterial incubation, the 0.5 McFarland bacterial suspension in 0.9% NaCl was prepared through the collection of bacteria from the border of the growth inhibition zone around the antibiotic disc. Simultaneously, the same swab was used for the semiquantitative bacterial culture incubated under the same conditions on the MH II agar. During each passage, the zone of growth inhibition was measured and compared to the EUCAST standards. After exceeding the limit value, the culture was classified as resistant and the E. coli derivative was selected by random isolation of a single grow colony on the second plate of the MH II agar. The passing of E.coli wild type strains without antibiotic discs was considered as a negative control for the experiment. All passes were conducted for 15 days and the isolated single colonies of E. coli derivative were multiplied and prepared in glycerol stocks to be stored in −80°C. The following analyses were conducted for the characterization of the selected derivatives.
Antimicrobial susceptibility testing
Antimicrobial susceptibility testing was carried out via the disk diffusion method on Mueller–Hinton II Agar plates, using commercial disks (Oxoid, Wesel, Germany) according the protocol described previously [Citation33]. The E. coli derivatives and wild-type strains were tested against 17 antimicrobiotics: amoxicillin (AML, 25 μg), amoxicillin/clavulanate (AMC, 20 + 10 μg), piperacillin (PRL, 30 μg), cefoxitin (FOX, 30 μg), cefotaxime (CTX, 5 μg), ceftazidime (CAZ, 10 μg), imipenem (IMP, 10 μg), amikacin (AK, 30 μg), tobramycin (TN, 10 μg), gentamicin (GN, 10 μg), netilmicin (NET, 10 μg), norfloxacin (NOR, 10 μg), ciprofloxacin (CIP, 5 μg), ofloxacin (OFX, 5 μg), trimethoprim (W, 5 μg), trimethoprim-sulfamethoxazole (STX, 25 μg), and nitrofurantoin (NI, 100 μg). The susceptibility testing of bacteria strains was interpreted according to the EUCAST guidelines based on the values of the growth inhibition zones. Bacterial strains were determined as sensitive (S), intermediately sensitive (I), or resistant (R) to the particular antibiotics. The analysis was repeated three times for 10 randomly selected strains.
Growth curves
A fresh inoculum of bacteria was prepared in the MH II Broth at 37°C for 24 h. The bacterial culture was diluted to obtain 0.125 ± 0.005 OD at 600 nm using the Microplate Reader (TECAN Infinite 200 PRO, Tecan Group Ltd., Switzerland), corresponding to approximately 103 CFU of bacteria. The E. coli derivatives were grown in triplicate on 96-well plates at 37°C in the LB broth with a sub-MIC of the antibiotic. The negative control was the wild-type E. coli strains incubated under the same conditions. The positive control for standard logarithmic growth curves was E. coli ATCC 25,922 cultured in the optimal conditions. The bacterial growth was measured at 600 nm using a Microplate Reader after every 2 h of incubation for 24 h. All measurements were performed in two independent experiments.
Resistance stability assay
E. coli derivatives resistant to ciprofloxacin, amoxicillin, or tobramycin were passaged on to the MH II Agar broth in optimal conditions (without antibiotics) for 19 days (derivatives generated by ciprofloxacin and amoxicillin) and 8 days (derivatives generated by tobramycin). After the 1st, 4th, 8th, 12th, and 19th day of passage, the bacterial susceptibility profiles for 17 antimicrobials were determined.
PCR and gene expression
The genomic DNA isolated from the fresh inoculum of the bacteria was used for the identification of the studied genes (papC, sfaD/sfaE, cnf1, usp, fimG/H, and hlyA). The specific PCR parameters for all primers used in the study and their references are shown in . PCRs were performed with bacterial DNA (approx. 20 ng) in a 25 µl reaction mixture containing a 12.5 µl DreamTaq™ Green DNA Polymerase Master Mix (2×) (ThermoFisher Scientific™) and 10 pmol of each primer (oligo.pl) and refilled with MiliQ water. An individual adjustment of the conditions of DNA amplification was carried out in am Eppendorf thermocycler. After electrophoresis on 2% agarose gel, the PCR products were visualized under UV.
Table 2. Oligonucleotides used in the study.
Qualitative gene expression was evaluated at the transcription level. The total mRNA was isolated by the FastRNATM Spin Kit (MP Biomedica) using the FastPrep® Instrument (MP Biomedica). Next, the cDNA was synthesized using the TranScriba Kit (A&A Biotechnology) and the presence of particular genes was detected with the PCR standard method described above.
Biofilm formation assay
The biofilm formation assay was carried out by 0.3% crystal violet staining according to the protocol described previously [Citation32]. The bacteria were grown in triplicate on the 96-well plates at 37°C in the LB broth. A medium without bacteria incubated under the same conditions was used as a negative control. Biofilm formation was measured at 531 nm using a Microplate Reader. All measurements were performed in two independent experiments. A blank corrected mean absorbance value of <0.04 from the negative control was considered as a biofilm-negative strain. The results were normalized to verify if the biofilm formation is independent from the bacterial growth level. BRel (Biofilm relative) was estimated based on the ratio between the absorbance level of the formed biofilm and the absorbance level of the growth (A531/A600). Additionally, the biofilm formation stability was measured for derivative strains with increased biofilm formation. The bacterial cultures at control conditions (24 h, 37°C in LB broth without antibiotics) were passaged on for 20 days in triplicate on the 96-well plates. After each day of passing, the fresh bacterial inoculum was measured for biofilm formation according to the protocol described above.
(CGG)4-based PCR
The DNA fingerprint profiles of particular E. coli strains were obtained according to the protocol described in the previous study [Citation30] except for the use of a different polymerase and 4 min of elongation. The products of PCR were amplified by using 100 pmol of N6(CGG)4 added to the reaction mixture containing bacterial DNA (approx. 20 ng) and the 12.5 µl DreamTaq™ Green DNA Polymerase Master Mix (2x) (ThermoFisher Scientific™) and filled with MiliQ water up to 25 µl of total volume. The 1st stage of PCR was denaturation at 95°C for 3 min, then repeated 35 times at 95°C for 1 min and at 72°C for 4 min, followed by a final extension step at 72°C for 8 min. After the electrophoresis on 3% agarose gel, the CGG-PCR products were visualized under UV.
Statistical analyses
The differences in antibiotic susceptibility between wild types and derivatives of studied E. coli strains were analyzed statistically using a two-tailed, paired T-test, where p < 0.05 meant statistically significant. The statistically significant (p < 0.05) difference between the biofilm formation level was calculated based on a two-tailed, unpaired T-test. GraphPad Prism, version 6 (San Diego, CA, USA) was used for the analyses and derivation of figures.
Results
Antibiotic sensitivity of E. coli derivatives
Five uropathogenic clinical E. coli strains () were chosen for the experiments. In total, the 121 E. coli derivative strains were generated after the treatment with a subinhibitory concentration of different antibiotics. Particular groups of derivatives exhibited the ability to grow above the MIC of ciprofloxacin, amoxicillin, gentamicin or tobramycin. In the case of the selected derivatives that did not confirm the resistance to the antibiotic via the disc diffusion method – they were identified as antibiotic-tolerant derivative strains. The characterization of the general antibiotic impact on the rate of changes among the studied bacteria was presented in . During the selection process – the day selection of the first derivative was compared to the day of selection of the first derivative with confirmed antibiotic resistance. Also, the total number of E. coli derivatives induced by particular antibiotics was presented. Ciprofloxacin induced the resistance the fastest, all strains (except E. coli No. 84) generated four resistant derivatives just after the first day of passage. E. coli No. 84 did not generate any derivatives upon treatment with ciprofloxacin. Another antibiotic that quickly induced the resistance was amoxicillin – just after the second day of passage, the colonies appeared on the agar with the antibiotic above the MIC, except E. coli No. 84 which generated the first antibiotic-tolerant derivative strain after the sixth day of passage. In case of aminoglycosides, the first derivatives appeared between the third and the fifth day of passage. Usually, except for induction by ciprofloxacin, the resistance appeared successively later than tolerance to antibiotics. The largest number of derivatives was obtained in the culture with the sub-MIC of amoxicillin (42), the lowest number of E. coli derivative strains was generated upon treatment with gentamycin, but the differences between this antibiotic and tobramycin and ciprofloxacin were slight. None of the wild-type E. coli strains acquired the antibiotic resistance during the control passes (cultures without antibiotic).
Table 3. The rate of derivatives and drug-resistance generation. The day of the 1st derivative appearance was confirmed according to developed method I for CIP and AML and method II for GN and TN, described in the Materials and Methods. The day of the first resistance of particular derivatives was confirmed via the disc diffusion method. The total number of all selected derivatives represents the strains expressing antibiotic-tolerance >MIC of ciprofloxacin (CIP), amoxicillin (AML), gentamycin (GN), or tobramycin (TN).
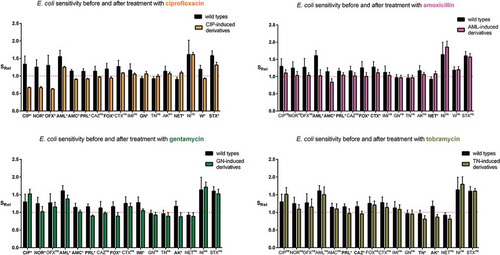
Subsequently, all selected strains grouped into ciprofloxacin-induced derivatives, amoxicillin-induced derivatives, gentamycin-induced derivatives, and tobramycin-induced derivatives were compared to their wild types of E. coli strains based on the antibiotic sensitivity (). To equalize the sensitivity to antibiotics in relation to the border of resistance, the relative values of sensitivity (SRel) were estimated. The sensitivity of the derivatives to almost all antibiotics (excluding mainly amoxicillin, nitrofurantoin, trimethoprim-sulfamethoxazole) was decreased and it was close to the border of sensitivity. The level of sensitivity variation to antibiotics was observable in particular groups of derivative E. coli strains. The statistically significant changes of antibiotic sensitivity among derivatives were observed mostly for ciprofloxacin-induced derivatives. In the case of 11 out of 17 antibiotics, the bacterial sensitivity was significantly changed, the sensitivity mostly decreased, except gentamicin and netilmicin where the sensitivity increased. A similar correlation was observed in the case of gentamicin-induced derivatives, which exhibited an increased sensitivity to ciprofloxacin. Increased sensitivity was observed among amoxicillin-induced derivatives also regarding netilmicin. The strongest decrease of sensitivity was observed toward fluoroquinolones among ciprofloxacin-induced derivatives. The resistance to amoxicillin (amoxicillin-induced derivatives) was correlated with significantly decreased sensitivity only to betalactam antibiotics (amoxicillin/clavulanate, piperacillin, cefoxitin, and cefotaxime). The aminoglycosides used for the selection of derivatives caused similar changes in the sensitivity to the analyzed antibiotics. However, gentamycin significantly decreased the sensitivity to six betalactam antibiotics and norfloxacin, whereas tobramycin significantly decreased only the sensitivity to piperacillin. To sum up, it was observed that the antibiotics used for the selection of E. coli derivatives induced resistance to other antibiotics. However, the increased sensitivity to antibiotics with correlation to increased resistance to other antibiotics was also observed in some cases. The cross-resistance was especially observed in the case of ciprofloxacin (). Ciprofloxacin induced the resistance to all fluoroquinolones, amoxicillin/clavulanate and trimethoprim among 100% of derivatives and induced 64% of cefoxitin-resistant derivatives. The other antibiotics (AML, GEN, and TOB) induced the cross-resistance to more antibiotics, but in a smaller number of derivative strains. The resistance to fluoroquinolones did not correspond with aminoglycoside resistance, as it was observed in . Furthermore, the sensitivity to aminoglycosides was correlated with the resistance to ciprofloxacin and vice versa. Nonetheless, the aminoglycosides have induced resistance mainly to aminoglycosides, also but to a lesser extent to betalactams and to fluoroquinolones. All derivative strains remained sensitive to imipenem and also in majority they remained sensitive to cefotaxime, trimethoprim/sulfamethoxazole and nitrofurantoin. To sum up, ciprofloxacin induced the resistance to at least one antibiotic from 17 analyzed among 39% of derivatives, while other antibiotics (amoxicillin, gentamycin, or tobramycin) induced the resistance to other antibiotics only in a dozen or so % of derivatives. On the other hand, ciprofloxacin never induced the resistance in 10 out of 17 antibiotics, aminoglycosides – 6–7 and amoxicillin – 5.
Table 4. Heat map of the percentage of E. coli derivatives with acquired resistance to particular antibiotics. I – Fluoroquinolones, II – Penicillins, III – Cephalosporins, IV – Carbapenems, V – Aminoglycosides, VI – Others, CIP – ciprofloxacin, NOR – norfloxacin, OFX – ofloxacin, AML – amoxicillin, AMC – amoxicillin/clavulanate, PRL – piperacillin, CAZ – ceftazidime, FOX – cefoxitin, CTX – cefotaxime, IMI – imipenem, GN – gentamycin, TN – tobramycin, AK – amikacin, NET – netilmicin, NI – nitrofurantoin, W – trimethoprim, SXT – trimethoprim/sulfamethoxazole, NT – not tested, Avg – average of percentage of E. coli derivatives with acquired resistance to all antibiotics.
Figure 2. The relative antibiotic sensitivity (SRel) of wild-type E. coli strains (No. 1, No. 5, No. 6, No. 16, and No. 84) and their derivatives isolated during the treatment with a subinhibitory concentration of antibiotics (ciprofloxacin, amoxicillin, gentamycin, and tobramycin). The sensitivity was measured for all studied antibiotics (CIP – ciprofloxacin, NOR – norfloxacin, OFX – ofloxacin, AML – amoxicillin, AMC – amoxicillin/clavulanate, PRL – piperacillin, CAZ – ceftazidime, FOX – cefoxitin, CTX – cefotaxime, IMI – imipenem, GN – gentamycin, TN – tobramycin, AK – amikacin, NET – netilmicin, NI – nitrofurantoin, W – trimethoprim, SXT – trimethoprim/sulfamethoxazole). The results (SRel) represent the ratio between the medium value of diameter zone of inhibited growth of E. coli strains (wild type or derivatives) and the limit value of the sensitivity diameter zone according to the clinical breakpoint tables from EUCAST 2018. The value 1 on the Y axis means the limit value of the diameter zone of inhibited bacterial growth corresponding to sensitivity according to the clinical breakpoint tables of EUCAST 2018. The statistically significant (p < 0.05)* difference between the sensitivity to individual antibiotics was determined using a two-tailed, paired T-test (GraphPad Prism, version 6; San Diego, CA, USA), ns – not statistically significant.
Additionally, the growth curves of randomly selected 9 E. coli derivatives (No.: 1/20CIP, 5/12CIP, 6/4CIP, 16/20CIP, 1/10AML, 5/2AML, 6/15AML, 16/11AML, and 84/21AML) were examined during the incubation with the sub-MIC of amoxicillin or ciprofloxacin. The derivative strains started growth at the same time as the control E. coli ATCC 25,922 and their growth curves remained at the same level. The difference was very slight. The wild type of E. coli strains was unable to grow under the treatment with the sub-MIC of antibiotics. The example of the growth curve of the derivative strain in comparison to the negative and positive control were presented in . Next, the stability of induced antibiotic resistance was verified for 10 antibiotic-resistant derivatives generated by ciprofloxacin, amoxicillin, and tobramycin (). Generally, the most stable resistance was discovered in the case of derivative strains generated by ciprofloxacin. All derivatives maintained resistance to all tested quinolones, even after 19 days of incubation. It was also noted that 85% of these derivative strains remained resistant to amoxicillin/clavulanate. Variably stable resistance was observed among the group of amoxicillin-resistant derivatives. Interestingly, during the incubation without the sub-MIC of amoxicillin, all the tested derivatives lost their resistance to amoxicillin just after the first day of passage, but they remained resistant to amoxicillin/clavulanate. The least stable resistance was observed in the group of tobramycin-induced derivatives. The resistance to tobramycin remained among all the tested derivatives for all days of passage, however a complete loss of resistance was observed in case of the other aminoglycosides.
Table 5. The stability of acquired resistance among derivatives of E. coli strains. After the 1st, 4th, 8th, 12th, and 19th day of passage of derivatives the antibiotic resistance was verified by disc diffusion method. High stability – 100% of derivatives remained resistant; *85% of derivatives remained resistant; diverse stability – the resistance profiles of the derivatives were diverse after the resistance stability assay; instability – 100% of derivatives lost the drug resistance.
Figure 3. The examples of growth curves of the wild type (E. coli No. 5, negative control) and its derivative (E. coli No. 5/12CIP) upon treatment with the sub-MIC of antibiotics (amoxicillin or ciprofloxacin). The positive control of logarithmic growth curve was E. coli ATCC 25,922 incubated in optimal conditions. The absorbance level of the growth (A600) was measured every two hours. Each bar represents the mean with standard deviation, all measurements were performed in two independent experiments.
Gene loss
The analysis of gene loss such as papC, sfaE/D, cnf1, usp, fimG/H, and hlyA was examined in all derivatives (67) adequately to their wild type E. coli strains (No. 6, No. 16, and No. 84). Only ciprofloxacin-induced derivatives (13; 19%) demonstrated the loss of particular genes, other derivative strains kept their original genes profiles (). The E. coli No. 84 have not acquired the resistance to ciprofloxacin, so none CIP-derivative of No. 84 was generated. Ciprofloxacin-induced derivatives kept or lost the virulence factor genes variously, however all derivatives kept the fimG/H. Only one derivative (E. coli 6/7CIP) kept their original profile of virulence genes. The remaining derivatives of E. coli No. 6 have lost all the other analyzed genes. In the case of the derivatives of E. coli No. 16, the virulence gene profiles were differential. All derivative strains have lost papC, 5 out of 7 derivative strains have lost usp and 3 out of 7 have lost sfaE/D.
Table 6. The occurrence of virulence factor genes (papC, sfaD/E, cnf1, usp, fimG/H, and hlyA) in ciprofloxacin-induced E. coli derivatives and their wild type E. coli strains; 0 – lack of the gene, 1 – gene presence. The lack or presence of particular genes was consistent with no or active expression on the transcriptional level.
The observed loss of genes corresponded with the loss of their expression on the transcription level (). None of the bacterial colonies of wild-type strains (randomly selected) isolated during passages in control conditions have lost the analyzed genes.
Figure 4. The examples of agarose gel electrophoresis for PCR products of sfaD/E (A, B), cnf1 (C), and fimG/H (D) gene fragments amplified from cDNA synthesized by reverse transcription of mRNA isolated from E. coli wild type (No. 6 and No. 16) and ciprofloxacin-resistant derivatives (No.: 6/1C, 6/4C, 6/7C, 6/10C, 6/12C, 6/16C, 6/20C, 16/1C, 16/4C, 16/7C, 16/10C, 16/12C, 16/16C, and 16/20C), M – 100 bp DNA Ladder (Invitrogen).
Biofilm formation
The level of biofilm formation was checked for all generated derivative strains (121) in the optimal condition culture (without the antibiotic). The wild-type strains exhibited a very low (on average 0.085) level of absorbed crystal violet and it was close to the negative control of biofilm (0.04). The obtained results were compared between the derivatives and their wild types of E. coli strains. Only derivatives of E. coli No. 5 and No. 6 induced by amoxicillin revealed the increase of biofilm formation (). The level of biofilm formation among derivative strains was not equal but statistically significantly higher (up to 4 times) than biofilm formation among the wild types of E. coli strains. The derivatives generated in the following days of passage increased the biofilm formation gradually () and it was independent from the bacterial growth level. Furthermore, the optical density of the growth (A600) was on the same level in both derivatives and wild-type strains. Additionally, the six representative derivative strains with increased biofilm formation (E. coli No.: 5/13AML, 5/17AML, 5/21AML, 6/9AML, 6/15AML, and 6/21AML) were selected for the analysis of the biofilm formation stability. The bacterial cultures were passed for 20 days in control conditions (without antibiotics). The derivative strains demonstrated a stable biofilm formation, which showed an additional increase from the 12th day of passage ().
Figure 5. The comparison of the biofilm formation between the wild types and derivatives (amoxicillin-induced) of E. coli strains No. 5 and No. 6. Each bar represents the mean with standard deviation based on the OD value of the absorbed crystal violet (0,3%) measured at 531 nm (A531) for each strain from particular groups (wild types and derivatives). The study was performed in four replications in two independent experiments. The difference is significant (p < 0.05, unpaired T-test, two-tailed, nonparametric).
Figure 6. The relative biofilm formation of the wild type and derivatives (amoxicillin-induced) of E. coli strain No 5. (A) and No. 6 (B). The biofilm was analyzed based on the OD value of the absorbed crystal violet (0,3%) measured at 531 nm (A531). The results represent the values of relative biofilm formation (BRel) independent of bacterial growth (A531/A600). The study was performed in four replications, in two independent experiments.
Figure 7. The stability of biofilm formation of the amoxicillin-induced derivatives of E. coli No. 5 and No. 6. The biofilm formation was measured after the subsequent days of culture passages under the control condition (without antibiotic). The biofilm was analyzed based on the OD value of the absorbed crystal violet (0.3%) measured at 531 nm (A531). The results represent the values of relative biofilm formation (Brel) independent of bacterial growth (A531/A600). The study was performed in four replications in two independent experiments.
DNA fingerprints
All 121 derivatives were compared to their wild-type E. coli strains based on the patterns of the CGG-PCR products. shows examples of the comparison of band patterns between the E. coli wild types and their derivatives generated by different antibiotics. Generally, the band patterns of aminoglycoside-induced derivatives were the most similar to their wild-type strains. The most visible differences were observed between the wild types and their ciprofloxacin-induced derivatives. The degree of differentiation of DNA fingerprints was directly proportional to other observed changes among E. coli derivatives. However, E. coli No. 84 was the most stable strain. The slight changes of sensitivity to antibiotics and similarly small changes of the CGG fingerprints appeared among its derivatives. The passage of E. coli wild-type cultures in optimal conditions was conducted for 4 days. The strains preserved the same band patterns of the CGG-PCR product as before the passes.
Figure 8. The comparison of the fingerprint profiles of the CGG-PCR products amplified from E. coli wild type (No. 1, No. 5, No. 6, No. 16, and No. 84) and their antibiotic-induced derivatives (exemplary pictures): C – ciprofloxacin-induced E. coli derivatives, A – amoxicillin-induced E. coli derivatives, GN – gentamycin-induced E. coli derivatives, TN – tobramycin-induced E. coli derivatives. The external DNA band patterns – 100 bp DNA Ladder (Invitrogen).
Discussion
Currently, bacterial resistance to antimicrobials is widely explored, including not only typical mechanisms of drug resistance, but it is also considered in the context of complex bacterial pathogenicity [Citation8]. Bacterial adaptation to the environment is one of the oldest mechanisms of living cells in the world, so it can be assumed that bacteria can regulate it via different pathways of metabolism. That is why we have put forward a hypothesis that antibiotics can also induce global changes in the uropathogenic Escherichia coli cells. Generally, we wanted to investigate what the consequences would appear during long-term exposure of the UPEC strains to sublethal concentrations of different antibiotics. Similar investigations have been conducted for a long time on many different bacterial species [Citation8,Citation34–Citation37]. However, the effect of antibiotics on different metabolic pathways in bacteria still needs to be clarified. The bacterial exposure on the sub-MIC of antibiotics is an important factor for emergence of bacterial drug resistance, especially since it can happen during the antibiotic treatment of a bacterial infection or during preventive use of antibiotics in animal breeding [Citation38,Citation39].
Antibiotics induce different antibiotic susceptibility changes
First, the generation rate of derivatives, the changes in the drug-resistance profiles and the stability of the acquired resistance were analyzed among selected E. coli derivatives. Almost all studied E. coli strains acquired the drug resistance during the treatment with the sub-MIC of all used antibiotics. Only one E. coli strain did not generate any derivatives resistant to ciprofloxacin and it was the most stable bacterial strain. Ciprofloxacin induced the resistance the fastest (just after the first day of passage) and resistance to all fluoroquinolones was observed in all derivative strains. The similar observation was described by Soto et al. [Citation34]. This resistance is quickly generated by mutation in gyrA and parC [Citation40–Citation42] that is irreversible and strongly correlated with all fluoroquinolones. This corresponds with the previously presented synergistic effect of antibiotics detected with Cohen’s kappa correlation, where the resistance to one fluoroquinolone was compatible with the resistance to all fluoroquinolones [Citation33]. Additionally, the observed correlation between simultaneous acquisition of the ciprofloxacin-induced resistance to fluoroquinolones, amoxicillin/clavulanate and trimethoprim indicates the dangerous mechanism of cross-resistance among the UPEC strains. That cross-resistance could be correlated with the induction of the efflux pump, which removed the antibiotics from the cell [Citation43]. Chang et al. [Citation44] suggested that the mutations in gyrA or parC were strongly correlated with the overexpression of the AcrAB efflux pump and resistance to betalactams, including clavulanic acid. Similar correlations of the increased expression of AcrAB/TolC and the decreased expression of OmpC in the ciprofloxacin-resistant mutant of S. typhimurium were presented by Fabrega et al. [Citation45]. The role of the ArcAB-TolC in the induction of multidrug resistance was described also by other authors [Citation46,Citation47]. The exclusion of fluoroquinolones from routine treatment in outpatient therapy and searching for alternatives should be considered. The application of fluoroquinolones is becoming increasingly questionable and the limitation of their use is promoted by many scientists [Citation7,Citation9–Citation12,Citation48,Citation49]. In turn, ciprofloxacin induced cross-resistance to the smallest number of antibiotics in comparison to others.
In the case of other antibiotics – amoxicillin also induced the resistance very quickly (just after the second day of passage) and it generated the most numerous groups of derivatives. However, amoxicillin induced the resistance to other betalactams only in approx. 25% of derivatives, but the resistance to amoxicillin/clavulanate appeared in 85% of this group of derivatives. Considering the stability of the induced resistance, the derivatives lost the resistance to amoxicillin or cefoxitin during the passage of culture in optimal conditions (without the amoxicillin), whereas the resistance to amoxicillin/clavulanate was irreversible, which was also observed in the case of ciprofloxacin-induced resistance. The induction of the overexpression of the chromosomal beta-lactamase AmpC in the case of E. coli is not possible because of the lack of the ampR gene, which is involved in the activation of ampC transcription. Therefore, AmpC in E. coli is noninducible but is controlled by the promoter and attenuator mechanisms [Citation50]. These observations could probably be a result of ArcAB overexpression as it was mentioned above. Another possibly induced mechanism might be the return to the original membrane structure with the OmpC porins expression. However, the strong conclusion concerning the technical aspects seems to play an important role for this observation. During the analyses of the diameter zones of bacterial growth inhibition, they were similar around the amoxicillin disc and the amoxicillin/clavulanic disc, and the sensitivity to these antibiotics was strongly decreased in comparison to the wild type strains. Thus, these differences can arise from the technical properties of clinical breakpoint tables from EUCAST, where the norms of classification of bacteria in terms of resistance in the case of amoxicillin and amoxicillin/clavulanic are different. Finally, only the resistance to imipenem did not appear in any derivatives. All our previous and current studies proved that imipenem seems to be the most effective antibiotic against the UPEC strains. Similar observations were presented by other authors [Citation51]. Imipenem belongs to the broad-spectrum pf antibiotics combating aerobic and anaerobic Gram-positive and Gram-negative pathogens. Its effectiveness also reinforces the resistance to betalactamases. Betalactam antibiotics are presented as safer than others for treatment and currently they are the gold standard for antibiotic therapy. However, the increasing emergence of carbapenem-resistant bacterial strains producing new variants of NDM betalactamase is well known [Citation52–Citation55]. In our study, besides the rapidly emerging antibiotic tolerance, amoxicillin induced cross resistance to the largest number of antibiotics. The routine and empirical application of betalactams is not a good solution, taking into account these findings and the constantly emerging new beta lactamases with an increasingly broad spectrum of their activity. The least influential antibiotics seem to belong to aminoglycosides, of which the rarest induce cross-resistance in the E. coli derivatives. These observations result from other drug-resistance mechanisms that are associated with translation and the ribosomal structure [Citation56,Citation57]. Additionally, we also observed the statistically significant increased susceptibility to ciprofloxacin in correlation to resistance to gentamycin. It may result from their antagonistic mechanisms of drug-resistance. Suzuki et al. [Citation58] proved that resistance to aminoglycosides reduces proton-motive force that decreases the AcrB expression, leading to susceptibility to drugs which bacteria cannot exclude from the cell. Interestingly, we also observed an opposite phenomenon, wherein the induction of resistance to ciprofloxacin caused increased sensitivity to gentamycin and netilmicin. Maybe that reverse dependence can be connected with increased expression of the acrAB–TolC efflux system. Atac et al. [Citation59] proved that among E. coli ST131 strains, the marA overexpression was correlated to the resistance to quinolones. What is more, the gentamicin resistance was statistically lower in ST131 than in non-ST131. In our research, amoxicillin also revealed similar dependence, but only in the case of netilmicin. Generally, it is known that fluoroquinolones, betalactams and aminoglycosides can act as synergists, so this intriguing observation can be a starting point for further studies. This is the first time the phenomenon of that antagonistic relationship between ciprofloxacin and gentamycin has been observed.
In conclusion, one antibiotic can lead to numerous cross-resistances emerging among E. coli strains. All four antibiotics induced the resistance to the other antibiotics from all six analyzed classes, except ciprofloxacin, which did not induce the resistance to aminoglycosides and imipenem. As we mentioned above – it can result from various mechanism of drug resistance that could be induced by the stress-response of the E. coli cell. Antibiotic-induced stress inside the bacterial cell can change the gene expression profile and it regulates the bacterial metabolism, it also has an impact on other virulence properties of bacteria [Citation59,Citation60].
Ciprofloxacin induces the loss of the virulence factor genes to varying degrees
The subsequent important stage of our study was to verify the extent to which the antibiotics are able to influence the virulence genes of the UPEC strains. It has been long observed that antibiotic resistance correlates with certain bacterial features, this correlation is especially observed between fluoroquinolones and bacterial virulence [Citation27,Citation28,Citation34,Citation61–Citation67]. In our study, the presence of six virulence factor gene regions (papC, sfaE/D, cnf1, usp, fimG/H, hlyA) and their expression were analyzed. These genes (except fimG/H) are described in the literature as specific for the UPEC strains [Citation16–Citation18,Citation20]. It is interesting that the presence of specific virulence-associated genes and deep comprehensive phylogenetic analysis distinguishes UPEC from many commensals and intestinal pathogenic E. coli strains [Citation19,Citation68,Citation69]. Most of these urovirulence genes are carried on the Pathogenic Islands (PAIs) [Citation70–Citation75]. One analyzed gene-fragment – fimG/H, encodes subunits of Fimbria Type I. That fimbria is very important at the early stage of UTI, but it is very commonly present for all type of E. coli strains and it is chromosomally encoded [Citation76,Citation77]. Their stable position in the E. coli genome seems to be important to ensure the primary adhesive property. This was probably the reason fimG/H were preserved in all derivative strains in our study and that fimbria is rather like a fitness, not a virulence factor [Citation69].
In case of the urovirulence factor genes – only ciprofloxacin induced the loss of these genes. E. coli No. 87 did not acquire the resistance to ciprofloxacin, which was equivalent with conservation of all virulence factor genes. It is worth to add that it was the only one strain with all six analyzed virulence factor genes. This could mean that the presence of these genes was stabilized and the mobility properties of the PAIs were lost. In the event of other E. coli strains – the loss of virulence genes appeared just after the first day of passage, but we can see a clear difference between E. coli No. 6 and No. 16. Almost all derivatives of E. coli No. 6 lost all the analyzed genes and one of them saved all the genes, whereas derivatives of E. coli No. 16 have lost their genes differently. The loss of all genes together may indicate the presence of one pathogenic island, however, none of the known PAIs have all the studied genes (sfaE/D, cnf1, usp, and hlyA) at once. The observed simultaneous loss of hlyA and cnf1 in all derivatives of E. coli No.6 can indicate the loss of the PAI IIJ96. Additionally, the loss of sfaE/D and usp can accordingly reflect the presence of PAI III536 and small usp-specific PAIs in E. coli No. 6 genome. In case of E. coli No. 16, the identification of specific PAIs with pap genes is difficult because of their potential presence on many PAIs (PAIsJ96, PAIsCFT073), while the sfa are present on PAI III536 and usp represents specific small PAIs [Citation78–Citation81]. The tendency to maintain the genes in E. coli No. 16 can indicate the loss of some mobile genetic elements and increased stabilization of PAI regions in the genome in comparison to E. coli No. 6.
Although the correlation between the presence of the urovirulence genes and antimicrobial resistance susceptibility was often described, the effects of long-time pressure of sublethal antibiotics concentrations on the UPEC strains has not been clarified. Some sources indicate that DNA repair mechanisms are related to this phenomenon. A similar study was presented by Soto et al. [Citation34], they also observed the simultaneous loss of hly and cnf1 in all studied UPEC strains just after the first day of passage. In contrast to our results, they did not observe the loss of pap and sfa genes. Sanchez-Cespedes et al. [Citation42] observed that gyrA mutation decreased the expression of fimA, papA, papB, and ompA. This mechanism is probably related to a change of DNA topology, which disrupted the normal gene expression process. The gyrase expression plays an important role here, which can relax the DNA helix and lead to mutational changes in bacterial genome via DNA-repair systems [Citation82–Citation84]. However, the observed phenomenon [Citation36,Citation42] indicate that SOS activation is not necessary for the loss of virulence factor genes induced by ciprofloxacin. Perhaps the observed duality of the results arises from other mechanisms of DNA repair like the Double-Strand break repair, mismatch repair, or antibiotic-induced competence for transformation in response to stress [Citation8,Citation85,Citation86]. Maybe it is worth to consider that a different DNA sequence of mobile elements of different PAIs can be of significance to this study.
Amoxicillin increases biofilm formation
The examination of the antibiotics’ influence on bacterial biofilm has been frequently described [Citation37]. These observations concerned analysis in real time of bacterial incubation with antibiotic. We present for the first time how an antibiotic can permanently change the ability to form biofilm among the UPEC strains. Only amoxicillin-induced derivatives of E. coli strains demonstrated a statistically significant higher level of biofilm formation and what is important, it was not dependent on the density of planktonic cells. What should be emphasized – the wild types of the analyzed E. coli strains exhibited a very low level of absorbed crystal violet during the biofilm formation assay, whilst after the treatment with amoxicillin – their selected derivative strains demonstrated up to four times higher volume of absorbed crystal violet. This may indicate that biofilm formation can be induced by amoxicillin even in the strains unable to create biofilm. This situation can be very adverse during UTI treatment, where a sublethal concentration of amoxicillin in the urinary tract can lead not only to the selection of resistant cells but facilitate bacterial adhesion to the uroepithelial tissue of the host and help develop bacterial biofilm. Amoxicillin belongs to antibiotics that affect the bacterial cell wall structure and induce bacterial stress, which can stimulate biofilm formation [Citation87]. The changes of bacterial cell surface can have an effect on their hydrophobicity and in consequence on biofilm formation [Citation88,Citation89]. Similar extensive studies have been carried out by Goneau et al. [Citation36]. They described an in vivo study, in which the subinhibitory antibiotics (ciprofloxacin, ampicillin and gentamicin) modulated the virulence in the uropathogens, inter alia the Escherichia coli. The induction of the expression of adhesins caused an increase in biofilm formation, colonization of the murine bladder and the kidneys, and promoted intracellular bacterial community. A similar observation in vitro in other bacterial species has also been described in the literature. The study on Staphylococcus saprophyticus revealed that the sub-MIC of ciprofloxacin increased the bacterial adherence to glass microscope slides, ureteral stent material and bladder cell monolayers [Citation90]. Kaplan et al. [Citation91] observed 10-fold biofilm increase induced by subminimal inhibitory concentrations of β-lactam antibiotics added to a MSRA strains culture. They proved that it was dependent on cell lysis and in consequence the DNA released into the environment was utilized for the construction of matrix biofilm [Citation92,Citation93]. Taking into account our results – the growth curves of derivatives were not disturbed, so the increase of biofilm formation did not result from the increase of lysed bacterial cells. It could also result from the amoxicillin-induced resistance of the studied derivative strains. Mlynek et al. [Citation93] suggest that amoxicillin stimulate extracellular DNA-dependent biofilm formation in bacteria, which can reflect an adaptation to cell wall stress. Another study [Citation94,Citation95] presents the increase of biofilm formation induced also by β-lactam antibiotics in the Pseudomonas aeruginosa culture. To sum up, this research shows the increase of biofilm during treatment with betalactams, while our results present a stabile increase of biofilm formation after the treatment with amoxicillin. Furthermore, the derivative strains continued the increase of biofilm formation in subsequent days of passage without amoxicillin, which can suggest the induction of some specific gene expressions and their following overexpressions.
Antibiotics induce changes of CGG profiles
On the last stage of the study we genotyped the derivatives and their wild types of the studied E. coli strains via the CGG-PCR developed in our previous study [Citation30]. This technique maps the genomic fingerprints of the studied strains. In the previous study, the designed CGG-PCR have divided the studied E. coli strains into two groups with different pathogenicity. On the other hand, the CGG-PCR indicated the subtle differences specific to individual strains. Following these achievements, we wanted to look into the genomes of E. coli derivatives using the same method. The primary band patterns of the CGG-PCR products were preserved in the E. coli derivatives compared to their wild type strains, but the differences were also observed by disclosure or disappearance of single bands. These differences corresponded the most with ciprofloxacin-induced derivatives, especially where the loss of virulence factor genes was also observed. However, slight differences were also observed after the treatment with amoxicillin. These findings are justifiable because of the strong influence of ciprofloxacin on DNA and its metabolism [Citation34,Citation36,Citation82–Citation85]. Amoxicillin has a weaker impact, but its ability to induce free radicals can affect DNA [Citation25]. The stable band patterns of aminoglycoside-induced derivatives results from the lack of an aminoglycoside influence on the DNA structure [Citation56,Citation57]. It is worth to add that observed changes of the CGG-PCR band patterns were induced by antibiotics, because no changes were not observed after the passages of the culture in optimal conditions. The method of genotyping via MLEE or ribotyping of the rDNA via RFLP are standards used for bacterial differentiation, however they require extensive laboratory experience and they are unable to differentiate the bacterial pathogenicity [Citation96]. These results confirm the previous conclusion that the CGG-PCR may be a useful technique for epidemiological investigation of kinship between E. coli strains.
To summarize, our study provides a broad description of the correlation between sublethal antibiotic treatment and cross-resistance acquisition, virulence factor gene loss, and the increase of biofilm formation among UPEC strains. Similar observations in other bacteria species were also presented by different authors. Dewan et al. [Citation97] revealed that Bordetella bronchiseptica rapidly developed stable and persistent macrolide resistance but it lost virulence and the ability to colonize mice. Likewise, the treatment of the Acinetobacter baumannii culture with subinhibitory concentrations of imipenem increased biofilm formation, motility, and type IV pili synthesis [Citation98,Citation99], compared to a treatment with carbapenems that decreased the expression of virulent omp [Citation100]. The greatest and the most stable changes were observed in the case of ciprofloxacin, which confirms that ciprofloxacin has a strong influence on DNA metabolism and/or activates other pathways which bacteria use for adaptation in unfavorable environment. The bactericidal effect lasts the longest in the case of aminoglycosides. They induce the least changes in bacteria, which exhibit the highest sensitivity to them. Unfortunately, aminoglycosides cause the most numerous and the strongest side effects in humans in comparison to fluoroquinolones and betalactams. Our study exhibits the multiplex effect of antibiotics on the UPEC strains. This group of pathogens exhibit a high capacity to resistance to modern therapies. There are often responsible for frequent recurrent infections as well as fast drug-resistance build-up [Citation49]. The ability to form an intracellular biofilm is a way to cause permanent presence in the urinary tracts of infected patients, which can lead to severe damage or destruction of this system. The understanding of antibiotic resistance mechanisms of the UPEC strains is a chance to develop better therapies. This can lead to both health-related and economic benefits and the presented results are an important signal to reflect on the restrictive use of antibiotics.
Conclusions
The broad results revealed a few important observations related to UPEC strains. Firstly, drug resistance emerges immediately when antibiotic concentration decreases below the MIC, what can induce many cross-resistances to antibiotics from different classes. Additionally, the antagonistic effects between antibiotics were observed. It should be emphasized that the most noticeable changes among the studied bacteria were observed in case of amoxicillin and ciprofloxacin. Amoxicillin decreased the sensitivity to other betalactams and increased the sensitivity to netilmicin. Similarly, ciprofloxacin decreased the sensitivity to betalactams, but also to trimethoprim, trimethoprim-sulfamethoxazole. Furthermore, a strong antagonistic effect was observed between ciprofloxacin and aminoglycosides. It is worth to add that amoxicillin had no influence on the virulence genes but increased biofilm formation, contrary to ciprofloxacin – which induced the loss of virulence factor genes, but it had no influence on biofilm formation.
Ethical approval
For this type of study, formal consent is not required. This article does not contain any studies with human participants or animals performed by any of the authors.
Disclosure statement
No potential conflict of interest was reported by the authors.
Additional information
Funding
Related Research Data
References
- Mann R, Mediati DG, Duggin IG, et al. Metabolic adaptations of uropathogenic e. coli in the urinary tract. Front Cell Infect Microbiol. 2017;7:241.
- Terlizzi ME, Gribaudo G, Maffei ME. UroPathogenic Escherichia coli (UPEC) infections: virulence factors, bladder responses, antibiotic, and non-antibiotic antimicrobial strategies. Front Microbiol. 2017;8:1566.
- Anderson GG, Dodson KW, Hooton TM, et al. Intracellular bacterial communities of uropathogenic Escherichia coli in urinary tract pathogenesis. Trends Microbiol. 2004;12:424–430.
- Justice SS, Hung C, Theriot JA, et al. Differentiation and developmental pathways of uropathogenic Escherichia coli in urinary tract pathogenesis. Proc Natl Acad Sci U S A. 2004;101:1333–1338.
- Wiles TJ, Kulesus RR, Mulvey MA. Origins and virulence mechanisms of uropathogenic Escherichia coli. Exp Mol Pathol. 2008;85(1):11–19.
- Hunstad DA, Justice SS. Intracellular lifestyles and immune evasion strategies of uropathogenic Escherichia coli. Annu Rev Microbiol. 2010;64:203–221.
- Johnson JR, Johnston B, Kuskowski MA, et al. Intensity and mechanisms of Fluoroquinolone resistance within the H30 and H30Rx Subclones of Escherichia coli sequence type 131 compared with other Fluoroquinolone-resistant E. coli. Antimicrob Agents Chemother. 2015;59(8):4471–4480.
- Schroeder M, Brooks BD, Brooks AE. The complex relationship between virulence and antibiotic resistance. Genes (Basel). 2017 18;8(1):39.
- Rohde AM, Wiese-Posselt M, Zweigner J, et al. High admission prevalence of fluoroquinolone resistance in third-generation cephalosporin-resistant Enterobacteriaceae in German university hospitals. J Antimicrob Chemother. 2018;73(6):1688–1691.
- Stewardson AJ, Vervoort J, Adriaenssens N, et al. Effect of outpatient antibiotics for urinary tract infections on antimicrobial resistance among commensal Enterobacteriaceae: a multinational prospective cohort study. Clin Microbiol Infect. 2018;24(9):972–979.
- Trautner BW. Fluoroquinolones for urinary tract infection and within-household spread of resistant Enterobacteriaceae: the smoking gun. Clin Microbiol Infect. 2018;24(9):929–930.
- Tchesnokova VL, Rechkina E, Larson L, et al. Rapid and extensive expansion in the U.S. of a new multidrug-resistant escherichia coli clonal group, sequence type ST1193. Clin Infect Dis. 2018. DOI:10.1093/cid/ciy525
- Gumus D, Yoruk E, Kalayci-Yuksek F, et al. The effects of insulin and glucose on different characteristics of a upec: alterations in growth rate and expression levels of some virulence genes. Clin Lab. 2017;63(10):1589–1597.
- Gumus D, Kalayci-Yuksek F, Yoruk E, et al. Alterations of growth rate and gene expression levels of UPEC by antibiotics at sub-MIC. Folia Microbiol. 2018;63(4):451–457.
- Zamani H, Salehzadeh A. Biofilm formation in uropathogenic Escherichia coli: association with adhesion factor genes. Turk J Med Sci. 2018 23;48(1):162–167.
- Mobley HL, Island MD, Massad G. Virulence determinants of uropathogenic Escherichia coli and Proteus mirabilis. Kidney Int Suppl. 1994;47:S129–36.
- Yamamoto S, Terai A, Yuri K, et al. Detection of urovirulence factors in Escherichia coli by multiplex polymerase chain reaction. FEMS Immunol Med Microbiol. 1995;12(2):85–90.
- Yuri K, Nakata K, Katae H, et al. Distribution of uropathogenic virulence factors among Escherichia coli strains isolated from dogs and cats. Vet Med Sci. 1998;60(3):287–290.
- Elena SF, Whittam TS, Winkworth CL, et al. Genomic divergence of Escherichia coli strains: evidence for horizontal transfer and variation in mutation rates. Int Microbiol. 2005;8:271–278.
- Luthje P, Brauner A. Virulence factors of uropathogenic E. coli and their interaction with the host. Adv Microb Physiol. 2014;65:337–372.
- Kranz J, Schmidt S, Lebert C, et al. Uncomplicated bacterial communityacquired urinary tract infection in adults. Dtsch Arztebl Int. 2017;114(50):866–873.
- Kranz J, Schmidt S, Lebert C, et al. The 2017 update of the german clinical guideline on epidemiology, diagnostics, therapy, prevention, and management of uncomplicated urinary tract infections in adult patients. Part II: therapy and prevention. Urol Int. 2018;100(3):271–278.
- EUCAST The European Committee on Antimicrobial Susceptibility Testing. EUCAST disk diffusion - Manual v 7.0; 2018 [cited 2019 Jan 3]. Available from: http://www.eucast.org/
- Mazzulli T. Resistance trends in urinary tract pathogens and impact on management. J Urol. 2002;168:1720–17222.
- Miller C, Thomsen LE, Gaggero C, et al. SOS response induction by betalactams and bacterial defense against antibiotic lethality. Science. 2004;305(5690):1629–1631.
- Baharoglu Z, Garriss G, Mazel D. Multiple pathways of genome plasticity leading to development of antibiotic resistance. Antibiotics (Basel). 2013 30;2(2):288–315.
- Martinez-Martinez L, Fernandez F, Perea EJ. Relationship between haemolysis production and resistance to fluoroquinolones among clinical isolates of Escherichia coli. J Antimicrob Chemother. 1999;43:277–279.
- Vila J, Simon K, Ruiz J, et al. Are quinolone-resistant uropathogenic Escherichia coli less virulent? J Infect Dis. 2002;186:1039–1042.
- Horcajada JP, Soto S, Gajewski A, et al. Quinolone-resistant uropathogenic Escherichia coli strains from phylogenetic group B2 have fewer virulence factors than their susceptible counterparts. J Clin Microbiol. 2005;43(6):2962–2964.
- Adamus-Bialek W, Wojtasik A, Majchrzak M, et al. (CGG)4-based PCR as a Novel Tool for Uropathogenic Escherichia coli Discrimination: comparison with ERIC-PCR. J Clin Microbiol. 2009;47(12):3937–3944.
- Davies J, Spiegelman GB, Yim G. The world of subinhibitory antibiotic concentrations. Curr Opin Microbiol. 2006;9:445–453.
- Adamus-Białek W, Kubiak A, Czerwonka G. Analysis of uropathogenic Escherichia coli biofilm formation under different growth conditions. Acta Biochim Pol. 2015;62(4):765–771.
- Adamus-Bialek W, Lechowicz Ł, Kubiak-Szeligowska A, et al. A new look at the drug-resistance investigation of uropathogenic E. coli strains. Mol Biol Rep. 2017;44(1):191–202.
- Soto SM, Jimenez de Anta MT, Vila J. Quinolones induce partial or total loss of pathogenicity islands in uropathogenic Escherichia coli by SOS-dependent or -independent pathways, respectively. Antimicrob Agents Chemother. 2006;50(2):649–653.
- Zhanel GG, Hoban DJ, Harding GK. Subinhibitory antimicrobial concentrations: A review of in vitro and in vivo data. Can J Infect Dis. 1992;3(4):193–201.
- Goneau LW, Hannan TJ, MacPhee RA, et al. Subinhibitory antibiotic therapy alters recurrent urinary tract infection pathogenesis through modulation of bacterial virulence and host immunity. MBio. 2015 31;6(2).
- Ranieri MR, Whitchurch CB, Burrows LL. Mechanisms of biofilm stimulation by subinhibitory concentrations of antimicrobials. Curr Opin Microbiol. 2018 24;45:164–169.
- Odenholt I. Pharmacodynamic effects of subinhibitory antibiotic concentrations. Int J Antimicrob Agents. 2001;17:1–8.
- Smith DL, Harris AD, Johnson JA, et al. Animal antibiotic use has an early but important impact on the emergence of antibiotic resistance in human commensal bacteria. Proc Natl Acad Sci U S A. 2002;99:6434–6439.
- Yu X, Susa M, Knabbe C, et al. Development and validation of a diagnostic DNA microarray to detect quinolone-resistant Escherichia coli among clinical isolates. J Clin Microbiol. 2004;42(9):4083–4091.
- Cirz RT, Chin JK, Andes DR, et al. Inhibition of mutation and combating the evolution of antibiotic resistance. PLoS Biol. 2005;3(6):e176.
- Sanchez-Cespedes J, Saez-Lopez E, Frimodt-Mrller N, et al. Effects of a mutation in the gyrA gene on the virulence of uropathogenic Escherichia coli. Antimicrob Agents Chemother. 2015;59(8):4662–4668.
- Saito R, Sato K, Kumita W, et al. Role of type II topoisomerase mutations and AcrAB efflux pump in fluoroquinolone-resistant clinical isolates of Proteus mirabilis. J Antimicrob Chemother. 2006;58(3):673–677.
- Chang TM, Lu PL, Li HH, et al. Characterization of fluoroquinolone resistance mechanisms and their correlation with the degree of resistance to clinically used fluoroquinolones among Escherichia coli isolates. J Chemother. 2007;19(5):488–494.
- Fabrega A, Du Merle L, Le Bouguenec C, et al. Repression of invasion genes and decreased invasion in a high-level fluoroquinolone-resistant Salmonella typhimurium mutant. PLoS One. 2009;4(11):e8029.
- Marquet A, Vibet MA, Caillon J, et al. Is there an association between use of amoxicillin-clavulanate and resistance to third-generation cephalosporins in Klebsiella pneumoniae and Escherichia coli at the hospital level? Microb Drug Resist. 2018;24(7):987–994.
- Liu Y, Yang S, Xu H. The influence of cell and substratum surface hydrophobicities on microbial attachment. J Biotechnol. 2004;110:251–256.
- Michalak G, Głuszek K, Piktel E, et al. Polymeric nanoparticles – a novel solution for delivery of antimicrobial agents. Med Stud. 2016;32(1):56–62.
- Durkin MJ, Keller M, Butler AM, et al. an assessment of inappropriate antibiotic use and guideline adherence for uncomplicated urinary tract infections. Open Forum Infect Dis. 2018 10;5(9):ofy198.
- Jacoby GA. AmpC β-Lactamases. Clin Microbiol Rev. 2009;22(1):161–182.
- Yayan J, Ghebremedhin B, Rasche K. No development of imipenem resistance in pneumonia caused by Escherichia coli. Medicine (Baltimore). 2015;94(25):e1020.
- Roy S, Singh AK, Viswanathan R, et al. Transmission of imipenem resistance determinants during the course of an outbreak of NDM-1 Escherichia coli in a sick newborn care unit. J Antimicrob Chemother. 2011;66(12):2773–2780.
- Fomda BA, Khan A, Zahoor D. NDM-1 (New Delhi metallo beta lactamase-1) producing Gram-negative bacilli: emergence & clinical implications. Indian J Med Res. 2014;140(5):672–678.
- Grover SS, Doda A, Gupta N, et al. New Delhi metallo-β-lactamase - type carbapenemases producing Escherichia coli isolates from hospitalized patients: A pilot study. Indian J Med Res. 2017;146(1):105–110.
- Rahman M, Mukhopadhyay C, Rai RP, et al. Novel variant NDM-11 and other NDM-1 variants in multidrug-resistant Escherichia coli from South India. J Glob Antimicrob Resist. 2018;14:154–157.
- Mingeot-Leclercq MP, Glupczynski Y, Tulkens PM. Aminoglycosides: activity and resistance. Antimicrob Agents Chemother. 1999;43(4):727–737.
- Serpersu EH, Ozen C, Wright E. Studies of enzymes that cause resistance to aminoglycosides antibiotics. Methods Mol Med. 2008;142:261–271.
- Suzuki S, Horinouchi T, Furusawa C. Prediction of antibiotic resistance by gene expression profiles. Nat Commun. 2014;5:5792.
- Atac N, Kurt-Azap O, Dolapci I, et al. The role of AcrAB–tolC efflux pumps on quinolone resistance of E. coli ST131. Curr Microb. 2018;75(12):1661–1666.
- Horinouchi T, Suzuki S, Kotani H, et al. Prediction of Cross-resistance and collateral sensitivity by gene expression profiles and genomic mutations. Sci Rep. 2017;7(1):14009.
- Orden JA, Ruiz-Santa-Quiteria JA, Cid D, et al. Quinolone resistance in potentially pathogenic and non-pathogenic Escherichia coli strains isolated from healthy ruminants. J Antimicrob Chemother. 2001;48(3):421–424.
- Johnson JR, Kuskowski MA, Owens K, et al. Phylogenetic origin and virulence genotype in relation to resistance to fluoroquinolones and/or extended‑spectrum cephalosporins and cephamycins among Escherichia coli isolates from animals and humans. J Infect Dis. 2003;188:759–768.
- Johnson JR, Kuskowski MA, O’bryan TT, et al. Virulence genotype and phylogenetic origin in relation to antibiotic resistance profile among Escherichia coli urine sample isolates from Israeli women with acute uncomplicated cystitis. Antimicrob Agents Chemother. 2005;49:26–31.
- Moreno E, Prats G, Sabaté M, et al. Quinolone, fluoroquinolone and trimethoprim/sulfamethoxazole resistance in relation to virulence determinants and phylogenetic background among uropathogenic Escherichia coli. J Antimicrob Chemother. 2006;57:204–211.
- Da Silva GJ, Mendonça N. Association between antimicrobial resistance and virulence in Escherichia coli. Virulence. 2012;3:18–28.
- Sonbol FI, Khalil MA, Mohamed AB, et al. Correlation between antibiotic resistance and virulence of Pseudomonas aeruginosa clinical isolates. Turk J Med Sci. 2015;45(3):568–577.
- Derakhshan S, Pourzare M, Roshani D. Distribution of Virulence Factors According to Antibiotic Susceptibility among Escherichia coli Isolated from Urinary Tract Infection. Indian J Nephrol. 2018;28(3):191–197.
- Brzuszkiewicz E, Bruggemann H, Liesegang H, et al. How to become a uropathogen: comparative genomic analysis of extraintestinal pathogenic Escherichia coli strains. Proc Natl Acad Sci U S A. 2006;103:12879–12884.
- Dobrindt U, Agerer F, Michaelis K, et al. Analysis of genome plasticity in pathogenic and commensal Escherichia coli isolates by use of DNA arrays. J Bacteriol. 2003;185(6):1831–1840.
- Dobrindt U, Blum-Oehler G, Nagy G, et al. Genetic structure and distribution of four pathogenicity islands (PAI I(536) to PAI IV(536)) of uropathogenic Escherichia coli strain 536. Infect Immun. 2002;70(11):6365–6372.
- Blum G, Falbo V, Caprioli A, et al. Gene clusters encoding the cytotoxic necrotizing factor type 1, Prs-fimbriae and α-hemolysin from pathogenicity island II of the uropathogenic strain J96. FEMS Microbiol Lett. 1995;136:189–196.
- Swenson DL, Bukanov NO, Berg DE, et al. Two pathogenicity islands in uropathogenic Escherichia coli J96: cosmid cloning and sample sequencing. Infect Immun. 1996;64(9):3736–3743.
- Kao JS, Stucker DM, Warren JW, et al. Pathogenicity island sequences of pyelonephritogenic Escherichia coli CFT073 are associated with virulent uropathogenic strains. Infect Immun. 1997;65:2812–2820.
- Kanamaru S, Kurazono H, Ishitoya S, et al. Distribution and genetic association of putative uropathogenic virulence factors iroN, iha, kpsMT, ompT and usp in Escherichia coli isolated from urinary tract infections in Japan. J Urol. 2003;170:2490–2493.
- Kurazono H, Nakano M, Yamamoto S, et al. Distribution of the usp gene in uropathogenic Escherichia coli isolated from companion animals and correlation with serotypes and size-variations of the pathogenicity island. Microbiol Immunol. 2003;47:797–802.
- Schembri MA, Kjaergaard K, Sokurenko EV, et al. Molecular characterization of the Escherichia coli FimH adhesin. J Infect Dis. 2001;183(Suppl 1):S28–31.
- Bahrani-Mougeot FK, Buckles EL, Lockatell CV, et al. Type 1 fimbriae and extracellular polysaccharides are preeminent uropathogenic Escherichia coli virulence determinants in the murine urinary tract. Mol Microbiol. 2002;45(4):1079–1093.
- Dobrindt U, Blum-Oehler G, Hartsch T, et al. S-Fimbria-encoding determinant sfa(I) is located on pathogenicity island III(536) of uropathogenic Escherichia coli strain 536. Infect Immun. 2001;69:4248–4256.
- Kurazono H, Yamamoto S, Nakano M, et al. Characterization of a putative virulence island in the chromosome of uropathogenic Escherichia coli possessing a gene encoding a uropathogenic-specific protein. Microb Pathog. 2000;28:183–189.
- Parret AHA, De Mot R. Escherichia coli’s uropathogenic-specific protein: a bacteriocin promoting infectivity? Microbiology-Sgm. 2002;148:1604–1606.
- Nipic D, Podlesek Z, Budic M, et al. Escherichia coli uropathogenic-specific protein, Usp, is a bacteriocin-like genotoxin. J Infect Dis. 2013;208(10):1545–1552.
- Yokoyama K, Kim H, Mukai T, et al. Impact of amino acid substitutions in B subunit of DNA Gyrase in Mycobacterium leprae on Fluoroquinolone resistance. PLoS Negl Trop Dis. 2012;6(10):e1838.
- Hsu YH, Chung MW, Li TK. Distribution of gyrase and topoisomerase IV on bacterial nucleoid: implications for nucleoid organization. Nucleic Acids Res. 2006;34(10):3128–3138.
- Cheung KJ, Badarinarayana V, Selinger DW, et al. A microarray-based antibiotic screen identifies a regulatory role for supercoiling in the osmotic stress response of Escherichia coli. Genome Res. 2003;13(2):206–215.
- Charpentier X, Polard P, Claverys JP. Induction of competence for genetic transformation by antibiotics: convergent evolution of stress responses in distant bacterial species lacking SOS? Curr Opin Microbiol. 2012;15:570–576.
- Zgur-Bertok D. DNA damage repair and bacterial pathogens. PLoS Pathog. 2013;9(11):e1003711.
- Kaplan JB. Antibiotic-induced biofilm formation. Int J Artif Organs. 2011;34:737–751.
- Liu JH, Pan YS, Yuan L, et al. Genetic variations in the active efflux pump genes acrA/B and tolC in different drug-induced strains of Escherichia coli CVCC 1547. Genet Mol Res. 2013;12(3):2829–2836.
- Krasowska A, Sigler K. How microorganisms use hydrophobicity and what does this mean for human needs? Front Cell Infect Microbiol. 2014;4:112.
- Erdeljan P, MacDonald KW, Goneau LW, et al. Effects of subinhibitory concentrations of ciprofloxacin on Staphylococcus saprophyticus adherence and virulence in urinary tract infections. J Endourol. 2012;26(1):32–37.
- Kaplan JB, Izano EA, Gopal P, et al. Low levels of β-lactam antibiotics induce extracellular DNA release and biofilm formation in Staphylococcus aureus. MBio. 2012;3(4):e00198–12.
- Wnorowska U, Wątek M, Durnaś B, et al. Extracellular DNA as an essential component and therapeutic target of microbial biofilm. Med Stud. 2015;31(2):132–138.
- Mlynek KD, Callahan MT, Shimkevitch AV, et al. Effects of Low-Dose Amoxicillin on Staphylococcus aureus USA300 Biofilms. Antimicrob Agents Chemother. 2016 22;60(5):2639–2651.
- Aka ST, Haji SH. Sub-MIC of antibiotics induced biofilm formation of Pseudomonas aeruginosa in the presence of chlorhexidine. Braz J Microbiol. 2015;46(1):149–154.
- Bagge N, Schuster M, Hentzer M, et al. Pseudomonas aeruginosa biofilms exposed to imipenem exhibit changes in global gene expression and beta-lactamase and alginate production. Antimicrob Agents Chemother. 2004;48(4):1175–1187.
- Silveira WD, Benetti F, Lancellotti M, et al. Biological and genetic characteristics of uropathogenic Escherichia coli strains. Rev Inst Med Trop. 2001;43:303–310.
- Dewan KK, Skarlupka AL, Rivera I, et al. Development of macrolide resistance in Bordetella bronchiseptica is associated with the loss of virulence. J Antimicrob Chemother. 2018;73(10):2797–2805.
- Nucleo E, Steffanoni L, Fugazza G, et al. Growth in glucose-based medium and exposure to subinhibitory concentrations of imipenem induce biofilm formation in a multidrug-resistant clinical isolate of Acinetobacter baumannii. BMC Microbiol. 2009;9:270.
- Dhabaan GN, AbuBakar S, Cerqueira GM, et al. Imipenem treatment induces expression of important genes and phenotypes in a resistant Acinetobacter baumannii isolate. Antimicrob Agents Chemother. 2016;60:1370–1376.
- Novovic K, Mihajlovic S, Dinic M, et al. Acinetobacter spp. porin Omp33–36: classification and transcriptional response to carbapenems and host cells. PLoS One. 2018;13(8):e0201608.