
ABSTRACT
The molecular repertoire of Trypanosoma cruzi effects its virulence and impacts the clinical course of the resulting Chagas disease. This study aimed to determine the mechanism underlying the pathogenicity of T. cruzi. Two T. cruzi cell lines (C8C3hvir and C8C3lvir), obtained from the clone H510 C8C3 and exhibiting different virulence phenotypes, were used to evaluate the parasite’s infectivity in mice. The organ parasite load was analysed by qPCR. The proteomes of both T. cruzi cell lines were compared using nLC-MS/MS. Cruzipain (Czp), complement regulatory protein (CRP), trans-sialidase (TS), Tc-85, and sialylated epitope expression levels were evaluated by immunoblotting. High-virulence C8C3hvir was highly infectious in mice and demonstrated three to five times higher infectivity in mouse myocardial cells than low-virulence C8C3lvir. qPCR revealed higher parasite loads in organs of acute as well as chronically C8C3hvir-infected mice than in those of C8C3lvir-infected mice. Comparative quantitative proteomics revealed that 390 of 1547 identified proteins were differentially regulated in C8C3hvir with respect to C8C3lvir. Amongst these, 174 proteins were upregulated in C8C3hvir and 216 were downregulated in C8C3lvir. The upregulated proteins in C8C3hvir were associated with the tricarboxylic acid cycle, ribosomal proteins, and redoxins. Higher levels of Czp, CRP, TS, Tc-85, and sialylated epitopes were expressed in C8C3hvir than in C8C3lvir. Thus, T. cruzi virulence may be related to virulence factor expression as well as upregulation of bioenergetic and biosynthetic pathways proteins.
Introduction
The protozoan parasite Trypanosoma cruzi is the causal agent of Chagas disease, a public health problem affecting 6–8 million people worldwide [Citation1]. Of these, millions of patients with chronic infections are at a further risk of developing cardiac pathologies, thus rendering Chagas disease as one of the main causes of heart disease and early mortality, especially in South America [Citation2].
T. cruzi virulence involves metacyclogenesis, which allows the transformation of the parasite into metacyclic forms that infect different cell types as well as proliferate and evade the host immune response [Citation3]. Several T. cruzi proteins involved in virulence and immune evasion have been described, and are collectively denoted as virulence factors. Amongst these, cysteine proteases such as cruzipain (Czp), and members of the Gp85/trans-sialidase (TS) family, including Tc-85 (a surface glycoprotein specific to the trypomastigote stage of T. cruzi), complement regulatory protein (CRP), and TS, are well-known T. cruzi virulence factors [Citation4,Citation5]. Although the specific role of each virulence factor remains uncertain, experimental evidence has led to a comprehensive and integrated understanding of the impact of virulence factors on T. cruzi infection [Citation5].
Elucidating the virulence of T. cruzi is challenging because of the parasite’s intricate biology, including unique gene expression mechanisms, an absence of processes regulating the initiation of transcription, and the existence of two distinct infective stages in the vertebrate host: the metacyclic trypomastigotes (MTs) stage and the bloodstream trypomastigotes stage [Citation6]. Furthermore, T. cruzi, being a genetically heterogeneous parasite species, comprises a wide variety of strains and isolates vectored by different species of triatomines and therefore capable of infecting varied warm-blooded vertebrates [Citation7]. This significant biological diversity is associated with differences in virulence and clinical symptoms across strains [Citation8]. Currently, T. cruzi is classified into seven discrete typing units (DTUs), including TcI – VI and Tcbat [Citation2,Citation9]. Although pathogenicity may be modulated through diverse mechanisms in various T. cruzi strains [Citation5], the higher virulence of some strains could be attributed most likely to the differential expression of some virulence factors [Citation5]. Numerous parasitic components have been suggested to participate in this pathogenic mechanism, however, the molecular basis of the pathogen’s virulence remains unclear [Citation3].
Several studies have compared high- and low-virulence T. cruzi strains as well as clones derived from the same T. cruzi strain [Citation3,Citation10–13], but no definitive evidence has been obtained regarding the molecular basis of the pathogen’s virulence. This may be a consequence of the diversity of T. cruzi strains used in different studies or the high level of variation in the genetic background of DTU isolates. Notably, strains used in previous studies were obtained from several hosts and different locations of the American continent [Citation14,Citation15]. Therefore, a suitable model for investigating the virulence of T. cruzi is needed to determine whether the parasite’s virulence could be related to the expression levels of a single virulence factor (or a group of the same) and/or reprogramming of biochemical processes linked to their expression, such as those associated with the generation of energy. Studies on T. cruzi cell lines derived from the same clone, but exhibiting different virulent phenotypes, could contribute to a better understanding of the molecular basis of such differences.
The goal of this study was to evaluate the contribution of previously identified virulence factors of T. cruzi, including Czp, TS, CRP, and Tc-85, to the pathogen’s virulence, using tissue culture-derived trypomastigotes (TCTs) derived from two genetically related T. cruzi cell lines that exhibit contrasting virulent and pathogenic characteristics. Applying a proteomics approach, this study elucidated the biological implications of the observed differences between the two cell lines and their potential relationship with the pathogen’s virulence.
Material and methods
Ethical approval
All experiments involving animals were performed in accordance with the guidelines of the Ethics Committee in Scientific Research (approval CEIC REV/2016) and Institutional Ethics Committee for Animal Experimentation (approval CEIC REV/2013) of the University of Antofagasta, Chile.
Parasite cell lines and cell culture
The T. cruzi H510 C8C3 clone was used in all experiments [Citation16]. It was generated from the T. cruzi House 510 strain, which was retrieved from Costa Rican Triatoma dimidiata [Citation17]. Clonal cells were subjected to different treatments to generate the two cell lines used in the study. For the first treatment, clone cells were passaged in BALB/c mice once per week, for 30 years, following which the cells were subjected to periodic passages in BALB/c mice and Vero cells (T. cruzi H510 C8C3hvir cell line). A second culture of clone cells was maintained in liver infusion tryptose (LIT) medium throughout the same 30 years, following which it was cultured cyclically in the LIT medium [Citation18] and Vero cells (T. cruzi H510 C8C3lvir cell line).
To obtain TCTs, Vero cells were infected with either of the two T. cruzi cell lines at a parasite: cell ratio of 5:1 for over 3 h. Cell cultures were then washed and incubated in RPMI 1640 medium supplemented with 2% foetal bovine serum [Citation19]. After five days, the cell culture supernatants, highly enriched in TCTs, were collected by centrifugation and used for further experiments.
Genotyping of T. cruzi C8C3hvir and C8C3lvir cell lines
DNA was isolated from TCTs of T. cruzi C8C3hvir and C8C3lvir cell lines using the Wizard Genomic DNA Purification Kit (Promega, Madison, WI, USA) according to the manufacturer’s instructions. Cell line genotyping was performed by PCR amplification of the 18S rRNA gene followed by DNA sequencing, as previously described [Citation20]. Sequences were aligned using ClustalW software [Citation21] and phylogenetic trees was constructed using MEGA X software [Citation22] by the bootstrap method with 500 replicates. Maximum likelihood analysis was performed using a general time reversible substitution model. The topologies of the phylogenetic trees were confirmed using the neighbour-joining method with a p-distance matrix.
TCT invasion assay
Neonatal mice were sacrificed and their myocardial cells were harvested according to a previously reported method [Citation23]. The myocardial cells were then seeded at a density of 5 × 10⁴ cells/well using 4-well Lab-Tek Chamber Slides (Nunc, Thermo Fisher Scientific, Roskilde, Denmark).
The TCT invasion assay was conducted according to a previously reported method 19 using a parasite: cell ratio of 5:1. Following incubation for 3 h at 37 0C, the myocardial cells were washed thrice with phosphate-buffered saline (PBS), fixed with paraformaldehyde, and stained with propidium iodide. The number of parasites present in 500 cardiomyocytes was observed using a BX51 fluorescence microscope (Olympus Corporation, Tokyo, Japan).
Parasite proliferation and metacyclogenesis
Epimastigotes from either the T. cruzi C8C3hvir or C8C3lvir cell line were cultured in LIT medium at a cell density of 1 × 10⁶ parasites/mL 18. The epimastigote growth curve was determined by counting the number of parasites every two days for 10 days. After culturing for seven days, metacyclogenesis was evaluated based on kinetoplast shapes and positions in smears treated with Giemsa stain. Additionally, metacyclogenesis was evaluated in the T. cruzi C8C3hvir cell line cultured in LIT medium in the presence or absence of the cysteine protease inhibitor E-64d, according to a previously described method [Citation24]. All experiments were performed in triplicate.
TCT infection and parasitaemia curves
Four-to-six-week-old female BALB/c mice were inoculated with TCTs derived from either the T. cruzi C8C3hvir or C8C3lvir cell line through intraperitoneal injection (1 × 10⁵ parasites/mouse; 5 mice/treatment group). Presence of parasitaemia was recorded every second day, beginning the second day after inoculation, according to a previously described method [Citation25]. The experimental series was suspended on day 18, as the C8C3hvir-infected mice began to perish on day 20. Mice with acute or chronic infection were sacrificed, followed by collection of the heart, lung, and liver, as well as tissue samples from the quadriceps muscle, for DNA isolation. The presence of T. cruzi in organs and/or tissues was detected by qPCR, according to a previously described method [Citation26]. In order to demonstrate the infectivity of the C8C3lvir cell line, mice were infected in groups of five as described above, and, thereafter, five days following infection, treated with three cycles of cyclophosphamide (Endoxan, Baxter Oncology, GmbH, Halle, Germany) at 50 mg/kg of body weight, according to a previously described method [Citation27].
DNA isolation and real-time quantitative PCR
Total genomic DNA was extracted from the organs and quadriceps muscle tissues of the infected mice using the Wizard Genomic DNA Purification Kit (Promega), according to the manufacturer’s instructions. The DNA concentration was quantified using an Infinite 200 PRO UV spectrophotometer (Tecan, Männedorf, Switzerland) and adjusted to 25 ng/μL.
Real-time PCR analysis was performed according to a previously described method [Citation26]. The primers used were specific either for T. cruzi 195-bp repeat DNA sequences (TCZ-F: 5′-GCTCTTGCCCACAMGGGTGC-3′, where M = A or C and TCZ R: 5′-CCAAGCAGCGGATAGTTCAGG-3′), generating a 182-bp product, or for murine-specific tumour necrosis factor-α (TNF-α) (TNF-5241: 5′-TCCCTCTCATCAGTTCTATGGCCCA-3′ and TNF-5411: 5′-CAGCAAGCATCTATGCACTTAGACCCC-3′), amplifying an internal endogenous control gene to generate a 170-bp product [Citation26]. The thermal cycling program carried out using the Eco Real-Time PCR system (Illumina Inc., San Diego, CA, USA) was as follows: denaturation at 95 °C for 10 min, followed by 40 cycles of 94 °C for 15 s, and 64.3 °C for 1 min, with fluorescence recording at 64.3 °C. Real-time amplification was followed by an initial denaturation step of 15 s at 95 °C, cooling to 60 °C for 1 min, and thereafter, a stepwise temperature increase of 0.3 °C/s from 60 to 95 °C. qPCR analysis of each sample included a standard curve and two negative controls. The negative controls comprised a reaction mixture containing T. cruzi- or murine-specific primers and from which parasite DNA was omitted or DNA from non-infected mouse tissues was included. All DNA samples were analysed in triplicate. The mean quantification values for T. cruzi DNA were normalized based on the data collected using murine-specific (TNF-α) primers and applying the following equation:
Normalized value = (mean of T. cruzi DNA value/mean of TNF-α DNA value) × 1000
where “1000” corresponds to the expected value of TNF-α derived from 30 mg of heart tissue. The amplification efficiencies were evaluated automatically by StepOne™ Software v2.0, using the following equation [Citation28]:
Efficiency (E) = 10(−1/slope)
Preparation of trypomastigote lysates and in-gel protein digestion
TCTs derived from T. cruzi C8C3hvir or C8C3lvir cell lines were recovered from the cell culture supernatant by centrifugation at 200 × g for 10 min, followed by a single wash in PBS and another round of centrifugation. Thereafter, the supernatant was discarded and the trypomastigote pellet quick-frozen in liquid nitrogen and stored at −80 °C until further use. Prior to use, the pellet, containing 5 × 10⁷ TCTs, was resuspended in 1.5 mL ice-cold purified water (Milli-Q) containing 1.5 mL trifluoroethanol (Sigma-Aldrich, Taufkirchen, Germany).
The TCTs protein extract was diluted with up to 50 µL sample buffer and then subjected to SDS-PAGE (1 mm thick, 4% stacking, and 10% resolving). The gel was stained with Coomassie blue dye, each run line was excised and cut into small pieces (2 mm × 2 mm), which were then transferred to microcentrifuge tubes [Citation29]. Thereafter, the gel pieces were bleached in a solution of acetonitrile (ACN): water at a 1:1 ratio. Subsequently, the proteins in the gel pieces were reduced by incubating in 10 mM DTT for 1 h at 56 °C, and then alkylated by adding 10 mM iodoacetamide followed by incubation at 20 °C for 30 min in complete darkness. Thereafter, the proteins were subjected to in situ digestion using sequencing-grade trypsin (Promega, Madison, WI, USA), according to a previously described method [Citation30]. Briefly, the gel pieces were shrunk by adding ACN, which was subsequently removed, and the pieces dried in a vacuum concentrator. The dried gel pieces were thereafter re-swollen in 100 mM Tris-HCl pH 8 containing 10 mM CaCl2. This was followed by the addition of trypsin (60 ng/µL) to the mixture, at a protein: enzyme ratio of 5:1 (w/w). The mixture was then maintained at 4 °C for 2 h followed by incubation at 37 °C for 12 h. Finally, trypsin digestion was interrupted by adding 1% trifluoroacetic acid (TFA). Thereafter, salts were removed using OMIX C18 pipette tips (Agilent Technologies, Santa Clara, CA, USA). The digested proteins were dried, solubilized in 10 µL 0.1% formic acid, and subjected to mass spectrometric analysis.
Reverse phase-liquid chromatography-tandem mass spectrometry (RP-LC-MS/MS) analysis
The peptide mixture was analysed by RP-LC-MS/MS using the Easy-nLC II system combined with an ion trap LTQ-Orbitrap-Velos-Pro hybrid mass spectrometer (Thermo Fisher Scientific, Waltham, MA, USA). The peptides were concentrated (on-line) by reverse phase chromatography using a 0.1 mm × 20 mm C18 RP precolumn (Thermo Fisher Scientific), and then separated using a 0.075 mm × 250 mm C18 RP column (Thermo Fisher Scientific) operating at a flow rate of 0.3 μL/min. The peptides were eluted using the following dual gradient: 5–25% solvent B for 135 min, 25–40% solvent B for 45 min, 40–100% solvent B for 2 min, and 100% solvent B for 18 min (solvent A: 0.1% formic acid in water, solvent B: 0.1% formic acid and 80% ACN in water). Mass spectrometric analysis was conducted using electrospray ionization with a Nanobore stainless steel emitter (30 μm ID; Proxeon Biosciences, Roskilde, Denmark) at a spray voltage of 2.1 kV, an S-Lens of 60%, and resolution set to 30,000 [Citation31].
Peptides were tracked in survey scans from 400 to 1600 amu (1 μscan), followed by 20 data-dependent MS/MS scans, using an isolation width of 2 u (mass-to-charge ratio units), normalized collision energy of 35%, and dynamic exclusion applied in 60 second periods. Unassigned and individually charged protonated ions were rejected by charge-state screening. Three replicates were generated for each T. cruzi cell line, producing a total of six runs.
Protein data analysis
Raw data were imported for protein identification and quantification using the MaxQuant version 1.6.17 software [Citation32]. Protein identification was performed using the Andromeda database search engine (19 October 2020 release) against UniProt entries for T. cruzi (TCC strain: 22,532 entries; Dm28c strain: 11,346 entries; and CL Brener strain: 19,242 entries). Carbamidomethylation of cysteine (57.021464 Da) was selected as a fixed modification, whereas oxidation of methionine (15.994915 Da) and N-terminal acetylation protein (42.010565 Da), were selected as variable modifications. Enzyme specificity was set to full trypsin with a maximum of two missed cleavages. The minimum peptide length was set to seven amino acids. Label-free Quantification (LFQ), using the “match-between-runs” feature in MaxQuant, was used to identify transfer between samples based on the retention time and accuracy of mass, with a match time window of 0.7 min and alignment time window of 20 min. Protein quantification was performed based on LFQ, and protein abundance was calculated based on the normalized spectral protein intensity (LFQ intensity).
Statistical analysis of the quantified proteins was performed using the Perseus version 1.6.14.0 software. Potential contaminants, and proteins identified only by site or in the reverse database, were excluded from further analysis. The LFQ intensity was log2-transformed, samples were categorized by group (C8C3hvir or C8C3lvir), and a filter of two valid values in at least one group, was applied. Student’s t-test, followed by Benjamini-Hochberg correction (false discovery rate-adjusted p-value <0.05), was applied to the data. A significant difference in the expression of a protein between groups was considered to indicate a regulated protein. In addition, principal component analysis (PCA) was performed, and volcano plots and heatmaps constructed, to visualize protein expression patterns.
Gene ontology (GO) and enriched pathway analyses were performed using the TritrypDB platform (https://tritrypdb.org/tritrypdb/app), REVIGO algorithm (doi:10.1371/journal.pone.0021800) (http://revigo.irb.hr/), KEGG database (https://doi.org/10.1093/nar/gkv1070), MetaCyc database (doi: 10.1186/1471–2105-14-112), and the GOsummaries package in R (doi.org/10.12688/f1000research.6925.1). A q-value threshold of 0.05 (Benjamini-Hochberg corrected), was used. Analyses were performed separately for proteins identified as upregulated or downregulated between groups. Bioinformatics analysis was performed using the DAVID version 6.8 software (10.1038/nprot.2008.211) to assess clusters related to differentially regulated proteins. STRINGS tool (https://string-db.org/) (10.1093/nar/gky1131) and Omics Visualizer software (10.12688/f1000research.22280.2) were used to construct the protein interaction network, with T. cruzi selected as the organism and the confidence interaction set to 0.150. Sparse partial least squares discriminant analysis (PLS-DA) was performed to classify samples into known groups and identify key variables that drive discrimination using the mixOmics package in R (https://doi.org/10.1371/journal.pcbi.1005752).
SDS-PAGE, 2-D gel electrophoresis, and immunoblotting
TCTs (C8C3hvir or C8C3lvir) were lysed in 1 × PBS with 0.1% NP-40 containing cOmplete™ Mini EDTA-free Protease Inhibitor Cocktail (Thermo Fisher Scientific, Rockford, IL, USA) followed by determination of the protein concentration using the Bradford assay [Citation33]. Proteins in the parasite extracts were separated by SDS-PAGE on a 12% acrylamide gel and transferred to nitrocellulose membranes using the Trans-Blot Turbo Transfer System (Bio-Rad Laboratories, Hercules, CA, USA). The membranes were incubated with an anti-T. cruzi Czp polyclonal antibody [Citation34], mouse polyclonal antibody against recombinant CRP [Citation35], or monoclonal antibody 39 against TS [Citation36]. Anti-mouse or anti-rabbit IgG peroxidase-labelled antibodies were used as secondary antibodies. Immunoblot reactivity was detected by enhanced chemiluminescence assay (ECL; Thermo Fisher), and images were captured using the DNR Bio-Imaging System (DNR Bio-Imaging Systems, Ltd., Neve Yamin, Israel) with Gel-Capture software.
For 2-D gel electrophoresis, parasite proteins were precipitated with 10% trichloroacetic acid, and thereafter, 50 μg protein was placed onto 7 cm ReadyStrip IPG strips (pH 3–5, 4–7, and 3–10 non-linear; Bio-Rad Laboratories). The IPG strips were then rehydrated for 12 h at 20 °C and First-dimension isoelectric focusing (IEF) was performed using a Protean IEF Cell (Bio-Rad Laboratories) in a three-step procedure: 100 V for 1 h, 500 V for 1 h, and 4000 V until completion, for a total of 10,000 V h. Following IEF, the IPG strips were balanced and used for the second dimension. Thereafter, the IPG strips were loaded onto a 12% polyacrylamide gel and proteins resolved by SDS-PAGE. The proteins were then transferred onto nitrocellulose membranes for immunoblot detection using polyclonal antibodies against Czp and monoclonal antibodies against TS [Citation37], Tc-85 [Citation38], and CRP [Citation39]. Images from the immunoblots were captured using the DNR Bio-Imaging System, as described above. To demonstrate that identical amounts of proteins were loaded in all lanes of each gel, the membranes were incubated with 50 mL stripping buffer (2% (w/v) SDS, 62.5 mM Tris, pH 6.7, and 100 mM 2-mercaptoethanol) for 1 h at 60°C in an orbital shaker. Thereafter, the membranes were washed six times with Tris buffer saline (TBS)-Tween 0.3% for 10 min each, blocked with 5% TBS-milk, and incubated with a mouse monoclonal antibody against β actin (Abcam, Cambridge, UK). ImageJ v2.0 software was used to perform densitometric analysis of the immunoblots, in which expression was normalized to that of β actin (loading control). In order to obtain consistent results, each experiment was performed at least in triplicate.
Complement mediated-lysis (CML) assay
The CML assay was performed according to a previously described method [Citation40]. Briefly, TCTs from either the T. cruzi C8C3hvir or C8C3lvir cell line (5.0 × 10⁶ parasites/100 μL serum-free RPMI) were incubated with either 100 μL 50% normal human serum or RPMI alone (as a negative control) for 30 min at 37 °C. Samples were then stained with trypan blue, and the percentage of lysed cells was determined in a Neubauer chamber using light microscopy. All experiments were performed in triplicate.
Detection of enzymatic activities
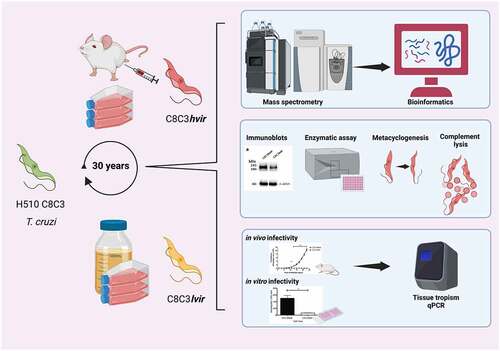
To investigate the Czp activity, TCTs or epimastigotes derived from T. cruzi cell lines (C8C3hvir or C8C3lvir) were collected by centrifugation and lysed in PBS by sonication. The protein concentration of the soluble extract was determined according to a previously described method [Citation33]. TCT proteins (100 μg) were immunoprecipitated using a polyclonal anti-Czp antibody, according to a previously described method [Citation41]. Cysteine proteinase activity in the immunoprecipitate was detected by incubation with 10 μM Z-Phe-Arg-AMC (Sigma-Aldrich, St. Louis, MO, USA). Enzymatic activity was measured using an Infinite M200 PRO spectrofluorometer (Tecan) at an excitation wavelength of 353 nm and emission wavelength of 442 nm [Citation42]. TS activity was determined according to a previously described method [Citation43]. Briefly, parasite extracts were prepared and the TS activity of 50 µg total protein was measured using the Amplex™ Red Neuraminidase (Sialidase) Assay Kit (Thermo Fisher Scientific) according to the manufacturer’s instructions. Fluorescence was evaluated using the Infinite M200 PRO spectrofluorometer at an excitation wavelength of 540 nm and emission wavelength of 590 nm. The experimental approach developed in this study is illustrated in .
Figure 1. Experimental design to study C8C3hvir and C8C3lvir Trypanosoma cruzi cell lines and compare biological behaviour, proteomics profile, and virulence factor expression. T. cruzi tissue culture-derived trypomastigotes from both cell lines were used to infect BALB/c mice and evaluate parasitaemia curves and parasite loads in organs and tissues of acute and chronically infected mice. Metacyclogenesis was also studied. Trypomastigotes were lysed and supernatants were submitted to SDS-PAGE. Total proteins were in-gel digested by trypsin. Tryptic peptides were analysed by label-free quantitative mass spectrometry-based proteomics. The entire workflow was performed in triplicate for each T. cruzi cell line. Virulence factor protein expression was evaluated by immunoblotting. Cruzipain and transialidase enzymatic activity were measured. Created with Biorender.Com.
Statistical analysis
Statistical analysis was conducted using the GraphPad Prism version 9.0.1 (128) software (GraphPad Software, San Diego, Ca, USA). Student’s t-test and ANOVA were applied and significant differences, in infectivity or cell invasion capabilities, between T. cruzi C8C3hvir and C8C3lvir cell lines, were determined. P-values <0.05 were considered to be statistically significant. Survival analysis was calculated by the Kaplan-Meier method.
Results
T. cruzi C8C3hvir is highly infectious in mice and mouse cardiomyocytes
Parasitaemia curves were evaluated after mice were infected with TCTs derived from either the T. cruzi C8C3hvir or C8C3lvir cell lines (). C8C3hvir-infected mice exhibited high parasitaemia, reaching a peak on day 23 post-infection. Further, 80% of infected mice died between day 20 and 25 post-infection (Figure S1A). In contrast, C8C3lvir-infected mice displayed very low or subpatent parasitaemia during the experiment and survived for more than 60 days post-infection (). However, mice immunosuppressed by cyclophosphamide treatment exhibited moderate parasitaemia compared to the control group, which exhibited subpatent parasitaemia (Figure S1B). The results of the in vitro cell invasion assay demonstrated that TCTs derived from the C8C3hvir cell line were three to five times more infectious in mouse cardiomyocytes than those from the C8C3lvir cell line ().
Figure 2. In vitro and in vivo infectivity of T. cruzi C8C3hvir and C8C3lvir cell lines. (a) Parasitemia curves of mice infected with trypomastigotes from either C8C3hvir or C8C3lvir. Results are expressed as the mean ± SD and represent at least 3 experiments performed in triplicate. ** P < 0.01, *** P < 0.001; Two-way ANOVA. (b) Cardiomyocytes were infected with trypomastigotes from either C8C3hvir or C8C3lvir cell lines, using a parasite/cell ratio 5:1. After 3 h, cultures were washed three times with PBS. and stained with propidium iodide. Results are expressed as the mean ± SD of parasites/500 cells from three experiments performed in triplicate. * P < 0.01; Student’s t-test.
Mice infected with T. cruzi C8C3hvir display high parasite loads in muscle and heart tissues
The parasite load in heart tissues collected from mice acutely infected with C8C3hvir was nine times that in heart tissues of those acutely infected with C8C3lvir (). Similar results were obtained in case of chronically infected mice, wherein the heart tissues of C8C3hvir-infected mice had a higher parasite load than those of C8C3lvir-infected mice (). Similarly, the parasite load was significantly higher in the liver tissues of mice acutely infected with C8C3hvir, being six times that in the liver tissues of C8C3lvir-infected mice (). Similar results were obtained in case of chronically infected mice, wherein the liver tissues of C8C3hvir-infected mice had a higher parasite load than those of C8C3lvir-infected mice (). Notably, the parasite load in the muscle tissues of mice acutely infected with C8C3hvir was highest amongst all tissues investigated, and was also higher than that in muscle tissues of C8C3lvir-infected mice, reaching levels of 4.0 × 10⁵ parasites/ng DNA. Similar results were observed in case of muscle tissues of chronically infected mice wherein an increased parasite load was observed in the quadriceps tissues of mice infected with C8C3hvir. (). The parasite load in the lung tissues of mice acutely infected with C8C3hvir was three times that in the lungs of C8C3lvir-infected mice. However, no differences were observed between the parasite load in the lung tissues of mice chronically infected with C8C3hvir or C8C3lvir ().
Figure 3. Organ and tissue parasitic load of mice infected with either T. cruzi C8C3hvir or C8C3lvir cell lines. Acutely or chronically infected mice were sacrificed and parasite load (parasites/50 ng DNA) was determined by qPCR in (a) heart, (b) liver, (c) quadriceps muscle, and (d) lung. The limit of detection was 0.1 parasite equivalent/50 ng DNA. Results are expressed as the mean ± SD and represent three experiments performed in triplicate. * P <0,01, ** P < 0,01 *** P < 0,001; Student’s t-test.
Epimastigotes derived from T. cruzi C8C3hvir cell line display a high rate of metacyclogenesis
Epimastigotes derived from the C8C3lvir cell line displayed a higher capacity to proliferate in LIT medium than those derived from the C8C3hvir cell line, which replicated at a slower rate. These results suggested that the rapid growth of epimastigotes derived from the C8C3lvir cell line was due to their better adaptation to LIT medium (). In contrast, C8C3hvir cells displayed a higher epimastigotes to MTs differentiation rate (approximately 50%) after culturing for 10 days than C8C3lvir cells, which showed a very low differentiation rate (approximately 8%) (). Notably, the ability of different species of triatomines to generate metacyclic forms is of great importance in the transmission of parasitic infections [Citation44].
Figure 4. Epimastigote proliferation curve and metacyclogenesis of T. cruzi C8C3hvir and C8C3lvir cell lines. (a) Epimastigote growth. Results are expressed as the mean ± SD and represent at least three experiments performed in triplicate. ***P < 0.001; Two-way ANOVA. (b) Epimastigote differentiation into metacyclic trypomastigotes. Results are expressed as the mean ± SD and represent at least three experiments performed in triplicate. *P < 0.05; Student’s t-test.
T. cruzi clone H510 C8C3 belongs to DTU TcIa
The typing of the T. cruzi cell lines was performed by PCR amplification followed by DNA sequencing. PCR amplification of mini-exon repetitive region units, which are DTU TcIa markers, confirmed that this region is conserved and that clone H510 C8C3 belongs to the DTU TcI. Amplification of the V7/V8 region of the ribosomal subunit gene (SSU RNA) [Citation45] further supported these results. The phylogenetic tree depicted that both C8C3hvir and C8C3lvir were clustered within the TcI branch (Figure S2). As expected, the percentage identity between the two variants was high (99%). These results confirmed that C8C3hvir and C8C3lvir are genetically related and share a common origin (Figure S2).
Comparative proteomic analysis of T. cruzi C8C3hvir and C8C3lvir cell lines
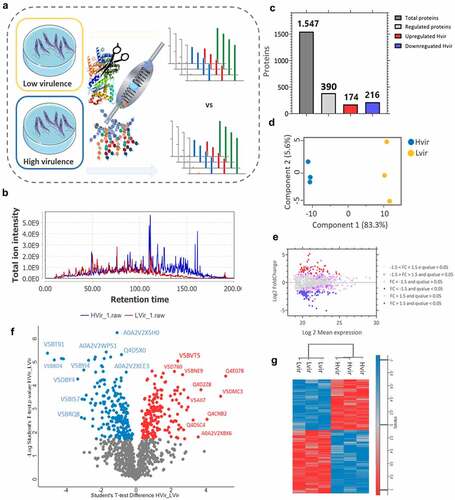
Protein extracts of C8C3hvir as well as C8C3lvir cell lines were subjected to mass spectrometry, and the data were mapped (using MaxQuant software) using concatenated databases for the Dm28c, TCC, and CL Brener T. cruzi strains (). The chromatographic elution profiles of peptides derived from both the T. cruzi cell lines are shown in . A summary of the identified proteins is shown in . A total of 1,547 proteins were identified, of which 390 were considered to be regulated. Of these, 174 proteins were upregulated in the C8C3hvir cell line whereas 216 were downregulated in the C8C3lvir cell line (). The PCA results indicated differences between the two parasite cell lines (), with a clear demarcation between two distinct groups, based on the proteome profile. The results of the MAplot and volcano plot of protein expression are shown in , respectively. Collectively, these results indicated that the proteins with the greatest variation in expression between the two parasite cell lines included prostaglandin F2α synthase, phosphate dikinase, chaperonin HSP60, ribosomal protein L24, and myosin heavy chain. A heatmap of the differentially regulated proteins revealed the presence of two inversely regulated protein clusters in the C8C3lvir and C8C3hvir cell lines.
Figure 5. Workflow of proteomics analysis. Low-virulence (C8C3lvir, n = 3) and high-virulence (C8C3hvir, n = 3) cell lines were analysed by nLC-MS/MS and the data were mapped using concatenated databases for the Dm28c, TCC, and CL Brener T. cruzi strains. (a) Chromatographic elution profile of the peptides. (b) Identification of differentially regulated proteins. (c) Principal component analysis of differentially regulated proteins. (d) MAplot of differentially regulated proteins. (e) Volcano plot of differentially regulated proteins (F). Heatmap of differentially regulated proteins. The red and blue colours correspond with upregulated and downregulated proteins, respectively. The grey colour indicates that the protein was not differentially expressed.
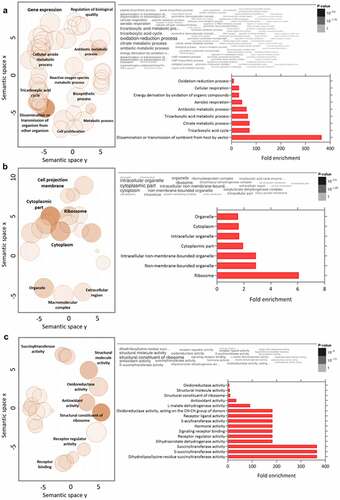
GO analysis of the upregulated proteins in the C8C3hvir cell line revealed enrichment of biological processes (BPs) proteins such as those related to dissemination or transmission of symbionts by a vector, followed by the tricarboxylic acid (TCA) cycle and citrate metabolism proteins (). Enriched cellular components (CCs) included ribosomal proteins, non-membrane-bound organelles, and intracellular non-membrane-bound organelles (, Table S1). Finally, molecular functions (MFs) proteins that were enriched included dihydrolipoyllysine-residue, succinyl transferase, and S-succinyl transferase activities proteins (, Table S2).
Figure 6. Gene ontology analysis combined with quantitative data for differentially expressed proteins in T. cruzi C8C3hvir cell line. Upregulated proteins in C8C3hvir associated with (a) biological processes, (b) cellular components, and (c) molecular functions. Only ontologies with q-value ≤0.05 are presented (Benjamini-Hochberg corrected). The word cloud diagram indicates terms in size and colour proportional to -log(p-value). The histogram indicates the fold enrichment of each ontology term, presenting overrepresented terms in comparison to a gene background. The bubble chart shows the geometric position of each identified ontology term, illustrating the proximity between them.
GO analysis of downregulated proteins in the C8C3lvir cell line revealed that BPs enriched included those of Nicotinamide adenine dinucleotide (NAD) metabolism, the cellular aldehyde process, and oxidoreduction coenzyme metabolism (). Enriched CCs included glycosomes, microbodies, and peroxisomes (). Finally, amongst MFs proteins, transferase activity proteins, which transfer aldehyde or keto groups, and oxidoreductase activity proteins, were enriched (). Amongst regulated pathways, proteins for degradation pathways for ethanol, L-lysine, inosine 5’-phosphate, and sucrose () were enriched in the C8C3lvir cell line, whereas proteins of pathways associated with thymine degradation, aerobic respiration, and the TCA cycle were enriched in the C8C3hvir cell line ().
Figure 7. Gene ontology analysis combined with quantitative data for differentially expressed proteins in T. cruzi C8C3lvir cell line. Downregulated proteins in C8C3lvir associated with (a) biological processes, (b) cellular components, and (c) molecular functions. Only ontologies with q-value ≤0.05 are presented (Benjamini-Hochberg corrected). The word cloud diagram indicates terms in size and colour proportional to -log(p-value). The histogram indicates the fold enrichment of each ontology term, presenting overrepresented terms in comparison to a gene background. The bubble chart shows the geometric position of each identified ontology, illustrating the proximity between them.
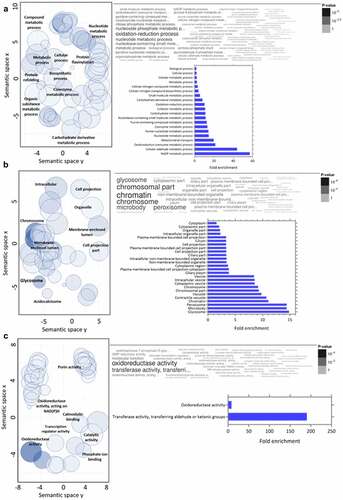
Figure 8. KEGG pathway enrichment analysis of upregulated and downregulated proteins in T. cruzi C8C3hvir cell line. Pfam and Interpro domains enriched in (a) upregulated and (b) downregulated proteins. Only pathways with a q-value ≤0.05 (Benjamini-Hochberg corrected) are presented. (c) Results of the sparse PLS-DA analysis. (d) Proteins are classified into known groups. (e) Key variables that drive the discrimination. The top 20 variables that contribute to components 1 and 2 are inside the circle (dim = 1). The red and blue colours correspond to upregulated and downregulated proteins, respectively.
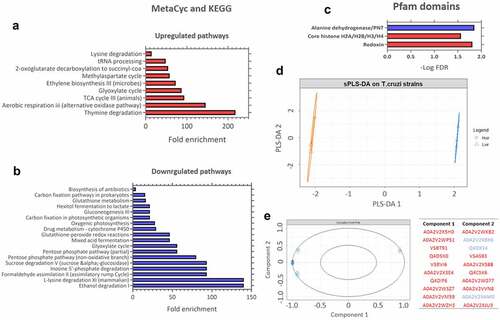
To verify the proteins that contributed most to virulence distinction between the two parasite cell lines, a sparse PLS-DA was performed (). C8C3hvir and C8C3lvir cell lines were most differentiated by the proteins shown in , suggesting that the proteins upregulated in the C8C3hvir cell line contributed most to the virulence difference between the two cell lines.
Trypomastigotes derived from the T. cruzi C8C3hvir cell line display higher expression of virulence factors and rate of metacyclogenesis than those derived from the T. cruzi C8C3lvir cell line
TCTs () and epimastigotes () derived from the C8C3hvir cell line displayed higher levels of Czp expression than those derived from the C8C3lvir cell line. Additionally, trypomastigote Czp-specific enzymatic activity was higher in the C8C3hvir cell line than in the C8C3lvir cell line, as expected (). Since Czp is involved in T. cruzi metacyclogenesis [Citation46,Citation47], effects of the cysteine protease inhibitor, E-64d, on metacyclogenesis, were evaluated for the C8C3hvir cell line. The results indicated that metacyclogenesis was strongly inhibited when parasite cells were co-cultured with E-64d, suggesting that Czp is involved in metacyclogenesis in the C8C3hvir cell line ().
Figure 9. Cruzipain expression and metacyclogenesis in T. cruzi C8C3hvir and C8C3lvir cell lines. Two-dimensional electrophoresis results for cruzipain expression in (a) trypomastigotes and (b) epimastigotes from T. cruzi C8C3hvir and C8C3lvir cell lines. Densitometric analysis of immunoblots were performed using β actin as loading control. Bars are represented as the mean ± SEM of the least three independent experiments. ****P < 0.0001 vs corresponding control; Student’s t-test. (c) Cysteine proteinase activity of both cell lines. * P <0.5, **P < 0.05; Two-way ANOVA. (d) Metacyclogenesis in the presence or absence of cysteine proteinase inhibitor E64d, noted as percentage of metacyclic trypomastigotes.
TCTs derived from the C8C3hvir cell line displayed higher TS expression than those derived from the C8C3lvir cell line (). This was corroborated by assessment of TS enzymatic activity, wherein higher level of TS enzymatic activity was observed in the C8C3hvir cell line than in C8C3lvir cell line ().
Figure 10. Trans-sialidase expression in T. cruzi C8C3hvir and C8C3lvir cell lines. (A) Trans-sialidase expressionin C8C3hvir and C8C3lvircell lines. Densitometric analysis of immunoblots were performed using b actin as loading control. The results are represented as the mean + SEM of five independent experiments. ** P = 0.029 vs corresponding control; Student’s t-test. (B) Trans-sialidase activity of trypomastigotes from C8C3hvir and C8C3lvir T. cruzi cell lines. All assays were performed in triplicate. * P < 0.01;Student’s t-test.
As expected, CRP had a higher level of expression in the C8C3hvir cell line than in the C8C3lvir cell line (). This higher level of CRP expression aligned with the higher resistance of the C8C3hvir cell line to CML (). Finally, expression levels of Tc-85 and sialylated epitopes were higher in the C8C3hvir cell line than in the C8C3lvir cell line ().
Figure 11. Complement regulatory protein (CRP) expression and complement-mediated lysis resistance in T. cruzi C8C3hvir and C8C3lvir cell lines. (a) CRP expression in trypomastigotes from C8C3hvir and C8C3lvir cell lines. Densitometric analysis of immunoblots were performed using β actin as loading control. =the results are represented by the mean ± SEM of five independent experiments. ** P = 0.0014 vs corresponding control; Student’s t-test. (b) Susceptibility of trypomastigotes from C8C3hvir and C8C3lvir cell lines to complement-mediated lysis. The results are expressed as the mean ± SD of experiments performed in triplicate. * P < 0.01; Student’s t-test.
Discussion
Studies conducted over the last few years have deepened our understanding of T. cruzi virulence [Citation4,Citation5]. Moreover, efforts have been made to establish the molecular basis for the virulence of MTs [Citation3] or bloodstream trypomastigotes using clones of same T. cruzi strains [Citation13]. Although several studies have reported various aspects of T. cruzi proteomics [Citation48–53], only a few have compared the global protein expression in different strains or zymodemes [Citation54–57]. Meanwhile, T. cruzi virulence has not been assessed from a proteomics perspective.
In this study, a combination of biological and proteomics approaches was employed to analyse high- as well as low-virulence cell lines (C8C3hvir and C8C3lvir) derived from the T. cruzi H510 C8C3 clone [Citation58]. Infection studies, performed both in vivo and in vitro, demonstrated that the C8C3hvir and C8C3lvir cell lines differed in their infectivity behaviour. Therefore, their proteomes were compared using GO, metabolism enrichment analysis, and PCA, which revealed differences between the two parasite cell lines ().
Differentially enriched proteins related to BPs were those associated with the dissemination or transmission of symbionts by a vector, the TCA cycle, and citrate metabolism (). The putative ADP ribosylation factor 3 (ARF3), in vector-transmitted symbiotic pathogens, has been shown to play a role in eukaryotic cellular trafficking and actin remodelling [Citation59]. ARF3 has been described in trypanosomatids, including TcARf1 of T. cruzi [Citation60], but its biological role remains unknown. However, ARF3 is essential for flagellar integrity in Leishmania [Citation61]. Thus, presence of a healthy flagellum could be a prerequisite for T. cruzi virulence, considering that novel functions, beyond energetics and motility, have been discovered for kinetoplastid flagella [Citation62]. Amongst these is the flagellar function that enables parasites to sense the presence of mammalian cells and modify their motility, thereby increasing cell invasion efficiency [Citation63].
Several pieces of evidence obtained in the current study suggested that metabolic pathways involved in energy production, such as the TCA cycle, may be related to the higher virulence of C8C3hvir compared with C8C3lvir. Indeed, among BPs, the TCA cycle and citrate metabolism proteins appeared to be upregulated in the virulent cell line. Likewise, genome-scale metabolic models have revealed that a functional TCA cycle is required by trypomastigotes to supply energy for flagellar activity [Citation64]. These observations are in accordance with the study by Schenkman et al [Citation65], in which attachment to mammalian cells required energy expenditure by T. cruzi trypomastigotes [Citation65]. In contrast, positive regulation of the TCA cycle could be related to the eventual use of certain TCA cycle enzymes for the metabolic processing of carbon or other free energy sources, including amino acids such as glutamate and proline [Citation66]. Notably, proline plays a critical role in T. cruzi cell invasion [Citation67,Citation68]. Furthermore, TCA cycle products, such as succinate and acetyl coenzyme A (acetyl CoA), may play an important role in T. cruzi virulence. Bloodstream trypomastigotes produce organic acids during glucose catabolism [Citation69–71], with succinate being the major catabolite [Citation72]. In eukaryotes, elevated levels of cytosolic succinate induce epigenetic alterations, production of mitochondrial reactive oxygen species (ROS), and protein succinylation of lysines (Ksucc) [Citation73–75]. Although succinylation has not been described in T. cruzi, histone lysine succinylation is critical not only for the growth and differentiation of the human pathogenic protozoa Toxoplasma gondii, but also for the pathogen’s stage-specific adaptations to different environments during the transition between hosts [Citation76]. Therefore, the findings of the current study strongly suggest that energy pathways such as the TCA cycle are involved in the virulence machinery of T. cruzi, particularly considering that the proteins of the pathway were upregulated in the C8C3hvir cell line and downregulated in the C8C3lvir cell line.
In this study, peroxisomes, microbodies, and glycosomes were comparatively more downregulated in the C8C3hvir cell line than in the C8C3lvir cell line. From an evolutionary point of view, parasite glycosomes, wherein glycolysis enzymes are compartmentalized [Citation77], are the most divergent type of peroxisomes [Citation76]. Prior to T. cruzi invasion, important changes reportedly occur in the trypomastigote phosphoproteome, following contact with the extracellular matrix [Citation78]. These changes include a decrease or increase in the phosphorylation of several glycosomal enzymes, which appear to be related to reduced levels of several carbon metabolism intermediates. These observations indicate that contact with the extracellular matrix may significantly modulate the glycolytic pathway in infective forms of T. cruzi [Citation78].
Differentially enriched proteins related to cellular components (CCs) were those associated with ribosomal proteins, non-membrane-bound organelles, and intracellular non-membrane-bound organelles (). Previous studies on fibroblasts have shown that TCTs, derived from T. cruzi that were recently released from cells, showed low infectivity and required an extracellular maturation process to become highly infective [Citation79,Citation80]. Treatment of trypomastigotes with protein synthesis inhibitors [Citation79,Citation81] markedly reduced parasitic invasiveness, suggesting that protein synthesis is crucial for adhesion and cell invasion of T. cruzi [Citation81]. Amongst the newly synthesized proteins, those expressed on the surface of the cell membrane as well as those loaded on extracellular vesicles, participate in parasite adhesion and invasion, thus increasing heart parasitism [Citation82–85]. In addition, protein expression in T. cruzi TcI strains is reportedly increased to stimulate higher motility as well as neutralize macrophage-released products such as free radicals in order to improve the odds of the pathogen’s survival in the mammalian host [Citation86].
Finally, differentially enriched proteins related to MFs were those associated with various succinyl transferase activities (). One of the first steps of the TCA cycle involves the production of acetyl CoA from pyruvate, generated during glycolysis, by the mitochondrial pyruvate dehydrogenase complex (PDC), which then leads to the synthesis of fatty acids [Citation87] and sterols [Citation88]. PDC [Citation89] is a multi-enzymatic complex composed of several copies of E1 (subunits α and β pyruvate dehydrogenase), E2 (dihydrolipoyl transacetylase), and E3 (dihydrolipoyl dehydrogenase) subunits, in addition to the E3-binding protein [Citation90]. Several enzyme complexes, such as PDC, require lipoic acid as a prosthetic group. A subunit of lipoylated PDC E2 was previously detected in T. cruzi via immunoblotting [Citation91]. These observations suggest that, in addition to the roles played by fatty acids, as energy sources or signalling molecules [Citation87] as well as for sterol enrichment in the flagellum during the formation of lipid rafts involved in cell invasion or host immune response evasion [Citation92], biochemical pathways such as the TCA cycle are critical for trypomastigote virulence.
KEGG pathway enrichment analysis revealed that proteins related to thymine degradation were highly upregulated in the C8C3hvir cell line, followed by those involved in aerobic respiration (oxidase pathways) and the TCA cycle. A previous study reported that a glucosylated thymine DNA base, named base J [Citation93], plays a role in the virulence of T. cruzi presumably because its reduction or loss led to an increase in the rate of Pol II transcription as well as higher expression of virulence-related genes, that resulted in increased parasitic invasiveness [Citation94]. The upregulation of proteins associated with bioenergetic pathways, such as the TCA cycle, as well as oxidative pathways, supports the involvement of energy production processes in the virulence of trypomastigotes of T. cruzi.
During T. cruzi invasion, the host’s innate and adaptive immune responses lead to the release of ROS and reactive nitrogen species (RNS) [Citation95]. Trypomastigotes need to resist deleterious attacks from non-immune cells because a broad range of ROS and RNS are synthesized as a result of metabolism under aerobic conditions [Citation95]. T. cruzi reportedly possesses an arsenal of antioxidative enzymes, such as superoxide dismutases, tryparedoxin peroxidases, and peroxidases, to reduce the levels of ROS and RNS [Citation96–104]. Many of these enzymes appear to be upregulated in the infective stages of T. cruzi [Citation86,Citation96,Citation105–107]. In the present study, among Pfam domains, redoxins were enriched in the C8C3hvir cell line relative to the C8C3lvir cell line, suggesting that these may be associated with parasite virulence. According to Zago et al [Citation86], T. cruzi TcI strains, such as C8C3hvir, employ several antioxidant enzymes to promote the pathogen’s development in macrophages thus causing damage to the infected mice.
A recent study reported that T. cruzi mitochondrial calcium-sensitive pyruvate dehydrogenase phosphatase (TcPDP) is required for energy metabolism, proliferation, cell differentiation, and invasiveness of T. cruzi [Citation108]. Therein, it was shown that the cell invasion abilities of TcPDP-knockout trypomastigotes was impaired compared to that of wild-type trypomastigotes. Considering that TcPDP dephosphorylates TcPDH, a critical component of the TCA cycle, stimulation of energy metabolism through TCA cycle activation may be essential for parasite invasion [Citation108]. On the other hand, pyruvate, the final product of the glycolytic pathway, needs to be actively transported to the mitochondrial matrix. Pyruvate transporter subunits have been reported to be required for pyruvate-driven respiration, cell invasion, and amastigote proliferation in T. cruzi [Citation109]. Further, genetic suppression of mitochondrial pyruvate transporter subunits, MPC1 and MPC2, significantly reduces T. cruzi invasion and amastigote proliferation [Citation109]. The ablation of any of the components of this bioenergetic process resulted in impaired infectivity and virulence [Citation109]. The results of these studies suggest that compounds that cause mitochondrial inefficiency may be promising trypanocidal drug candidates [Citation110]. Similarly, chemotherapeutic interventions targeting bioenergetic processes [Citation111,Citation112], redoxins [Citation105], and ribosomes, have been proposed [Citation113–115].
Differences between the C8C3hvir and C8C3lvir cell lines at the proteomics level should be reflected in the differences in their virulence factor expression, considering that the increased virulence of the C8C3hvir cell line, in addition to differential expression of some well-known virulence factors, could be related to its greater ability to invade host cells. In the current study, western blotting demonstrated that Czp, Tc-85, TS, and CRP were expressed in both cell lines, but the C8C3hvir cell line displayed higher levels of these virulence factors than the C8C3lvir cell line. Moreover, the expression of sialylated epitopes was higher in the C8C3hvir cell line than in the C8C3lvir cell line (Figure S3). Various reports have suggested that Czp and members of the gp85/TS protein family are crucial for T. cruzi virulence [Citation4]. These proteins participate in parasite infectivity and intracellular growth [Citation116–120]. TS also participates in host immune evasion [Citation116–119], and CRPs, which are present only on trypomastigotes, block complement system activation [Citation120]. In addition, the complement system modulates the infectivity of susceptible T. cruzi TcI strains [Citation121]. Thus, CRP expression appears to be closely related to T. cruzi virulence [Citation10], which was supported in the current study. Considering that the host complement system functions as a natural defence mechanism that T. cruzi needs to resist in order to infect the mammalian host [Citation122], one of the possible explanations for the differences in virulence observed in the current study may be the increased ability of the C8C3hvir cells to invade the host cells and resist the complement system. Increased expression of Czp, TS, CRP (, and ), and Tc-85 (Figure S3) in the C8C3hvir cell line compared with the C8C3lvir cell line suggests a greater invasive capacity of the virulent cell line. The results also suggest a greater affinity of the C8C3hvir cells for cardiac tissue, which may result from the high expression of glycoproteins such as Tc-85 which contains the FLY motif at its C-terminus [Citation123]. FLY promotes parasite cell adhesion to endothelial cells, thus contributing to T. cruzi myocardial affinity [Citation123]. In the present study, heart tissues from C8C3hvir-infected mice displayed a high parasite load, which was consistent with previously reported observations. This observation also supports the involvement of T. cruzi TcI strains in cardiac forms of Chagas disease, suggesting that some TcI strains are more virulent than other DTUs [Citation124] and may be implicated in the progression of cardiac forms of Chagas disease, including the fatal acute Chagas disease [Citation124,Citation125]. TcI is also the most predominant genotype found in blood as well as heart biopsy samples of patients with Chagas cardiomyopathy [Citation124,Citation126–128].
Despite this body of evidence, it remains unclear as to why the expression of factors such as Czp, TS, CRP, and Tc-85 results in a more virulent parasite. A previous study reported that inhibition of each of these virulence factors reduces the levels of parasitaemia and cell invasion, but does not completely abolish infection [Citation58]. The results therein suggested that T. cruzi trypomastigotes express a “virulent genetic program,” which includes upregulation of proteins associated with bioenergetics and biosynthetic pathways, as well as that of some virulence factors, thus generating parasites that are more capable of successfully colonizing tissues and organs and reaching higher parasitic loads, thus causing organ damage.
The genetic variability of T. cruzi has been described from a virulence perspective [Citation8]. However, differences between high- and low-virulence strains might correspond to inter-isolate variation rather than to actual differences related to virulence. To avoid this issue, a comparative analysis of two genetically related T. cruzi cell lines, exhibiting different virulence phenotypes, can help elucidate the pathogenic mechanisms of the parasite. In this study, C8C3hvir induced high parasitaemia in mice, whereas C8C3lvir induced low or subpatent parasitaemia. Phenotypic analysis of both cell lines enabled the identification of important differences: trypomastigotes derived from the C8C3hvir cell line displayed a higher growth rate, increased cysteine proteinase activity, and greater resistance to the complement system. To identify differences at the protein level, the proteomes of both cell lines were analysed using nLC-MS/MS. Thus, these cell lines may serve as effective models for future research programs investigating T. cruzi virulence. In short, a defined set of biochemical pathways distinguished the C8C3hvir cell line from C8C3lvir, although further studies are warranted to elucidate their functions in T. cruzi virulence.
In conclusion, differences in the virulence of T. cruzi strains go beyond the mere expression of virulence factors, either in the parasite membrane or as excretory/secretory molecules, including molecules loaded on extracellular vesicles. The study findings suggest that the virulence of T. cruzi involves the reprogramming of metabolic and biosynthetic pathways to ensure that mechanisms to bolster energy requirements are initiated, differential proteins are expressed, and protection is enhanced against oxidative stress. The upregulation of proteins, which was not observed in the low-virulence cell line, provides insights into the virulence of T. cruzi which could be extrapolated to other parasitic organisms. A deeper exploration of these pathways through omics and molecular biology approaches, such as Crisp/Cas9, would facilitate the identification of new therapeutic targets and provide potential vaccine candidates for Chagas disease.
Acknowledgements
We thank Dr. Marta M. Teixeira and Luciana Lima (Parasitology Department, ICB, University of São Paulo, São Paulo, Brasil) for genotyping the C8C3hvir and C8C3lvir cell lines. We are especially grateful to Dr. María Julia Manso Alves (University of Sao Paulo, Brazil); Dr. Juan José Cazzulo (Universidad Nacional de San Martin, Buenos Aires, Argentina); Dr. Karen Norris (University of Georgia, Athens, USA), and Dr. Sergio Schenkman (Federal University of Sao Paulo, Brazil), for providing us with the antibodies used in this study. We are also grateful for the work of the Scientific Research Ethics Committee of the Universidad de Antofagasta.
Disclosure statement
No potential conflict of interest was reported by the author(s).
Data availability statement
The mass spectrometry proteomics data have been deposited to the ProteomeXchange Consortium via the PRIDE partner repository with the dataset identifier P×D030117. Username: [email protected] and Password: KfQViJwo.
Additional information
Funding
References
- WHO. 2022. WHO. http://www.who.int/mediacentre/factsheets/fs340/es/
- Zingales B. Trypanosoma cruzi genetic diversity: something new for something known about Chagas disease manifestations, serodiagnosis and drug sensitivity. Acta Trop. 2018;184:38–52.
- Atayde VD, Neira I, Cortez M, et al. Molecular basis of non-virulence of Trypanosoma cruzi clone CL-14. Int J Parasitol. 2004;34:851–860.
- de Castro Neto AL, da Silveira JF, Mortara RA. Comparative analysis of virulence mechanisms of trypanosomatids pathogenic to humans. Front Cell Infect Microbiol. 2021;669079:11.
- Osorio L, Ríos I, Gutiérrez B, et al. Virulence factors of Trypanosoma cruzi: who is who? Microbes Infect. 2012;14:1390–1402.
- Yoshida N. Molecular basis of mammalian cell invasion by Trypanosoma cruzi. An Acad Bras Cienc. 2006;78:87–111.
- Miles MA, Toye PJ, Oswald SC, et al. The identification by isoenzyme patterns of two distinct strain-groups of Trypanosoma cruzi, circulating independently in a rural area of Brazil. Trans R Soc Trop Med Hyg. 1977;71:217–225.
- Macedo AM, Machado CR, Oliveira RP, et al. Trypanosoma cruzi: genetic structure of populations and relevance of genetic variability to the pathogenesis of Chagas disease. Mem Inst Oswaldo Cruz. 2004;99:1–12.
- Lima L, Espinosa-Álvarez O, Ortiz PA, et al. Genetic diversity of Trypanosoma cruzi in bats, and multilocus phylogenetic and phylogeographical analyses supporting Tcbat as an independent DTU (discrete typing unit). Acta Trop. 2015;151:166–177.
- Henrique PM, Marques T, da Silva MV, et al. Correlation between the virulence of T. cruzi strains, complement regulatory protein expression levels, and the ability to elicit lytic antibody production. Exp Parasitol. 2016;170:66–72.
- Revelli S, Gómez L, Wietzerbin J, et al. Levels of tumor necrosis factor alpha, gamma interferon, and interleukins 4, 6, and 10 as determined in mice infected with virulent or attenuated strains of Trypanosoma cruzi. Parasitol Res. 1999;85(2):147–150.
- Mule SN, Costa-Martins AG, Rosa-Fernandes L, et al. PhyloQuant approach provides insights into Trypanosoma cruzi evolution using a systems-wide mass spectrometry-based quantitative protein profile. Commun Biol. 2021;4(1):324.
- Postan M, Dvorak JA, McDaniel JP. Studies of Trypanosoma cruzi clones in inbred mice. I. A comparison of the course of infection C3H/HEN- mice with two clones isolated from a common source. Am J Trop Med Hyg. 1983;32(3):497–506.
- Sales-Campos H, Kappel HB, Andrade CP, et al. Trypanosoma cruzi DTU TcII presents higher blood parasitism than DTU TcI in an experimental model of mixed infection. Acta Parasitol. 2015;60. DOI:10.1515/ap-2015-0060
- Meza SKL, Kaneshima EN, de Oliveira Silva S, et al. Comparative pathogenicity in Swiss mice of Trypanosoma cruzi IV from northern Brazil and Trypanosoma cruzi II from southern Brazil. Exp Parasitol. 2014;146. DOI:10.1016/j.exppara.2014.08.014
- Pan SC. Establishment of clones of Trypanosoma cruzi and their characterization in vitro and in vivo. Bull World Health Organ. 1982;60:101–107.
- Luban NA, Dvorak JA. Trypanosoma cruzi: interaction with vertebrate cells in vitro. III. Selection for biological characteristics following intracellular passage. Exp Parasitol. 1974;36:143–149.
- Camargo EP. Growth and differentiation in Trypanosoma cruzi. I. Origin of metacyclic trypanosomes in liquid medium. Rev Soc Bras Med Trop. 1964;6:93–100.
- Araya JE, Cornejo A, Orrego PR, et al. Calcineurin B of the human protozoan parasite Trypanosoma cruzi is involved in cell invasion. Microbes Infect. 2008;10(8):892–900.
- Murthy VK, Dibbern KM, Campbell DA. PCR amplification of mini-exon genes differentiates Trypanosoma cruzi from Trypanosoma rangeli. Mol Cell Probes. 1992;6:237–243.
- Thompson JD, Higgins DG, Gibson DJ. CLUSTAL W: improving the sensitivity of progressive multiple sequence alignment through sequence weighting, position-specific gap penalties and weight matrix choice. Nucleic Acids. 1994;22:4673–4680.
- Kumar S, Stecher G, Li M, et al. MEGA X: molecular evolutionary genetics analysis across computing platforms. Mol Biol Evol. 2018;35(6):1547–1549.
- Sreejit P, Kumar S, Verma RS. An improved protocol for primary culture of cardiomyocyte from neonatal mice. Vitr Cell Dev Biol - Anim. 2008;44:45–50.
- Yoshida N. Surface antigens of metacyclic trypomastigotes of Trypanosoma cruzi. Infect Immun. 1983;40(2):836–839.
- Brener Z. Therapeutic activity and criterion of cure on mice experimentally infected with Trypanosoma cruzi 1962. Rev Inst Med Trop Sao Paulo. 1962;4:389–396.
- Cummings KL, Tarleton RL. Rapid quantitation of Trypanosoma cruzi in host tissue by real-time PCR. Mol Biochem Parasitol. 2003;129:53–59.
- Caldas S, Santos FM, de Lana M, et al. Trypanosoma cruzi: acute and long-term infection in the vertebrate host can modify the response to benznidazole. Exp Parasitol. 2008;118(3):315–323.
- Stordeur P, Poulin LF, Craciun L, et al. Cytokine mRNA quantification by real-time PCR. J Immunol Methods. 2002;259(1–2):55–64.
- Moreno ML, Escobar J, Izquierdo-Álvarez A, et al. Disulfide stress: a novel type of oxidative stress in acute pancreatitis. Free Radic Biol Med. 2014;70:265–277.
- Shevchenko A, Wilm M, Vorm O, et al. Mass spectrometric sequencing of proteins from silver-stained polyacrylamide gels. Anal Chem. 1996;68(5):850–858.
- Alonso R, Pisa D, Marina AI, et al. Evidence for fungal infection in cerebrospinal fluid and brain tissue from patients with amyotrophic lateral sclerosis. Int J Biol Sci. 2015;11(5):546–558.
- Tyanova S, Temu T, Cox J. The MaxQuant computational platform for mass spectrometry-based shotgun proteomics. Nat Protoc. 2016;11(12):2301–2319.
- Bradford MM. A rapid and sensitive method for the quantitation of microgram quantities of protein using the principle of protein dye binding. Anal Biochem. 1976;72:248–254.
- Campetella O, Martínez J, Cazzulo JJ. A major cysteine proteinase is developmentally regulated in Trypanosoma cruzi. FEMS Microbiol Lett. 1990;55(1–2):145–149.
- Norris KA, Schrimpf JE, Szabo MJ. Identification of the gene family encoding the 160-kilodalton Trypanosoma cruzi complement regulatory protein. Infect Immun. 1997;65(2):349–357.
- Schenkman S, Diaz C, Nussenzweig V. Attachment of Trypanosoma cruzi trypomastigotes to receptors at restricted cell surface domains. Exp Parasitol. 1991;72(1):76–86.
- Schenkman S, Jiang MS, Hart GW, et al. A novel cell surface trans-sialidase of Trypanosoma cruzi generates a stage-specific epitope required for invasion of mammalian cells. Cell. 1991;65(7):1117–1125.
- Manso Alves MJ, Abuin G, Kuwajima VY, et al. Partial inhibition of trypomastigote entry into cultured mammalian cells by monoclonal antibodies against a surface glycoprotein of Trypanosoma cruzi. Mol Biochem Parasitol. 1986;21:75–82.
- Norris KA. Ligand-binding renders the 160 kDa Trypanosoma cruzi complement regulatory protein susceptible to proteolytic cleavage. Microb Pathog. 1996;21(4):235–248.
- dos Cestari IS, Krarup A, Sim RB, et al. Role of early lectin pathway activation in the complement-mediated killing of Trypanosoma cruzi. Mol Immunol. 2009;47(2–3):426–437.
- González J, Ramalho-Pinto FJ, Frevert U, et al. Proteasome activity is required for the stage-specific transformation of a protozoan parasite. J Exp Med. 1996;184(5):1909–1918.
- Cazzulo JJ, Cazzulo Franke MC, Martínez J, et al. Some kinetic properties of a cysteine proteinase (cruzipain) from Trypanosoma cruzi. Biochim Biophys Acta (BBA)/Protein Struct Mol. 1990;1037:186–191.
- Grellier P, Blum J, Santana J, et al. Involvement of calyculin A-sensitive phosphatase(s) in the differentiation of Trypanosoma cruzi trypomastigotes to amastigotes. Mol Biochem Parasitol. 1999;98:239–252.
- Coura JR, Borges-Pereira J. Chagas disease: what is known and what should be improved: a systemic review. Rev Soc Bras Med Trop. 2012;45:286–296.
- Borghesan TC, Ferreira RC, Takata CSA, et al. Molecular phylogenetic redefinition of Herpetomonas (Kinetoplastea, Trypanosomatidae), a genus of insect parasites associated with flies. Protist. 2013;164:129–152.
- Franke de Cazzulo BM, Martínez J, North MJ, et al. Effects of proteinase inhibitors on the growth and differentiation of Trypanosoma cruzi. FEMS Microbiol Lett. 1994;124(1):81–86.
- Tomas AM, Miles MA, Kelly JM. Overexpression of cruzipain, the major cysteine proteinase of Trypanosoma cruzi, is associated with enhanced metacyclogenesis. Eur J Biochem. 1997;244(2):596–603.
- Brunoro GVF, Caminha MA, da Silva Ferreira AT, et al. Reevaluating the Trypanosoma cruzi proteomic map: the shotgun description of bloodstream trypomastigotes. J Proteomics. 2015;115:58–65.
- Atwood JA, Weatherly DB, Minning TA, et al. The Trypanosoma cruzi proteome. Science. 2005;309:473–476.
- de Castro Moreira dos Santos A, Kalume DE, Camargo R, et al. Unveiling the Trypanosoma cruzi nuclear proteome. PLoS One. 2015;10(9):e0138667.
- Coutinho JVP, Rosa-Fernandes L, Mule SN, et al. The thermal proteome stability profile of Trypanosoma cruzi in epimastigote and trypomastigote life stages. J Proteomics. 2021;248:104339.
- Magalhães RDM, Mattos EC, Rozanski A, et al. Global changes in nitration levels and DNA binding profile of Trypanosoma cruzi histones induced by incubation with host extracellular matrix. PLoS Negl Trop Dis. 2020;14(5):e0008262.
- Avila CC, Almeida FG, Palmisano G. Direct identification of trypanosomatids by matrix-assisted laser desorption ionization–time of flight mass spectrometry (DIT MALDI-TOF MS). J Mass Spectrom. 2016;51(8):549–557.
- Kikuchi SA, Sodré CL, Kalume DE, et al. Proteomic analysis of two Trypanosoma cruzi zymodeme 3 strains. Exp Parasitol. 2010;126(4):540–551.
- Herreros-Cabello A, Callejas-Hernández F, Fresno M, et al. Comparative proteomic analysis of trypomastigotes from Trypanosoma cruzi strains with different pathogenicity. Infect Genet Evol. 2019;76:104041.
- Ribeiro KS, Vasconcellos CI, Soares RP, et al. Proteomic analysis reveals different composition of extracellular vesicles released by two Trypanosoma cruzi strains associated with their distinct interaction with host cells. J Extracell Vesicles. 2018;7(1):1463779.
- Tavares De Oliveira M, Taciana Santos Silva K, Xavier Neves L, et al. Differential expression of proteins in genetically distinct Trypanosoma cruzi samples (TcI and TcII DTUs) isolated from chronic Chagas disease cardiac patients. Parasites Vectors. 2018;11(1):611.
- San Francisco J, Barría I, Gutiérrez B, et al. Decreased cruzipain and gp85/trans-sialidase family protein expression contributes to loss of Trypanosoma cruzi trypomastigote virulence. Microbes Infect. 2017;19(1):55–61.
- Takai Y, Sasaki T, Matozaki T. Small GTP-binding proteins. Physiol Rev. 2001;81(1):153–208.
- De Sá-Freire A, Nepomuceno-Silva JL, Da Paixão JC, et al. TcArf1: a Trypanosoma cruzi ADP-ribosylation factor. Parasitol Res. 2003;91(2):166–170.
- Cuvillier A, Redon F, Antoine JC, et al. LdARL-3A, a Leishmania promastigote-specific ADP-ribosylation factor-like protein, is essential for flagellum integrity. J Cell Sci. 2000;113(Pt 11):2065–2074.
- Kelly FD, Sanchez MA, Landfear SM. Touching the surface: diverse roles for the flagellar membrane in kinetoplastid parasites. Microbiol Mol Biol Rev. 2020;84(2):e00079–19.
- Arias-Del-Angel JA, Santana-Solano J, Santillán M, et al. Motility patterns of Trypanosoma cruzi trypomastigotes correlate with the efficiency of parasite invasion in vitro. Sci Rep. 2020;10(1):15894.
- Shiratsubaki IS, Fang X, Souza ROO, et al. Genome-scale metabolic models highlight stage-specific differences in essential metabolic pathways in Trypanosoma cruzi. PLoS Negl Trop Dis. 2020;14(10):e0008728.
- Schenkman S, Robbins ES, Nussenzweig V. Attachment of Trypanosoma cruzi to mammalian cells requires parasite energy, and invasion can be independent of the target cell cytoskeleton. Infect Immun. 1991;59(2):645–654.
- Marchese L, Nascimento JDF, Damasceno FS, et al. The uptake and metabolism of amino acids, and their unique role in the biology of pathogenic trypanosomatids. Pathogens. 2018;7(2):36.
- Martins RM, Covarrubias C, Rojas RG, et al. Use of L-proline and ATP production by Trypanosoma cruzi metacyclic forms as requirements for host cell invasion. Infect Immun. 2009;77(7):3023–3032.
- Mantilla BS, Paes LS, Pral EMF, et al. Role of Δ1-pyrroline-5-carboxylate dehydrogenase supports mitochondrial metabolism and host-cell invasion of Trypanosoma cruzi. J Biol Chem. 2015;290(12):7767–7790.
- Chang SL. Studies on hemoflagellates: iV. Observations concerning some biochemical activities in culture, and respiration of three species of Leishmanias and Trypanosoma Cruzi. J Infect Dis. 1948;82(2):109–118.
- Ryley JF. Studies on the metabolism of the Protozoa. 7. Comparative carbohydrate metabolism of eleven species of trypanosome. Biochem J. 1956;62(2):215–222.
- Cáceres O, Fernandes JF. Glucose metabolism, growth and differentiation of Trypanosoma cruzi. Rev Bras Biol. 1976;36(2):397–410.
- Cazzulo JJ. Intermediate metabolism in Trypanosoma cruzi. J Bioenerg Biomembr. 1994;26(2):157–165.
- Zhang Z, Tan M, Xie Z, et al. Identification of lysine succinylation as a new post-translational modification. Nat Chem Biol. 2011;7(1):58–63.
- Colak G, Xie Z, Zhu AY, et al. Identification of lysine succinylation substrates and the succinylation regulatory enzyme CobB in Escherichia coli. Mol Cell Proteomics. 2013;12(12):3509–3520.
- Fernández-Veledo S, Ceperuelo-Mallafré V, Vendrell J. Rethinking succinate: an unexpected hormone-like metabolite in energy homeostasis. Trends Endocrinol Metab. 2021;32(9):680–692.
- Li X, Hu X, Wan Y, et al. Systematic identification of the lysine succinylation in the protozoan parasite Toxoplasma gondii. J Proteome Res. 2014;13(12):6087–6095.
- Quiñones W, Acosta H, Gonçalves CS, et al. Structure, properties, and function of glycosomes in Trypanosoma cruzi. Front Cell Infect Microbiol. 2020;10:25.
- Mattos EC, Canuto G, Manchola NC, et al. Reprogramming of Trypanosoma cruzi metabolism triggered by parasite interaction with the host cell extracellular matrix. PLoS Negl Trop Dis. 2019;13(2):e0007103.
- Piras R, Piras MM, Henriquez D. The effect of inhibitors of macromolecular biosynthesis on the in vitro infectivity and morphology of Trypanosoma cruzi trypomastigotes. Mol Biochem Parasitol. 1982;6(2):83–92.
- Piras MM, Piras R, Henriquez D. Changes in morphology and infectivity of cell culture-derived trypomastigotes of Trypanosoma cruzi. Mol Biochem Parasitol. 1982;6(2):67–81.
- Lima MF, Kierszenbaum F. Biochemical requirements for intracellular invasion by Trypanosoma cruzi: protein synthesis. J Protozool. 1982;29(4):566–570.
- Trocoli Torrecilhas AC, Tonelli RR, Pavanelli WR, et al. Trypanosoma cruzi: parasite shed vesicles increase heart parasitism and generate an intense inflammatory response. Microbes Infect. 2009;11:29–39.
- Garcia-Silva MR, Cabrera-Cabrera F, Cura Das Neves RF, et al. Gene expression changes induced by Trypanosoma cruzi shed microvesicles in mammalian host cells: relevance of tRNA-derived halves. Biomed Res Int. 2014;2014:305239.
- Martins NO, de Souza RT, Cordero EM, et al. Molecular characterization of a novel family of Trypanosoma cruzi surface membrane proteins (TcSMP) involved in mammalian host cell invasion. PLoS Negl Trop Dis. 2015;9(11):e0004216.
- Moreira LR, Serrano FR, Osuna A. Extracellular vesicles of Trypanosoma cruzi tissue-culture cell-derived trypomastigotes: induction of physiological changes in non-parasitized culture cells. PLoS Negl Trop Dis. 2019;13(2):e0007163.
- Zago MP, Hosakote YM, Koo SJ, et al. TcI isolates of Trypanosoma cruzi exploit the antioxidant network for enhanced intracellular survival in macrophages and virulence in mice. Infect Immun. 2016;84(6):1842–1856.
- Uttaro AD. Acquisition and biosynthesis of saturated and unsaturated fatty acids by trypanosomatids. Mol Biochem Parasitol. 2014;196(1):61–70.
- de Souza W, Rodrigues JCF. Sterol biosynthesis pathway as target for anti-trypanosomatid drugs. Interdiscip Perspect Infect Dis. 2009;2009:649502.
- Linn TC, Pettit FH, Reed LJ. Alpha-keto acid dehydrogenase complexes. X. Regulation of the activity of the pyruvate dehydrogenase complex from beef kidney mitochondria by phosphorylation and dephosphorylation. Proc Natl Acad Sci, USA. 1969;62(1):234–241.
- Reed LJ. A trail of research from lipoic acid to α-Keto acid dehydrogenase complexes. J Biol Chem. 2001;276(42):38329–38336.
- Vacchina P, Lambruschi DA, Uttaro AD. Lipoic acid metabolism in Trypanosoma cruzi as putative target for chemotherapy. Exp Parasitol. 2018;186:17–23.
- Walker DM, Oghumu S, Gupta G, et al. Mechanisms of cellular invasion by intracellular parasites. Cell Mol Life Sci. 2014;71(7):1245–1263.
- Borst P, Sabatini R. Base J: discovery, biosynthesis, and possible functions. Annu Rev Microbiol. 2008;62:235–251.
- Ekanayake DK, Minning T, Weatherly B, et al. Epigenetic regulation of transcription and virulence in Trypanosoma cruzi by O-linked thymine glucosylation of DNA. Mol Cell Biol. 2011;31:1690–1700.
- Mesías AC, Garg NJ, Zago MP. Redox balance keepers and possible cell functions managed by redox homeostasis in Trypanosoma cruzi. Front Cell Infect Microbiol. 2019;9:435.
- Piacenza L, Zago MP, Peluffo G, et al. Enzymes of the antioxidant network as novel determiners of Trypanosoma cruzi virulence. Int J Parasitol. 2009;39(13):1455–1464.
- Irigoín F, Cibils L, Comini MA, et al. Insights into the redox biology of Trypanosoma cruzi: trypanothione metabolism and oxidant detoxification. Free Radic Biol Med. 2008;45:733–742.
- Machado-Silva A, Cerqueira PG, Grazielle-Silva V, et al. How Trypanosoma cruzi deals with oxidative stress: antioxidant defence and DNA repair pathways. Mutat Res Rev Mutat Res. 2016;767:8–22.
- Ismail SO, Paramchuk W, Skeiky YAW, et al. Molecular cloning and characterization of two iron superoxide dismutase cDnas from Trypanosoma cruzi. Mol Biochem Parasitol. 1997;86(2):187–197.
- Piñeyro MD, Arcari T, Robello C, et al. Tryparedoxin peroxidases from Trypanosoma cruzi: high efficiency in the catalytic elimination of hydrogen peroxide and peroxynitrite. Arch Biochem Biophys. 2011;507(2):287–295.
- Carnes J, Anupama A, Balmer O, et al. Genome and phylogenetic analyses of Trypanosoma evansi reveal extensive similarity to T. brucei and multiple independent origins for dyskinetoplasty. PLoS Negl Trop Dis. 2015;9(1):e3404.
- Wilkinson SR, Obado SO, Mauricio IL, et al. Trypanosoma cruzi expresses a plant-like ascorbate-dependent hemoperoxidase localized to the endoplasmic reticulum. Proc Natl Acad Sci, USA. 2002;99(21):13453–13458.
- Lopez JA, Carvalho TU, De Souza W, et al. Evidence for a trypanothione-dependent peroxidase system in Trypanosoma cruzi. Free Radic Biol Med. 2000;28:767–772.
- Arias DG, Marquez VE, Chiribao ML, et al. Redox metabolism in Trypanosoma cruzi: functional characterization of tryparedoxins revisited. Free Radic Biol Med. 2013;63:65–77.
- Piñeyro MD, Parodi-Talice A, Arcari T, et al. Peroxiredoxins from Trypanosoma cruzi: virulence factors and drug targets for treatment of Chagas disease? Gene. 2008;408(1–2):45–50.
- Ariyanayagam MR, Fairlamb AH. Ovothiol and trypanothione as antioxidants in trypanosomatids. Mol Biochem Parasitol. 2001;115(2):189–198.
- Ariyanayagam MR, Oza SL, Mehlert A, et al. Bis(glutathionyl) spermine and other novel trypanothione analogues in Trypanosoma cruzi. J Biol Chem. 2003;278(30):27612–27619.
- Lander N, Chiurillo MA, Bertolini MS, et al. Calcium-sensitive pyruvate dehydrogenase phosphatase is required for energy metabolism, growth, differentiation, and infectivity of Trypanosoma cruzi. J Biol Chem. 2018;293(45):17402–17417.
- Negreiros RS, Lander N, Chiurillo MA, et al. Mitochondrial pyruvate carrier subunits are essential for pyruvate-driven respiration, infectivity, and intracellular replication of Trypanosoma cruzi. MBio. 2021;12(2). e00540-21. DOI:10.1128/mBio.00540-21.
- Macedo CM, Saraiva FMDS, Paula JIO, et al. The potent trypanocidal effect of LQB303, a novel Redox-Active Phenyl-Tert-Butyl-Nitrone derivate that causes mitochondrial collapse in Trypanosoma cruzi. Front Microbiol. 2021;12:617564.
- Barros-Alvarez X, Gualdron-Lopez M, Acosta H, et al. Glycosomal targets for anti-trypanosomatid drug discovery. Curr Med Chem. 2014;21(15):1679–1706.
- de Pádua RAP, Kia AM, Costa-Filho AJ, et al. Characterisation of the fumarate hydratase repertoire in Trypanosoma cruzi. Int J Biol Macromol. 2017;102:42–51.
- Hashem Y, Des Georges A, Fu J, et al. High-resolution cryo-electron microscopy structure of the Trypanosoma brucei ribosome. Nature. 2013;494(7437):385–389.
- Vicens Q, Bochler A, Jobe A, et al. Interaction networks of ribosomal expansion segments in kinetoplastids. Subcell Biochem. 2021;96:433–450.
- Bochler A, Querido JB, Prilepskaja T, et al. Structural differences in translation initiation between pathogenic trypanosomatids and their mammalian hosts. Cell Rep. 2020;33(12):108534.
- Dc-Rubin SSC, Schenkman S. Trypanosoma cruzi trans-sialidase as a multifunctional enzyme in Chagas’ disease. Cell Microbiol. 2012;14:1522–1530.
- Schauer R, Kamerling JP. The chemistry and biology of trypanosomal Trans-Sialidases: virulence factors in Chagas disease and sleeping sickness. Chembiochem. 2011;12(15):2246–2264.
- Campetella O, Buscaglia CA, Mucci J, et al. Parasite-host glycan interactions during Trypanosoma cruzi infection: Trans-Sialidase rides the show. Biochim Biophys Acta - Mol Basis Dis. 2020;1866(5):165692.
- Giorgi ME, de Lederkremer RM. The glycan structure of T. cruzi mucins depends on the host. Insights on the chameleonic galactose. Molecules. 2020;25(17):3913.
- Norris KA, Bradt B, Cooper NR, et al. Characterization of a Trypanosoma cruzi C3 binding protein with functional and genetic similarities to the human complement regulatory protein, decay-accelerating factor. J Immunol. 1991;147(7):2240–2247.
- Arroyo-Olarte RD, Martínez I, Cruz-Rivera M, et al. Complement system contributes to modulate the infectivity of susceptible TcI strains of Trypanosoma cruzi. Mem Inst Oswaldo Cruz. 2018;113(4):e170332.
- Cestari I, Ramirez MI. Inefficient complement system clearance of Trypanosoma cruzi metacyclic trypomastigotes enables resistant strains to invade eukaryotic cells. PLoS One. 2010;5(3):e9721.
- Tonelli RR, Giordano RJ, Barbu EM, et al. Role of the gp85/trans-Sialidases in Trypanosoma cruzi tissue tropism: preferential binding of a conserved peptide motif to the vasculature In vivo. PLoS Negl Trop Dis. 2010;4(11):e864.
- Muñoz-San Martín C, Zulantay I, Saavedra M, et al. Discrete typing units of Trypanosoma cruzi detected by real-time PCR in Chilean patients with chronic Chagas cardiomyopathy. Acta Trop. 2018;185:280–284.
- Calvopina M, Segovia G, Cevallos W, et al. Fatal acute Chagas disease by Trypanosoma cruzi DTU TcI, Ecuador. BMC Infect Dis. 2020;20(1):143.
- Burgos JM, Diez M, Vigliano C, et al. Molecular identification of Trypanosoma cruzi discrete typing units in end-stage chronic Chagas heart disease and reactivation after heart transplantation. Clin Infect Dis. 2010;51:485–495.
- Zafra G, Mantilla JC, Jácome J, et al. Direct analysis of genetic variability in Trypanosoma cruzi populations from tissues of Colombian chagasic patients. Hum Pathol. 2011;42:1159–1168.
- Ramírez JD, Guhl F, Rendón LM, et al. Chagas cardiomyopathy manifestations and Trypanosoma cruzi genotypes circulating in chronic chagasic patients. PLoS Negl Trop Dis. 2010;4(11):e899.