
ABSTRACT
The upsurge of multidrug-resistant infections has rendered tuberculosis the principal cause of death among infectious diseases. A clonal outbreak multidrug-resistant triggering strain of Mycobacterium tuberculosis was identified in Kanchanaburi Province, labelled “MKR superspreader,” which was found to subsequently spread to other regions, as revealed by prior epidemiological reports in Thailand. Herein, we showed that the MKR displayed a higher growth rate upon infection into host macrophages in comparison with the H37Rv reference strain. To further elucidate MKR’s biology, we utilized RNA-Seq and differential gene expression analyses to identify host factors involved in the intracellular viability of the MKR. A set of host genes function in the cellular response to lipid pathway was found to be uniquely up-regulated in host macrophages infected with the MKR, but not those infected with H37Rv. Within this set of genes, the IL-36 cytokines which regulate host cell cholesterol metabolism and resistance against mycobacteria attracted our interest, as our previous study revealed that the MKR elevated genes associated with cholesterol breakdown during its growth inside host macrophages. Indeed, when comparing macrophages infected with the MKR to H37Rv-infected cells, our RNA-Seq data showed that the expression ratio of IL-36RN, the negative regulator of the IL-36 pathway, to that of IL-36G was greater in macrophages infected with the MKR. Furthermore, the MKR’s intracellular survival and increased intracellular cholesterol level in the MKR-infected macrophages were diminished with decreased IL-36RN expression. Overall, our results indicated that IL-36RN could serve as a new target against this emerging multidrug-resistant M. tuberculosis strain.
Introduction
Tuberculosis (TB) remains a prominent cause of mortality, with 1.5 million deaths reported in 2021 stemming from a single infectious agent [Citation1]. Globally, TB control programs have been threatened by the emergence of multidrug-resistant (MDR) and extensively drug-resistant (XDR) M. tuberculosis (Mtb) strains [Citation1]. Among the various Mtb lineages, the modern Beijing family is recognized as a very efficacious genotype for its pervasive propagation across regions correlated with large outbreaks and multidrug resistance [Citation2,Citation3]. In addition, previous studies demonstrated that the Beijing strains possess a superior ability to endure inside host macrophages with elevated mycobacterial loads and mortality rates in animal models in addition to initiate high acid-fast bacilli smear-positive sputum in patients [Citation4–9]. Nevertheless, the factors responsible for their enhanced survival inside hosts remain unclear.
After entering into human lungs, Mtb is phagocytosed and resides primarily within the alveolar macrophages [Citation10]. Subsequent granuloma formation can then control Mtb growth within the host macrophages in immunocompetent individuals. Consequently, the infection becomes latent with a 10% probability that the mycobacteria will reactivate triggering active TB disease later in life [Citation11]. Nevertheless, active TB disease progresses immediately in approximately 10% of infected persons due to the weak immune systems of the hosts. The mechanisms of Mtb reactivation and causes of active TB disease remain unspecified. Nevertheless, the mycobacterial growth spurt inside the host macrophages is thought to bring about the necrotic death of host cells [Citation12], thus discharging the mycobacteria into the extracellular environment, which promotes further growth, strong inflammation, dissemination and transmission [Citation12–14]. Consequently, the ability to grow intracellularly will determine the number of Mtb inside the host cells, which will subsequently dictate the number of extracellular Mtb within the infectious droplet nuclei ready to be transmitted to uninfected people. Thus, the increased intracellular growth capacity of the Mtb is assumed to correlate with its increased transmission.
Previous MDR-TB epidemiological analyses in Thailand uncovered a substantial outbreak in Kanchanaburi Province [Citation3,Citation15]. The outbreak causing strain named “MKR superspreader,” belongs to the modern Beijing genotype sequence type 10, which is exceedingly widespread in numerous countries [Citation16–18]. More specifically, the MKR superspreader belongs to sublineage L2.2.M3 (Asian African 3) [Citation19], which are found to expand in other areas as well [Citation20,Citation21]. The widespread of this emerging MDR-TB causing strain suggests the superior capability of the MKR superspreader to propagate inside the host. In our previous study, we carried out a whole transcriptomic analysis and identified the mycobacterial factors required for the growth of the MKR inside the host macrophages, which include gene function in the cholesterol breakdown and ESX-1 secretion system [Citation22]. However, the host factors involved in the intracellular viability of MKR remain undetermined.
In an attempt to identify the host factors regulating the intracellular growth of MKR inside the host macrophages, herein we conducted RNA-Seq analyses of host cells infected with the MKR superspreader versus those infected by the Mtb reference strain H37Rv. We discovered that the MKR-infected host macrophages uniquely up-regulated genes functioning in the cellular response to lipid pathways, while those infected with H37Rv did not. In addition, the network analyses showed that the differentially expressed genes (DEGs) within the cellular response to lipid pathway interacted with the response to bacteria pathways. As our previous study revealed that the MKR upregulated its gene function in cholesterol degradation during growth inside host macrophages, the IL-36 cytokines previously demonstrated to play a role in host cell cholesterol metabolism and defence against Mtb [Citation23] attracted our attention. Our RNA-Seq data showed a significant increase in the expression ratio of IL-36RN, the negative regulator of the IL-36 pathway, over that of IL-36G in the host macrophages infected with the MKR, compared with the H37Rv-infected cells. The results were verified by qRT-PCR. Moreover, IL-36RN depletion resulted in the decreased intracellular survival of the MKR and a reduction in the intracellular cholesterol level of the MKR-infected cells. Our results suggest that IL-36RN plays a crucial role in the intracellular viability of the MKR, and consequently may be targeted for drug discovery against this emerging multidrug-resistant M. tuberculosis strain.
Results
Increased intracellular growth of MKR inside host macrophages but not that of H37Rv
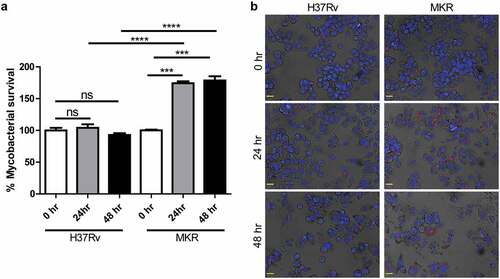
As prior epidemiological reports in Thailand have shown that the multidrug-resistant Mtb clonal outbreak Beijing strain MKR superspreader was prevalent [Citation3,Citation15,Citation21], we hypothesized that the MKR might have an enhanced intracellular growth capacity inside the host macrophages. We then determined the MKR’s intracellular growth by infecting human macrophage-differentiated THP-1 cells with the mCherry-expressing MKR or H37Rv at MOI of 10 for 1 hr. Cells were subsequently washed to get rid of the uninternalized mycobacteria. At 0, 24, and 48 hr after infection, cells were fixed and processed for high-content image analysis to determine the number of intracellular Mtb. The results showed a significant increase in the MKR’s intracellular growth at 24 and 48 hr after infection, while such effects were not observed with that of H37Rv (). The enhanced intracellular growth of the MKR when compared to that of H37Rv was also confirmed by CFU analysis (Supplementary Figure S1a). In addition, we determined the MKR’s ability to enter into host macrophages and found a slight but significant decrease in the MKR’s internalized rate when compared to that of H37Rv (Supplementary Figure S1b-c). Moreover, the in vitro growth rate of the MKR appeared to be slower than that of H37Rv (Supplementary Figure S2). These findings suggest that, upon entering into host cells, the MKR has an increased capability to grow intracellularly when compared to the reference strain H37Rv.
Figure 1. Intracellular survival rates of the MKR superspreader and H37Rv inside host macrophages.(a-b) THP-1 cells were infected with mCherry-expressing MKR superspreader or H37Rv for 1 hr. Cells were washed to eliminate the uninternalized mycobacteria. At 0, 24, and 48 hr after infection, cells were fixed and processed for high-content image analysis to determine intracellular mycobacterial number per cell. Percent mycobacterial survival was calculated and then compared (a). Representative images are shown in (b). Data are means ± SEM from at least three independent experiments; ns, non-significant, ***p < 0.001 and ****p < 0.0001, all relative to the 0 hr control set to 100%, were determined by one-way ANOVA with Tukey’s multiple comparison test. Bar 20 μm.
RNA-Seq and differential gene expression analyses
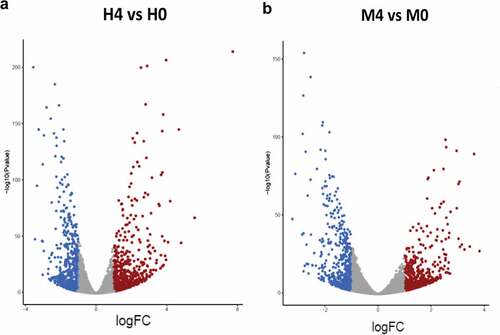
To identify the host factors contributing to the intracellular growth of MKR, RNA-Seq and differential gene expression analyses were performed on host macrophages infected with the MKR versus those infected by H37Rv to compare the response at 0 hr to that of 4 hr post-infection (T0 vs T4). RNA-Seq data derived from the uninfected macrophages at 0 hr and 4 hr post-infection were used as controls. Three biological replicates were performed and a mean of 40.8 ± 8.4 million paired reads per individual library were detected. The total reads of 78.3 ± 3.9% were mapped into the human reference genome GRCh38. The principal component analysis (PCA) plot showed that the samples were clustered by their biological replicates (). Subsequently, gene expression transcripts were counted and normalized for the differential gene expression analysis using DESeq2. RNA-Seq comparisons of the 2 infected time points revealed transcriptome profiles, in which 5,194 and 4,855 genes were differentially expressed in the host cells infected with H37Rv and MKR, respectively (fragments per kilobase of transcript per million mapped reads (FPKM) > 10 per sample and a false discovery rate (FDR) < 0.05) (; Supplementary Table S1). Among these, the expressions of 2,321 genes were increased, while those of 2,873 genes were decreased in the H37Rv-infected macrophages. In the MKR-infected macrophages, the expressions of 2,103 genes were increased, while 2,752 genes were decreased in their expressions.
Figure 2. Principle component analysis. Samples from the same experimental conditions appear to cluster together in accordance with their gene expression profiles. The first principal component (PC1) captures the gene expression profile differences across the 2 time points post-infection (0 and 4 hr post-infection), while the second principal component (PC2) captures the gene expression profile differences among H37Rv- and MKR-infected macrophages. TB0_H37RV, macrophages infected with H37Rv at 0 hr post-infection; TB4_H37RV, macrophages infected with H37Rv at 4 hr post-infection; TB0_MKR, macrophages infected with MKR at 0 hr post-infection; TB4_MKR, macrophages infected with MKR at 4 hr post-infection.
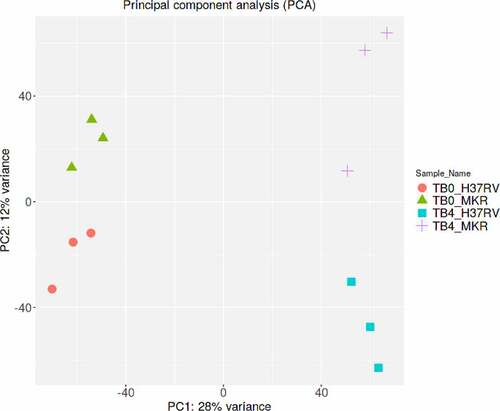
Figure 3. Differential gene expression analyses. (a-b) Volcano plots were used to determine the significantly different expressed transcripts among biological conditions (experimental group versus baseline): H4 vs H0 (a) and M4 vs M0 (b). Only log2(fold change) ≥ 2 or ≤ 2 and false discovery rate (FDR) adjusted p-values < 0.05 were analyzed. The upregulated transcripts were labelled in red and downregulated transcripts were labelled in blue. H0, macrophages infected with H37Rv at 0 hr post-infection; H4, macrophages infected with H37Rv at 4 hr post-infection; M0, macrophages infected with MKR at 0 hr post-infection; M4, macrophages infected with MKR at 4 hr post-infection.
qRT-PCR confirmation
Verification of the RNA-Seq results was conducted through qRT-PCR analyses, for which a set of 12 significantly DEGs in the host macrophages in response to MKR infection were validated (). Three technical replicates for each of the three biological replicates were tested for gene expression alteration. For relative quantification, the transcription levels of genes in the MKR-infected host macrophages at 4 hr post-infection were compared with their respective host cells at 0 hr post-infection control and normalized to the GAPDH gene. The 11 genes that were significantly up-regulated in the host macrophages infected with the MKR at 4 hr post-infection compared with that of 0 hr post-infection chosen for the qRT-PCR analyses were ALKAL1, MUC20, MAP3K4, NUPR1, RAB42, RGI3, SMIM25, SNAI1, TRAF2, TRIM63, and PMAIP1. Additionally, one significantly down-regulated gene in the MKR-infected macrophages at 4 hr versus that of 0 hr post-infection, EDN1, from the same differential gene expression analysis, was selected. The results showed that the qRT-PCR relative quantifications obtained from 11 out of 12 genes (with the exception of PMAIP1) were consistent with our RNA-Seq transcript expression data.
Figure 4. Validation of twelve DEGs in the MKR-infected macrophages by qRT-PCR. (a-l) THP-1 macrophages were infected with H37Rv or MKR at MOI 10 for 1hr and samples were analyzed at either 0 hr or 4 hr post-infection. Total RNAs were isolated and cDNAs were synthesized. The expression levels of twelve genes shown to be differentially expressed by the RNA-Seq data were quantified by qRT-PCR. 2−∆∆ct was used for normalization and relative quantification. Data are the means ± SEM from three independent experiments; ns, non-significant, *p < 0.05, **p < 0.01,***p < 0.001 and ****p < 0.0001, all relative to the respective 0 hr control set to 1.0 were determined by one-way ANOVA with Tukey’s multiple comparison test. M0, macrophages infected with MKR at 0 hr post-infection; M4, macrophages infected with MKR at 4 hr post-infection; M01, M02, M03 correspond to three biological repeats of macrophages infected with MKR at 0 hr post-infection; M41, M42, M43 correspond to three biological repeats of macrophages infected with MKR at 4 hr post-infection; FPKM, fragments per kilobase of transcript per million mapped reads.
Functional enrichment and network analyses
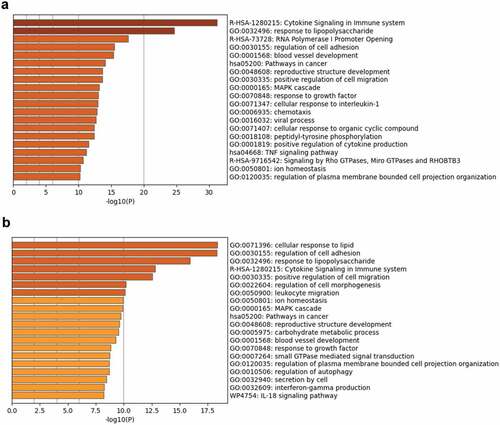
To determine the factors involved in regulating the growth of MKR inside the host macrophages, functional enrichment and network analyses were conducted. Ontology cluster assignments were used to determine and compare the potential functions of the upregulated DEGs between H37Rv- and MKR-infected macrophages at 4 hr versus that of 0 hr post-infection (). The results showed 11 ontology clusters: the cytokine signalling in the immune system, response to lipopolysaccharide, regulation of cell adhesion, positive regulation of cell migration, ion homoeostasis, MAPK cascade, pathways in cancer, reproductive structure development, blood vessel development, response to growth factor, and regulation of plasma membrane-bounded cell projection organization, to be enriched in both H37Rv- and MKR-infected macrophages. However, the results showed the enrichment of ontology clusters, which included the cellular response to lipid, regulation of cell morphogenesis, leukocyte migration, carbohydrate metabolic process, small GTPase mediated signal transduction, regulation of autophagy, secretion by cells, interferon-gamma production, and IL-18 signalling pathway to be uniquely upregulated in the MKR-infected macrophages at 4 hr versus that of 0 hr post-infection, but not in cells infected with H37Rv.
Figure 5. Functional enrichment analysis of the upregulated DEGs in the H37Rv- and MKR-infected macrophages was performed using Metascape.(a) Bar graph showing the top 20 enriched ontology clusters of the H37Rv-infected macrophages. (b) Bar graph showing the top 20 enriched ontology clusters of the MKR-infected macrophages. The enriched ontology clusters were ranked by -log10 p-value of gene enrichment.
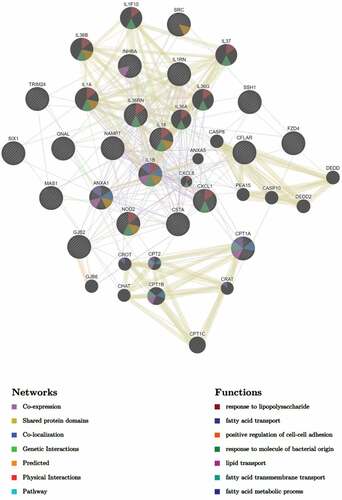
A network of interactions associated with the most significantly upregulated pathway in the MKR-infected macrophages, the cellular response to lipid pathway (), were analysed as well. To determine this, we subjected the DEGs in the cellular response to lipid pathway to GeneMANIA to identify any possible network interactions based on co-expression, shared protein domains, co-localization, genetic interactions, predicted, physical interactions, and pathway (). The results showed that the DEGs in the cellular response to lipid pathway exhibited network interactions to the fatty acid transport, lipid transport, fatty acid transmembrane transport, and fatty acid metabolic process pathways. Interestingly, the DEGs in the cellular response to lipid pathway also exhibited network interactions to the cellular response to bacteria pathways, which included the response to lipopolysaccharide and response to molecule of bacterial origin pathways. These interacted genes included CXCL1, CXCL8, IL-36A, IL-36B, IL-36G, IL-36RN, IL-37, IL-1F10, IL-1A, IL-1B, IL-18 and NOD2. As our recent study showed that the MKR up-regulates genes functioning in the cholesterol breakdown during its growth inside the host macrophages and this pathway is crucial for the MKR’s intracellular survival [Citation22], the IL-36 cytokines previously shown to play role in host cell cholesterol metabolism and defence against Mtb [Citation23] attracted our interest and were investigated further.
Figure 6. DEGs of the MKR-infected macrophages that function in the cellular response to the lipid pathway were subjected to network analysis using GeneMANIA. The network interactions identified included the fatty acid transport, lipid transport, and response to molecule of bacterial origin, as well as response to lipopolysaccharide, positive regulation of cell-cell adhesion, fatty acid transmembrane transport, and the fatty acid metabolic process.
The ratio of IL-36RN/IL-36G expression is increased in the MKR-infected macrophages when compared to that of the H37Rv-infected cells
The IL-36 signalling pathway comprises the IL-36 receptor (encoded by the IL-36 R gene), the pro-inflammatory cytokines IL-36α, IL-36β, and IL-36γ (encoded by the IL-36A, IL-36B, and IL-36G genes, respectively), and the IL-36 receptor antagonist IL-36Ra (encoded by the IL-36RN gene) [Citation24]. The IL-36 pro-inflammatory cytokines were previously demonstrated to function in host defence against M. bovis BCG and Mtb [Citation25]. Specifically, IL-36γ was shown to regulate host cell cholesterol metabolism and Mtb growth restriction in host macrophages [Citation23,Citation26]. On the other hand, IL-36Ra is a secreted molecule that can counteract the inflammatory effects of the IL-36 pro-inflammatory cytokines upon binding to the IL-36 receptor [Citation27].
Based on the ontology cluster enrichment and network interaction analyses mentioned above (), we then investigated the possible role of the IL-36 pathway in the intracellular growth regulation of the MKR inside the host macrophages. We looked into our RNA-Seq data for the expression changes of the IL-36 cytokines in host macrophages in response to the MKR infection. The expressions of IL-36A and IL-36B were not significantly different in either the H37Rv- or MKR-infected macrophages. Interestingly, we found that while the expressions of IL-36RN, encoding the negative regulator of the IL-36 pathway IL-36Ra, were significantly upregulated in both the H37Rv- and MKR-infected macrophages, the expression of IL-36G was found to be significantly augmented in the H37Rv-infected but not MKR-infected cells (). These results were verified by qRT-PCR (). Consequently, the expression ratio of IL-36RN over that of IL-36G was significantly higher in the MKR-infected macrophages when compared to those infected with H37Rv (). The data suggested that the increase in the IL-36RN/IL-36G expression ratio might contribute to the enhanced intracellular survival of the MKR.
Figure 7. IL-36RN/IL-36G expression ratio is increased in the MKR-infected macrophages when compared to those infected with H37Rv. (a-b) THP-1 macrophages were infected with H37Rv or MKR at MOI 10 for 1 hr and samples were analyzed at either 0 hr or 4 hr post-infection. The expression levels of IL-36RN(a) or IL-36G (b) transcripts were determined by RNA-Seq and presented as mapped reads. Data are means ± SEM from three independent experiments; ns, non-significant, *p < 0.05 and **p < 0.01, relative to the respective 0 hr control set of 1.0 were determined by one-way ANOVA with Tukey’s multiple comparison test. (c-d) The expressions of IL-36RN(c) or IL-36G (d) were then confirmed by qRT-PCR. 2−∆∆ct was used for normalization and relative quantification. Data are means ± SEM from at least three independent experiments; ns, non-significant and ****p < 0.0001, relative to the respective 0 hr control set of 1.0 were determined by one-way ANOVA with Tukey’s multiple comparison test. (e)The IL-36RN/IL-36G expression ratio of H37Rv- or MKR-infected macrophages was determined by dividing the respective normalized RNA-Seq mapped reads. *p < 0.05, relative to the H37Rv control set to 1.0 was determined by Student’s t-test. H0, macrophages infected with H37Rv at 0 hr post-infection; H4, macrophages infected with H37Rv at 4 hr post-infection; M0, macrophages infected with MKR at 0 hr post-infection; M4, macrophages infected with MKR at 4 hr post-infection.
IL-36RN is important for the MKR’s intracellular survival
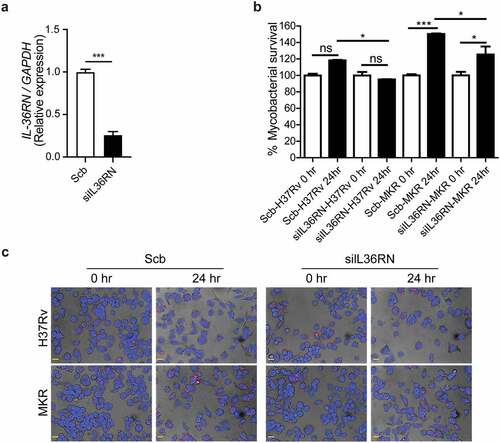
To determine whether the intracellular growth of the MKR could be regulated by the IL-36RN/IL-36G expression ratio, we depleted the IL-36RN expression from human the THP-1 cells using siRNA-knockdown technology. Successful knockdown was verified by qRT-PCR (). Cells were then infected with the mCherry-expressing MKR or H37Rv at MOI of 10 for 1 hr, washed to eliminate the uninternalized mycobacteria, and processed for high-content image analysis at the indicated time points to determine the number of intracellular Mtb. In agreement with our results in the wild-type macrophages, there was a significant increase in the intracellular growth of MKR inside the scrambled siRNA-transfected control cells at 24 hr post-infection. However, such an increase was not detected in the scrambled siRNA-transfected H37Rv-infected cells (). Upon IL-36RN depletion, however, a significant decrease in the MKR’s intracellular viability was observed at 24 hr post-infection when compared to that of the scrambled siRNA-transfected control cells (). These results were also confirmed by CFU analysis (Supplementary Figure S3a). Of note, we did not detect any difference in the Mtb internalization ability between cells transfected with scrambled control siRNAs and those transfected with siRNAs against IL-36RN (Supplementary Figure S3b-c). These findings supported the important role of IL-36RN in the intracellular survival of the MKR.
Figure 8. IL-36RN is crucial for the intracellular viability of MKR. (a)THP-1 cells were transfected with the non-targeted scrambled control (Scb) or IL-36RN-targeted siRNAs. The IL-36RN expression levels were then determined by qRT-PCR at 48 hr post-transfection. Data are means ± SEM from three independent experiments; ***p < 0.001, relative to Scb control set to 1.0 was determined by Student’s t-test. (b-c) siRNA-transfected THP-1 cells were infected with mCherry-expressing H37Rv or MKR for 1 hr and washed with complete media to get rid of the uninternalized mycobacteria. Cells were then further incubated in the complete media for 24 hr and subsequently processed for high-content image analysis to determine the intracellular mycobacterial number per cell. Percent mycobacterial survival was calculated and then compared (b). Representative images are shown in (c). Data are means ± SEM from at least three independent experiments; ns, non-significant, *p<0.05 and ***p < 0.001, all relative to the respective 0 hr control set to 100%, were determined by one-way ANOVA with Tukey’s multiple comparison test. Bar 20 μm.
IL-36RN/IL-36G expression ratio is augmented in the scrambled siRNA-transfected control cells infected with the MKR when compared to those infected with H37Rv and IL-36RN is crucial for the enhanced intracellular cholesterol level in host cells by the MKR
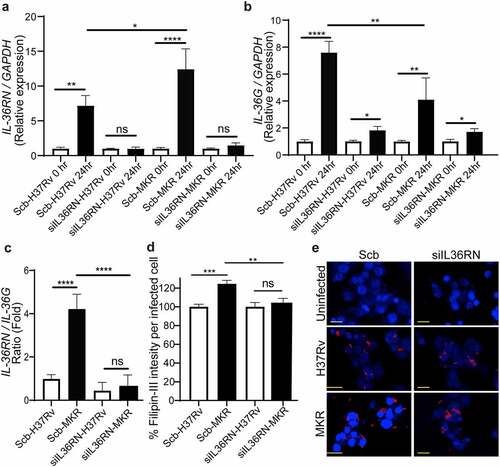
As our results in showed the increase in MKR’s intracellular growth inside the scrambled siRNA-transfected control macrophages at 24 hr post-infection but such effect could not be observed when the cells were infected with H37Rv and the MKR’s intracellular viability was decreased upon IL-36RN depletion, we then investigated the expressions of IL-36RN and IL-36G in these cells. We found that, similar to what we observed in the wildtype macrophages, the expressions of IL-36RN were significantly increased in both the H37Rv- and MKR-infected scrambled siRNA-transfected macrophages (). In the IL-36RN-deficient cells, however, such enhanced IL-36RN expression could no longer be detected (). In agreement with our findings observed with the wild-type macrophages, the expression of IL-36G was also found to be significantly augmented in the H37Rv-infected scrambled siRNA-transfected cells (). However, we could now detect a significant enhance in IL-36G expression when the scrambled siRNA-transfected macrophages were infected with the MKR, albeit less so when compared to that of the H37Rv-infected cells (). Consequently, the expression ratio of IL-36RN over that of IL-36G was significantly higher in the scrambled siRNA-transfected MKR-infected macrophages when compared to the cells infected with H37Rv (). These data supported that the increase in the IL-36RN/IL-36G expression ratio contributed to the enhanced MKR’s intracellular survival. As IL-36 cytokines were shown to regulate host cell cholesterol metabolism and Mtb growth inside host macrophages [Citation23,Citation26], we examined the intracellular cholesterol levels of host cells infected with the MKR or H37Rv. The results showed a significant increase in intracellular cholesterol level when scrambled siRNA-transfected control macrophages were infected with the MKR when compared to those infected with H37Rv (). Upon IL-36RN depletion, however, the augmented intracellular cholesterol level in the MKR-infected macrophages could no longer be observed. The results suggested the important role of IL-36RN in the enhanced intracellular cholesterol level in host cells by the MKR.
Figure 9. IL-36RN/IL-36G expression ratio is increased in the scrambled siRNA-transfected MKR-infected macrophages when compared to those infected with H37Rv and IL-36RN is important for the increased cholesterol level in host macrophages by the MKR. (a-b) THP-1 cells were transfected with the non-targeted scrambled control (Scb) or IL-36RN-targeted siRNAs. At 48 hr post transfection, cells were infected with H37Rv or MKR at MOI 10 for 1 hr and samples were analyzed at either 0 hr or 24 hr post-infection. The expression levels of IL-36RN(a) or IL-36G (b) transcripts were determined byqRT-PCR. 2−∆∆ct was used for normalization and relative quantification. Data are means ± SEM from at least three independent experiments; ns, non-significant, *p < 0.05, **p < 0.01 and ****p < 0.0001, relative to the respective 0 hr control set of 1.0 were determined by one-way ANOVA with Dunnett’s multiple comparison test. (c)The IL-36RN/IL-36G expression ratio of H37Rv- or MKR-infected macrophages transfected with scrambled control or IL-36RN-targeted siRNAs were determined by dividing the respective normalized relative expression at 24 hr post-infection from (a-b). ns, non-significant and ****p < 0.0001, relative to the scrambled siRNA-transfected H37Rv-infected control cells set to 1.0 were determined by one-way ANOVA with Tukey’s multiple comparison test. (d-e) THP-1 cells were transfected with the non-targeted scrambled control (Scb) or IL-36RN-targeted siRNAs. At 48 hr post transfection, cells were infected with mCherry-expressing H37Rv or MKR at MOI=10 for 1 hr and washed with complete media to get rid of the uninternalized mycobacteria. Cells were then further incubated in the complete media for 24 hr and subsequently processed for high-content image analysis to determine the intracellular cholesterol levels by Filipin-III staining. Percent Filipin-III intensity per infected cell were calculated and then compared (d). Representative images are shown in (e). Data are means ± SEM from at least three independent experiments; ns, non-significant, **p<0.01 and ***p < 0.001, all relative to the respective H37Rv-infected cells set to 100%, were determined by one-way ANOVA with Bonferroni’s multiple comparison test. Bar 20 μm.
Discussion
MDR-TB is a critical threat to TB control programs around the world. Previous epidemiological studies in Kanchanaburi, Thailand, exposed a significant outbreak of MDR-TB, with the causal agent confirmed as a member of the Mtb Beijing ST10 genotype [Citation3,Citation15] or more specifically L2.2.M3 (Asian African 3). This emergent multidrug-resistant Mtb strain was termed an “MKR superspreader,” and was later observed to have spread to other regions as well [Citation21]. The sublineage L2.2.M3 was also found in considerable numbers in Vietnam and China [Citation19]. However, the underlying mechanism for its extensive transmission in the community remains unclear. In this study, we attempted to study the biology of MKR by using RNA-Seq, functional enrichment, and network analyses to identify the host factors involved in the MKR’s intracellular growth inside the host macrophages. Our whole transcriptome analyses determined several significant DEGs which were up- or down-regulated in the macrophages infected with the MKR compared to those infected with the reference strain H37Rv (), verified by qRT-PCR (). Functional enrichment analyses of the significantly upregulated DEGs revealed that the cellular response to lipid pathway was the most significantly enriched and unique to the MKR-infected macrophages, but not of those infected with H37Rv, during Mtb intracellular growth (). Network analyses of significant DEGs in the cellular response to lipid pathway showed interactions with the response to bacteria pathways () and pointed to the possible involvement of the IL-36 cytokines in the intracellular survival of MKR. As our previous study showed that, during its proliferation inside the host macrophages, the MKR up-regulates gene function in the cholesterol breakdown pathway, which is essential for the intracellular viability of MKR [Citation22], and findings by others have demonstrated the function of IL-36 cytokines in host cell cholesterol metabolism and defence against Mtb [Citation23], further investigation concerning the possible involvement of IL-36 cytokines in the intracellular growth of MKR is warranted. Indeed, significant increases in the IL-36RN/IL-36G expression ratio were observed by both RNA-Seq and qRT-PCR analyses in the MKR-infected host cells compared to those infected with H37Rv (). Moreover, the reduced MKR’s intracellular survival and decreased intracellular cholesterol level in the MKR-infected host macrophages upon the depletion of IL-36RN, which encodes for the IL-36 receptor antagonist called IL-36Ra, supports the importance of this gene in the MKR’s intracellular viability and ability to increase host cell cholesterol ().
Recently, IL-36 cytokines have been described as members of the IL-1 cytokine family comprising a receptor (IL-36 R), three pro-inflammatory cytokines (IL-36α, IL-36β, and IL-36γ), and a receptor antagonist (IL-36Ra) [Citation24]. The IL-36Ra can compete with IL-36α, IL-36β, and IL-36γ for interaction with the IL-36 R, thus neutralizing the inflammatory effects exerted by the pro-inflammatory cytokines [Citation27]. In the context of infections, the IL-36 pro-inflammatory cytokines were recently demonstrated to play a role in host defence against multiple bacteria including Streptococcus pneumoniae, Klebsiella pneumoniae, Legionella pneumophila, M. bovis BCG, and Mtb [Citation23,Citation26,Citation28,Citation29]. It was also revealed that the IL-36 signalling resulted in the induction of type 1 immune responses crucial to the control of intracellular pathogens [Citation30,Citation31]. In the case of Mtb, induced production and secretion of IL-36γ was observed upon infection of host macrophages with the Mtb reference strain H37Rv, dependent upon the Toll-like receptor and MyD88 pathways [Citation26]. In addition, IL-36γ/IL-36 R signalling resulted in the induced production of antimicrobial peptides, leading to enhanced H37Rv elimination in the infected macrophages [Citation26]. Furthermore, a study indicated that IL-36γ promoted H37Rv elimination in the infected macrophages through the induction of autophagy [Citation32]. More interestingly, IL-36γ was recently demonstrated to regulate host cell cholesterol metabolism, including the suppression of cholesterol biosynthesis and induction of cholesterol efflux and turnover, leading to the restraint of H37Rv growth in host macrophages [Citation23]. In agreement with the previous findings, there was no increase in the growth rate of H37Rv at 24 and 48 hr post-infection (), unlike the MKR, which showed an increased growth rate inside the host macrophages. In addition, our RNA-Seq and qRT-PCR analyses showed that, while the expressions of IL-36RN encoding for the IL-36Ra were found to be increased in both H37Rv- and MKR-infected macrophages upon Mtb entry into host cells at 4 hr post-infection, only the expression of IL-36G was found to be up-regulated in macrophages infected with H37Rv, but not in the MKR-infected cells (). At 24 hr post-infection, increases in IL-36RN and IL-36G expressions were detected in both H37Rv- and MKR-infected cells, albeit more increase in IL-36RN and less increase in IL-36G expressions were seen in the MKR-infected macrophages when compared to that of H37Rv-infected cells (). This resulted in the increased expression ratio of IL-36RN/IL-36G in the MKR-infected macrophages (), which could spare the MKR from the IL-36γ-mediated elimination. Indeed, a decrease in the intracellular survival of MKR could be observed upon the depletion of IL-36RN (). Further investigations are warranted and are topics in our study to determine whether the increased intracellular viability of the MKR is due to the effects of the IL-36Ra on the inhibition of cholesterol efflux and turnover, alleviation of cholesterol biosynthesis suppression, and/or inhibition of autophagy and antimicrobial peptide production. However, as our previous study showed that the MKR up-regulates the genes implicated in cholesterol digestion during its growth inside the host macrophages, and this pathway is crucial for its intracellular survival [Citation22], examining the effects of IL-36Ra on host cell cholesterol, therefore, is of significant interest. Indeed, our preliminary investigation showed that host cell cholesterol level was enhanced in the MKR-infected macrophages when compared to those infected with H37Rv and that such effect was IL-36Ra dependent (). Whether this is due to the block in cholesterol efflux, inhibition in cholesterol turnover, or alleviation of cholesterol biosynthesis suppression awaits further examination.
Host cell cholesterol is a preferential nutrient source for Mtb [Citation33]. Recent studies also demonstrate that the synthesis of Mtb virulence lipids, which include PDIM and SLs [Citation34], depends on the cholesterol and fatty acid metabolism [Citation35]. PDIM was revealed to be crucial for Mtb to fight against host cell immune mediators [Citation36–38]. In addition, PDIM was shown to be needed for the Mtb phagosomal escape into the host cell cytosol [Citation39], resulting in the mycobacterial intracellular growth spurt and subsequent necrotic death of host cells, as well as Mtb extracellular growth and transmission [Citation33]. SLs were proven to inhibit the production of TNF-α, a host cytokine significant for granuloma formation and autophagy, and thus the Mtb containment [Citation40]. It might be possible that the increase in the IL-36RN/IL-36G expression ratio by the MKR in the infected macrophages may provide increased intracellular cholesterol available for the MKR and, together with the upregulation in its gene functioning in the cholesterol breakdown, the MKR thus has an increased ability to enhance its intracellular growth.
As mentioned above, the expression of IL-36G was found to be up-regulated in macrophages infected with H37Rv more than those infected with the MKR (). As IL-36γ production is dependent on the binding of different Mtb PAMPs to the Toll-like receptors 2 and 4 and subsequent signalling through MyD88 [Citation25], one could hypothesize that there may be differences in the Mtb PAMPs possessed by H37Rv and MKR, resulting in altered downstream signalling and leading to IL-36γ induction in the H37Rv-infected macrophages higher than those infected with the MKR. These Mtb PAMPs included lipoproteins, lipoarabinomannan, lipomannan, and Hsp65, in which the latter is recognized by Toll-like receptor 4, while the formers are recognized by Toll-like receptor 2 in the host macrophages [Citation26]. Further study will be needed to determine whether there is a difference in Mtb PAMPs between H37Rv and MKR or any alteration in the downstream signalling leading to IL-36γ induction.
Our data showed that a reduced MKR’s intracellular viability was observed upon depletion of IL-36RN (). It would be interesting to see whether treatment of the MKR-infected macrophages with the recombinant human IL-36γ would also result in the restriction of the MKR. This would suggest a potential targeting of the IL-36 pathway for treatment against the MKR. In addition, our previous study also showed that FDA-approved drugs that alter host cell cholesterol transportation can inhibit the intracellular growth of MKR [Citation22]. These included aripiprazole, which is currently employed for the treatment of depression and bipolar disorders [Citation41], and manidipine, currently utilized for the treatment of hypertension [Citation42]. These findings warrant further testing on FDA-approved or investigational drugs which possess the ability to alter host cell cholesterol levels or transport against the MKR.
Materials and methods
Cell and mycobacterial culture
Human monocytic THP-1 cells (ATCC TIB-202) were cultured in RPMI-1640 medium supplemented with 10% FBS, 4 mM L-glutamine, 10 mM HEPES, 1 mM sodium pyruvate, 4.5 g/L glucose and 0.05 mM 2-mercaptoethanol (Thermo Fisher Scientific) at 37°C and 5% CO2. M. tuberculosis reference strain H37Rv (BEI Resources; ATCC 25,618) and M. tuberculosis Beijing strain MKR superspreader (DS 5538) [Citation3,Citation15] were propagated in Middlebrook 7H9 medium supplemented with 0.05% Tween 80, 0.2% glycerol, and 10% oleic acid, albumin, dextrose, and catalase (BD Biosciences) at 37°C. The log-phase Mtb cultures were utilized in infection experiments and homogenized to generate a single-cell suspension. mCherry-expressing H37Rv and MKR [Citation22,Citation43] were grown in 7H9 medium, as described above, but supplemented with hygromycin (100 µg/mL; Invitrogen).
Macrophage infection and total RNA extraction
THP-1 cells were differentiated into macrophages by plating into 6-well plates (1.5 x 10⁶ cells per well) and then treated with 100 nM of PMA (Sigma) for 24 hr. The cells were then washed and allowed to rest for 24 hr in complete media without PMA. Mtb infection was carried out by centrifuging the different mycobacteria onto macrophages at MOI of 20 (1,200 rpm for 5 min at room temperature) and then further incubated with the bacteria at 37°C and 5% CO2 for 30 min, as previously described [Citation22,Citation44]. The Mtb-infected cells were washed with RPMI1640 complete media three times to get rid of the uninternalized mycobacteria (T0, 0 hr post-infection) and were left in complete media for 4 hr (T4, 4 hr post-infection). At T0 and T4, the media were aspirated off and Trizol (ThermoFisher) was added. In addition, uninfected cells at T0 and T4 were used as controls and were also subjected to Trizol solubilization. Nucleic acids were then isolated from each sample as previously described [Citation45]. The genomic DNAs were degraded using DNase (ThermoFisher). Subsequent total RNA isolation was done using the RNeasy kit (QIAGEN).
Illumina library construction
The total RNA concentration of each sample was measured by using a DeNovix fluorometer (DeNovix). Nanodrop (Thermofisher) was used to determine the sample purity. The Agilent 2100 Bioanalyser (Agilent) was used to assess the integrity of the total RNAs. One microgram of the total RNAs from each sample was then subjected to QIAseq FastSelect RNA removal and QIAseq stranded total RNA library preparation kits (QIAGEN) to create individually-indexed, strand-specific RNA-Seq libraries. QIAseq FastSelect – rRNA HMR (Human, mouse, rat) removal solution (QIAGEN, USA) was used to get rid of the ribosomal RNA and the reaction was subjected to fragmentation and cDNA synthesis. cDNAs were then isolated using the AMPure XP beads (Beckman Coulter Genomics). cDNAs were then ligated with the indexing adapters and the quality of the cDNA libraries was inspected by using an Agilent 2100 Bioanalyser (Agilent) followed by quantification using a DeNovix fluorometer (DeNovix). Equimolar quantity of the indexed sequencing libraries was then subjected to cluster generation and paired-end 2 × 150 nucleotides read sequencing on an Illumina Hiseq sequencer.
Differential gene expression analyses of RNA-Seq data
Trimmomatic V0.32 [Citation46] was used to trim the adapters and eliminate the low-quality reads by applying the following parameters, ILLUMINACLIP: TruSeq3-PE.fa:2:30:10, LEADING:3, TRAILING:3, SLIDINGWI NDOW:4:15, and MINLEN:36. The residual high-quality reads were mapped to the human reference genome GRCh38 by using HISAT2 [Citation47]. The featureCounts (Version 1.4.6) was then used to quantify the number of reads per transcript. Subsequently, DESeq2 V1.24.0 [Citation48] was utilized to recognize DEGs between two experimental conditions. The Benjamini – Hochberg method was applied to adjust the p-values (≤0.05) for multiple test correction.
Functional enrichment and network analyses
To ascertain significantly enriched ontology clusters under the default settings, DEGs were subjected to GO functional analysis using Metascape software [Citation49]. Only clusters with enrichment scores of greater than 0.5 were considered. Moreover, the network analyses of the genes of interest were evaluated using GeneMANIA [Citation50].
RNA-Seq verification and qRT-PCR
Using random hexamers (Qiagen), 500 ng of total RNAs were reverse-transcribed. Primers used in this study were shown in the Supplementary Table S2 (Ward Medick). qRT-PCR analyses were then conducted using a thermocycler (Eco 48 Real-time PCR System, Illumina) with 2X PerfeCTa SYBR Green SuperMix (QuantaBio) and 0.2 mM forward and reverse primers at various annealing temperatures (54–66 °C). The specificity of the PCR products was verified by using the melting curve analyses. All threshold signals more than 95% efficient was obtained. The signals were normalized to the housekeeping GAPDH transcript and presented as relative quantification using the 2−∆∆ct method.
siRNA-mediated knockdown
In brief, THP-1 cells were harvested and re-suspended in 90 µL of human monocyte nucleofector solution (VPA-1007; Lonza). Scrambled siRNAs or siRNAs against IL-36RN (Dhamacon; 1.5 µg/reaction) were then added to the cells and the cell suspension was transferred into an electroporation cuvet and nucleofected using the Amaxa Nucleofector apparatus (Amaxa Biosystems) with programme Y-001, as previously described [Citation44]. Cells were harvested and plated for assays at 24 hr after transfection.
Intracellular Mtb survival assay
Intracellular Mtb survival assay was conducted by plating the THP-1 cells in 96-well black plates (7 x 10⁴ cells per well) and differentiated them into macrophages using 100 nM PMA, as described above. The macrophages were then infected with mCherry-expressing H37Rv or MKR at MOI of 10 by centrifuging Mtb onto the host cells (1,200 rpm for 5 min at room temperature) and then further incubated with the bacteria at 37°C and 5% CO2 for 1 hr as previously described [Citation22,Citation44]. The uninternalized mycobacteria were then removed by washing the cells with the complete media three times. Cells were further incubated in the complete media and at the indicated time points, cells were fixed with 4% paraformaldehyde for 30 min, stained with Hoechst for 15 min, and subjected to high-content image analysis (Operetta, PerkinElmer) to obtain the number of intracellular Mtb per cell [Citation22,Citation51]. Images were acquired from at least 7 different fields and more than 75 Mtb-infected cells were counted per well. Percent mycobacterial survival of each strain was then calculated relative to that of the 0 hr post-infection control set to 100%.
Filipin III intracellular cholesterol staining
THP-1 cells were seeded in 96-well black plates (7 x 10⁴ cells per well) and differentiated into macrophages using 100 nM PMA, as described above. Cells were then infected with mCherry-expressing H37Rv or MKR or left uninfected for 1 hr. Cells were washed three times with complete media to get rid of the uninternalized mycobacteria. Cells were fixed at 24 hr post-infection with 4% paraformaldehyde for 15 min and then washed with PBS three times. To stain with Filipin III, stock solution (Sigma; 10 mg/mL) was diluted to 1:100 with 3% BSA in PBS and added to the cells for 2 hr at room temperature in the dark. Cells were then washed once with PBS and subjected to high content image analysis to determine the Filipin-III intensity per cell. Images were acquired from at least 7 different fields and more than 75 Mtb-infected cells were counted per well. Percent Filipin-III intensity per infected cell was then calculated and compared.
Statistical analyses
All experiments were conducted at least three times. The data were pooled to compute the mean and standard errors of mean. All data were analysed by Prism 5.0 software (GraphPad). p values corrected for multiple testing of less than 0.05 were considered to indicate statistical significance.
Author contributions
P.P., T.S., T.L., P.K., T.K., and A.R. conducted the experiments and analysed the data with the help of S.B., P.P. A.C. and M.P.; M.P. conceived the idea and supervised all research; P.P. and M.P. wrote the manuscript. All authors revised the manuscript.
Supplemental Material
Download PDF (795 KB)Acknowledgements
This work was supported by the National Research Council of Thailand (Grant # N41A640157), the Health Systems Research Institute (Grant # HSRI63-039) and the Faculty of Science, Mahidol University to M.P. and partially supported by the Mahidol University-Multidisciplinary Research Center grant to P.P. and the Drug Resistant Tuberculosis Research Fund, Siriraj Foundation under the patronage to pass HRH Princess Galyanivadhana to A.C.
Disclosure statement
No potential conflict of interest was reported by the author(s).
Data availability statement
The RNA-Seq data have been uploaded to the Gene Expression Omnibus (GEO) database (Accession number GSE194017).
Supplementary material
Supplemental data for this article can be accessed online at https://doi.org/10.1080/21505594.2022.2135268
References
- WHO. Global tuberculosis report. 2019 .
- Brudey K, Driscoll JR, Rigouts L, et al. Mycobacterium tuberculosis complex genetic diversity: mining the fourth international spoligotyping database (SpolDB4) for classification, population genetics and epidemiology. BMC Microbiol. 2006 Mar 6;6(1):23. DOI:10.1186/1471-2180-6-23
- Regmi SM, Chaiprasert A, Kulawonganunchai S, et al. Whole genome sequence analysis of multidrug-resistant Mycobacterium tuberculosis Beijing isolates from an outbreak in Thailand. Mol Genet Genomics. 2015 Oct;290(5):1933–1941.
- Dormans J, Burger M, Aguilar D, et al. Correlation of virulence, lung pathology, bacterial load and delayed type hypersensitivity responses after infection with different Mycobacterium tuberculosis genotypes in a BALB/c mouse model. Clin Exp Immunol. 2004 Sep;137(3):460–468.
- Hanekom M, van der Spuy GD, Streicher E, et al. A recently evolved sublineage of the Mycobacterium tuberculosis Beijing strain family is associated with an increased ability to spread and cause disease. J Clin Microbiol. 2007 May;45(5):1483–1490.
- Portevin D, Gagneux S, Comas I, et al. Human macrophage responses to clinical isolates from the Mycobacterium tuberculosis complex discriminate between ancient and modern lineages. PLoS Pathog. 2011 Mar;7(3):e1001307.
- Tsenova L, Ellison E, Harbacheuski R, et al. Virulence of selected Mycobacterium tuberculosis clinical isolates in the rabbit model of meningitis is dependent on phenolic glycolipid produced by the bacilli. J Infect Dis. 2005 Jul 1;192(1):98–106. DOI:10.1086/430614
- van der Spuy GD, Kremer K, Ndabambi SL, et al. Changing Mycobacterium tuberculosis population highlights clade-specific pathogenic characteristics. Tuberculosis. 2009 Mar;89(2):120–125.
- Zhang M, Gong J, Yang Z, et al. Enhanced capacity of a widespread strain of Mycobacterium tuberculosis to grow in human macrophages. J Infect Dis. 1999 May;179(5):1213–1217.
- Russell DG. Who puts the tubercle in tuberculosis? Nature Rev Microbiol. 2007 Jan;5(1):39–47.
- Peddireddy V, Doddam SN, Ahmed N. Mycobacterial dormancy systems and host responses in tuberculosis. Front Immunol. 2017;8:84.
- Pajuelo D, Gonzalez-Juarbe N, Tak U, et al. NAD(+) depletion triggers macrophage necroptosis, a cell death pathway exploited by Mycobacterium tuberculosis. Cell Rep. 2018 Jul 10;24(2):429–440. DOI:10.1016/j.celrep.2018.06.042
- Behar SM, Divangahi M, Remold HG. Evasion of innate immunity by Mycobacterium tuberculosis: is death an exit strategy? Nat Rev Microbiol. 2010 Sep;8(9):668–674.
- Lerner TR, Borel S, Greenwood DJ, et al. Mycobacterium tuberculosis replicates within necrotic human macrophages. J Cell Biol. 2017 Mar 6;216(3):583–594. DOI:10.1083/jcb.201603040
- CWT J, Henpraserttae N, Sanguanwongse N, et al. Community outbreak of multidrug resistance tuberculosis, Kanchanaburi province, Thailand on 2002-June 2010. J Preventive Med Assoc Thail. 2011;1:261–271.
- Chen YY, Chang JR, Huang WF, et al. Genetic diversity of the Mycobacterium tuberculosis Beijing family based on SNP and VNTR typing profiles in Asian countries. PLoS One. 2012;7(7):e39792. DOI:10.1371/journal.pone.0039792
- Faksri K, Drobniewski F, Nikolayevskyy V, et al. Genetic diversity of the Mycobacterium tuberculosis Beijing family based on IS6110, SNP, LSP and VNTR profiles from Thailand. Infect Genet Evol. 2011 Jul;11(5):1142–1149.
- Iwamoto T, Grandjean L, Arikawa K, et al. Genetic diversity and transmission characteristics of Beijing family strains of Mycobacterium tuberculosis in Peru. PLoS One. 2012;7(11):e49651. DOI:10.1371/journal.pone.0049651
- Thawornwattana Y, Mahasirimongkol S, Yanai H, et al. Revised nomenclature and SNP barcode for Mycobacterium tuberculosis lineage 2. Microb Genom. 2021 Nov;7(11). DOI:10.1099/mgen.0.000697
- Ajawatanawong P, Yanai H, Smittipat N, et al. A novel Ancestral Beijing sublineage of Mycobacterium tuberculosis suggests the transition site to Modern Beijing sublineages. Sci Rep. 2019 Sep 23;9(1):13718. DOI:10.1038/s41598-019-50078-3
- Disratthakit A, Meada S, Prammananan T, et al. Genotypic diversity of multidrug-, quinolone- and extensively drug-resistant Mycobacterium tuberculosis isolates in Thailand. Infect Genet Evol. 2015 Jun;32:432–439.
- Aiewsakun P, Prombutara P, Siregar TAP, et al. Transcriptional response to the host cell environment of a multidrug-resistant Mycobacterium tuberculosis clonal outbreak Beijing strain reveals its pathogenic features. Sci Rep. 2021 Feb 4;11(1):3199. DOI:10.1038/s41598-021-82905-x
- Ahsan F, Maertzdorf J, Guhlich-Bornhof U, et al. IL-36/LXR axis modulates cholesterol metabolism and immune defense to Mycobacterium tuberculosis. Sci Rep. 2018 Jan 24;8(1):1520. DOI:10.1038/s41598-018-19476-x
- Bassoy EY, Towne JE, Gabay C. Regulation and function of interleukin-36 cytokines. Immunol Rev. 2018 Jan;281(1):169–178.
- Penaloza HF, van der Geest R, Ybe JA, et al. Interleukin-36 cytokines in infectious and non-infectious lung diseases. Front Immunol. 2021;12:754702.
- Ahsan F, Moura-Alves P, Guhlich-Bornhof U, et al. Role of Interleukin 36gamma in host defense against tuberculosis. J Infect Dis. 2016 Aug 1;214(3):464–474. DOI:10.1093/infdis/jiw152
- Towne JE, Renshaw BR, Douangpanya J, et al. Interleukin-36 (IL-36) ligands require processing for full agonist (IL-36alpha, IL-36beta, and IL-36gamma) or antagonist (IL-36ra) activity. J Biol Chem. 2011 Dec 9;286(49):42594–42602. DOI:10.1074/jbc.M111.267922
- Kovach MA, Singer B, Martinez-Colon G, et al. IL-36gamma is a crucial proximal component of protective type-1-mediated lung mucosal immunity in Gram-positive and -negative bacterial pneumonia. Mucosal Immunol. 2017 Sep;10(5):1320–1334.
- Nanjo Y, Newstead MW, Aoyagi T, et al. Overlapping roles for interleukin-36 cytokines in protective host defense against Murine Legionella pneumophila Pneumonia. Infect Immun. 2019 Jan;87(1). DOI:10.1128/IAI.00583-18
- Gresnigt MS, Rosler B, Jacobs CW, et al. The IL-36 receptor pathway regulates Aspergillus fumigatus-induced Th1 and Th17 responses. Eur J Immunol. 2013 Feb;43(2):416–426.
- Vigne S, Palmer G, Martin P, et al. IL-36 signaling amplifies Th1 responses by enhancing proliferation and Th1 polarization of naive CD4+ T cells. Blood. 2012 Oct 25;120(17):3478–3487. DOI:10.1182/blood-2012-06-439026
- Gao Y, Wen Q, Hu S, et al. IL-36gamma promotes killing of Mycobacterium tuberculosis by macrophages via WNT5A-induced noncanonical WNT signaling. J Immunol. 2019 Aug 15;203(4):922–935. DOI:10.4049/jimmunol.1900169
- Huang L, Nazarova EV, Russell DG. Mycobacterium tuberculosis: bacterial fitness within the host macrophage. Microbiol Spectr. 2019 Mar;7(2). DOI:10.1128/microbiolspec.BAI-0001-2019.
- Quadri LE. Biosynthesis of mycobacterial lipids by polyketide synthases and beyond. Crit Rev Biochem Mol Biol. 2014 May-Jun;49(3):179–211.
- Fieweger RA, Wilburn KM, VanderVen BC. Comparing the metabolic capabilities of bacteria in the Mycobacterium tuberculosis complex. Microorganisms. 2019 Jun 18;7(6):177. DOI:10.3390/microorganisms7060177
- Day TA, Mittler JE, Nixon MR, et al. Mycobacterium tuberculosis strains lacking surface lipid phthiocerol dimycocerosate are susceptible to killing by an early innate host response. Infect Immun. 2014 Dec;82(12):5214–5222.
- Kirksey MA, Tischler AD, Simeone R, et al. Spontaneous phthiocerol dimycocerosate-deficient variants of Mycobacterium tuberculosis are susceptible to gamma interferon-mediated immunity. Infect Immun. 2011 Jul;79(7):2829–2838.
- Rousseau C, Winter N, Pivert E, et al. Production of phthiocerol dimycocerosates protects Mycobacterium tuberculosis from the cidal activity of reactive nitrogen intermediates produced by macrophages and modulates the early immune response to infection. Cell Microbiol. 2004 Mar;6(3):277–287.
- Constant P, Perez E, Malaga W, et al. Role of the pks15/1 gene in the biosynthesis of phenolglycolipids in the Mycobacterium tuberculosis complex. Evidence that all strains synthesize glycosylated p-hydroxybenzoic methyl esters and that strains devoid of phenolglycolipids harbor a frameshift mutation in the pks15/1 gene. J Biol Chem. 2002 Oct 11;277(41):38148–38158. DOI:10.1074/jbc.M206538200
- Okamoto Y, Fujita Y, Naka T, et al. Mycobacterial sulfolipid shows a virulence by inhibiting cord factor induced granuloma formation and TNF-α release. Microb Pathogs. 2006 Jun;40(6):245–253.
- Gettu N, Saadabadi A. Aripiprazole. Treasure Island (FL): StatPearls; 2020.
- McKeage K, Scott LJ. Manidipine: a review of its use in the management of hypertension. Drugs. 2004;64(17):1923–1940.
- Carroll P, Schreuder LJ, Muwanguzi-Karugaba J, et al. Sensitive detection of gene expression in mycobacteria under replicating and non-replicating conditions using optimized far-red reporters. PLoS One. 2010 Mar 23;5(3):e9823. DOI:10.1371/journal.pone.0009823
- Ponpuak M, Delgado MA, Elmaoued RA, et al. Monitoring autophagy during Mycobacterium tuberculosis infection. Methods Enzymol. 2009;452:345–361.
- Benjak A, Sala C, Hartkoorn RC. Whole-transcriptome sequencing for high-resolution transcriptomic analysis in Mycobacterium tuberculosis. Methods Mol Biol. 2015;1285:17–30.
- Bolger AM, Lohse M, Usadel B. Trimmomatic: a flexible trimmer for Illumina sequence data. Bioinformatics. 2014 Aug 1;30(15):2114–2120. DOI:10.1093/bioinformatics/btu170
- Kim D, Paggi JM, Park C, et al. Graph-based genome alignment and genotyping with HISAT2 and HISAT-genotype. Nat Biotechnol. 2019 Aug;37(8):907–915.
- Love MI, Huber W, Anders S. Moderated estimation of fold change and dispersion for RNA-seq data with DESeq2. Genome Biol. 2014;15(12):550.
- Zhou Y, Zhou B, Pache L, et al. Metascape provides a biologist-oriented resource for the analysis of systems-level datasets. Nat Commun. 2019 Apr 3;10(1):1523. DOI:10.1038/s41467-019-09234-6
- Warde-Farley D, Donaldson SL, Comes O, et al. The GeneMANIA prediction server: biological network integration for gene prioritization and predicting gene function. Nucleic Acids Res. 2010 Jul;38(suppl_2):W214–20.
- Laopanupong T, Prombutara P, Kanjanasirirat P, et al. Lysosome repositioning as an autophagy escape mechanism by Mycobacterium tuberculosis Beijing strain. Sci Rep. 2021 Feb 22;11(1):4342. DOI:10.1038/s41598-021-83835-4