
ABSTRACT
Chitinase plays an important role in plant resistance against chitin-containing pathogens through hydrolysis of chitin. Clubroot caused by Plasmodiophora brassicae is a major disease for cruciferous crops and vegetables worldwide. The cell wall of P. brassicae resting spores contains chitin. Chitinase is regarded as capable of improving plant resistance to fungal diseases. However, there has been no report about the function of chitinase in P. brassicae. Here, wheat germ agglutinin staining and commercial chitinase treatment demonstrated that chitin is a functional component in P. brassicae. In addition, Chitinase PbChia1 was identified by chitin pull-down assay combined with LC-MS/MS. PbChia1 was found to be a typical secreted chitinase, which could bind chitin with chitinase activity in vitro. PbChia1 could significantly decrease the resting spores of P. brassicae and therefore relieve the severity of clubroot symptom, with a biocontrol effect of 61.29%. Overexpression of PbChia1 in Arabidopsis thaliana improved its resistance to P. brassicae, increased host survival rate and seed yield, enhanced PAMPs-triggered reactive oxygen species burst, MAPK activation and expression of immune-related genes. PbChia1 transgenic plants also showed resistance to other pathogens, such as biotrophic bacterium Pst DC3000, necrotrophic fungi Sclerotinia sclerotiorum and Rhizoctonia solani. These findings indicate that chitinase PbChia1 is a candidate gene that can confer broad-spectrum disease resistance in breeding.
Introduction
Clubroot is a major disease for brassica crops and vegetables (such as rapeseed, cabbages and broccoli), and can cause 10%–15% yield reduction worldwide [Citation1]. Plasmodiophora brassicae is a soil-borne pathogen and obligate intracellular biotroph protist belonging to the supergroup Rhizaria [Citation2]. Galls are formed on the roots of infected plants, leading to stunting, wilting, and even death of the plants [Citation3]. The disease is found in brassica growing areas all over world. The resting spores of P. brassicae can survive in the soil for a long time and there is currently no effective way to completely remove the pathogen from the infected soil. In most life cycle of P. brassicae, it is parasitized in host cells and uncultivable on synthetic medium, and there is no available transformation system, making it more difficult to study the gene function and pathogenesis of P. brassicae than those of fungi and oomycetes [Citation4–6]. There have been reports about the functions of only a few genes, while the genome of P. brassicae was reported five years ago [Citation7,Citation8], providing great opportunities to explore the related gene families and predict their functional roles [Citation9–11]. P. brassicae effectors have been demonstrated to play important roles in the infection and subsequent disease progression [Citation12–16]. Dissection of the pathogenic mechanism is critical for the breeding of plants against clubroot disease. Since Arabidopsis is susceptible to P. brassicae, it may serve as a good system for studying P. brassicae and plant interaction.
Chitin is a polymer N-acetyl-d-glucosamine linked by β-1,4 glycosidic bond. It is the most abundant polymer in the nature, and is widely present in shrimp and crab shells, insect carapaces, and fungal cell walls, including the resting spores of P. brassicae [Citation17,Citation18]. Cell wall is an essential structure that determines the cell shape and protect the cells. Chitin is a main component in the cell wall of pathogenic fungi, playing important roles in the growth and development of fungi [Citation19]. Chitin has also been identified as an important signal inducing natural plant immunity to pathogen invasion [Citation20]. For example, perception of chitin can enhance the disease resistance of rice [Citation21], while enhance plant immunity in Arabidopsis [Citation22]. Chitin compost and broth can suppress the formation of clubroot [Citation23]. P. brassicae has two chitin synthase families and there are abundant chitin-related enzymes in the secretome [Citation8]. Two candidate CBM18 secreted effector proteins in P. brassicae, PbChiB2 and PbChiB4, suppress the chitin-triggered activation of MAPK in Brassica napus [Citation24].
Chitinase is an enzyme system that hydrolyzes chitin into N-acetyl-oligosaccharides and glucose. It is widely found in higher plants and is considered as a subgroup of pathogenesis-related (PR) proteins; when plants are under abiotic stress or pathogen infection, chitinase will be rapidly accumulated [Citation25–27]. Therefore, chitinase plays an important role in plant resistance, and an increase in chitinase activity of plants can inhibit spore germination and mycelial growth, or degrade chitin in cell walls [Citation28,Citation29]. For instance, transferring chitinase genes into tobacco will increase its resistance to Fusarium wilt, and introduction of rice chitinase genes into tomato will enhance its resistance to Fusarium wilt and early blight [Citation30]. In addition, expression of wheat chitinase genes in grapes will improve the resistance to downy mildew [Citation31], and that in rose will reduce black spot development [Citation32]. A total of 33 chitinase genes have been identified in B. rapa genome, and treatment with chitin oligosaccharides was found to ameliorate clubroot symptoms [Citation33]. Chitinase is considered as a candidate defence-related gene against chitin-containing pathogens [Citation34]. Function analysis of chitinase has been carried out in various plant species, such as tomato [Citation35], potato [Citation36], rice [Citation37] and apple [Citation38], but the role of the chitinase gene family of P. brassicae in the growth and development of clubroot remains unknown.
This study aims to characterize the chitin extracted from P. brassicae and identify the chitinases. As a result, a secreted chitinase, PbChia1, was found in the genome of P. brassicae. We further identified and clarified the function of PbChia1 in the development of P. brassicae, as well as investigated the function of PbChia1 in improving P. brassicae resistance in Arabidopsis transgenic plants. This gene may be of great significance for the control of P. brassicae in breeding for clubroot resistance.
Materials and methods
Plant materials and growth conditions
Arabidopsis and rapeseed cultivar Huashuang 4 plants were grown in a growth chamber at 22–23 °C under 12/12 light/dark cycle with 75% humidity.
Pathogen inoculation
For P. brassicae inoculation, the clubroot of rapeseed in the field was collected and the resting spores were extracted and stored at 4 °C [Citation39]. Then, 14-day-old Arabidopsis or rapeseed plants were inoculated with P. brassicae at 1.0 × 10⁶ spores per plant. The disease severity of clubroot was evaluated using a scoring system of 0–4 for Arabidopsis and 0–9 for rapeseed [Citation40,Citation41]. For inoculation with Pst DC3000, bacteria were cultured in King’s Medium B with 50 µg/ml rifampicin at 28 °C, and then collected, re-suspended and diluted with 2.5 mM MgCl2, syringe-infiltrated at 5 × 10⁵ cfu/ml to the leaves of 4-week-old plants. The leaves were then wiped clean until returning to pre-infiltration appearance, and then the plants were covered with a clear plastic dome for 3–4 days. For quantification of the Pst DC3000 bacterial population, leaf disks were ground in 2.5 mM MgCl2 buffer and plated on King’s Medium B plates containing 50 µg/ml rifampicin, followed by counting of the bacteria. For S. sclerotiorum inoculation, five- or six-week leaves (before flowering) were detached and placed in petri dishes with filter paper. Then, a 2-mm diameter mycelial block of S. sclerotiorum was inoculated on the surface of leaves, and some water was sprayed to the leaves to maintain high humidity until the necrotic lesions were observed and the lesion area was measured. Nine biological replicates were performed for each sample. For R. solani inoculation, R. solani was cultured on potato dextrose agar (PDA) plates for 2 d. Then, 10 mycelial blocks with a diameter of 5 mm at the edge of the colony were inoculated to liquid PD medium and cultured at 22 °C under shaking for 7 d. The mycelium was broken with a homogenizer, and 1 ml of broken mycelium was inoculated to the roots of 14-day-old Arabidopsis plants, which were then covered with a clear plastic dome to keep high humidity for 3 d. The disease severity was evaluated using a 0–4 scoring system, with grade 0 indicating no disease symptom on the stem, grade 1 indicating that the expanded area of the stem disease spot is less than 1/2 of the stem circumference and no disease symptom at the root, grade 2 representing that the expanded area of the stem disease spot was above 1/2 of the stem circumference, and the roots have no symptoms, grade 3 indicating that the expanded area of the stem lesions was above 1/2 of the stem circumference and the root is infected, and grade 4 representing that the plant is wilting and dying.
Chitin extraction and determination from P. brassicae
Crude chitin was extracted from P. brassicae. About 15 g of fresh root galls was ground into power with liquid nitrogen, followed by the addition of 5 ml deionized water for dissolution. After centrifugation at 12,000 g and 4 °C for 10 min, the samples were freeze-dried overnight in vacuum. About 5 g of dried pellets was taken and added with 30 ml of 6 M HCl, and then the chitin content in P. brassicae was measured with a method described previously [Citation42].
Fourier transform infrared spectroscopy (FTIR), X-ray diffraction (XRD) and thermo gravimetry analysis (TGA)
The FTIR, XRD and TGA of crude chitin extracts from P. brassicae and commercial chitin (Sigma, CAS No. 1398-61-4) were performed by Shanghai Sci Go Company. The data of FTIR, XRD and TGA were analysed according to previous descriptions [Citation43].
Identification of chitinase family genes in P. brassicae
The genome of P. brassicae was downloaded from the GenBank (accession number is MCBL01000000) [Citation44]. Blast2GO was used to systematically investigate the chitinase, and the proteins containing the glycosyl hydrolase domain were classified into the chitinase family. Then, website SMART databases (http://smart.embl-heidelberg.de/) and NCBI CDD (http://blast.ncbi.nlm.nih.gov) were used to further confirm the chitinase genes. CELLO v.2.5 (http://cello.life.nctu.edu.tw/) was used to predict the subcellular localization.
Phylogenetic analysis of chitinase from P. brassicae
The full-length protein sequences or conserved domains of chitinase from P. brassicae were determined using the MEGA 6.0 software and neighbour joining techniques were used to construct phylogenetic trees [Citation45].
Colloidal chitin preparation, chitinase screening and chitinase activity assay.
The 2% colloidal chitin was prepared as previously reported [Citation46], to be used as the substrate to screen the chitinase. About 10 g of rapeseed galls was ground into power under liquid nitrogen and dissolved in 30 ml lysis buffer at 4 °C under shaking. After centrifugation at 12,000 g for 10 min at 4 °C, the supernatant was filtered using a syringe filter (0.22 mm, Millipore). The 2% colloidal chitin was incubated with supernatant at 4 °C for 2 h under shaking. The sediment was analysed by liquid chromatography tandem mass spectrometry (LC-MS/MS, Thermo Fisher Scientific). A method previously described was used to test whether the recombinant protein had chitinase activity [Citation42]. A commercial chitinase activity assay kit (Beijing Boxbio Science & Technology Co. Ltd, Beijing) was used to test plant chitinase activity. Leaf samples were ground under liquid nitrogen and protein extracts were prepared as previously described [Citation47].
Expression and purification of fusion proteins and chitin pull-down assay
The full-length cDNA of PbChia1 without signal peptide was amplified by PCR using PbChia1-BamHI-F and PbChia1-BamHI-R primers (Table S3) with BamHI restriction enzyme sites and inserted into pGEX-6P1 and pET-28a, for GST fusion and His-tagged recombinant protein, respectively. GST fusion proteins and His-tagged proteins were purified using glutathione resin (GenScript, Cat. No. L00206) and Ni-NTA resin (GenScript, Cat. No. L00250), respectively, and then stored at −80 °C. After purification of the fusion proteins, the chitin pull-down assay was performed as previously described [Citation48].
Validation of signal peptide in yeast cells
Yeast invertase assay was used to assess the secretory activity of the signal peptide [Citation49]. The signal peptide of PbChia1 was cloned into pSUC2 plasmid with EcoRI/XhoI restriction enzyme sites. The LiAc method was used to transform the plasmid into yeast strain YTK12 [Citation50]. Invertase enzymatic activity was detected as previously described [Citation51].
Chitinase treatment on clubroot
Rapeseed cultivar Huashuang 4 seeds were surface-sterilized and germinated in a Petri dish for 7 d, and then transferred to tubes with 10 ml 1/2 Hoagland nutrient solution, and grown in a plant growth chamber at 22–23 ℃ with a 16/8 h day/night cycle. Each plant was inoculated with 1 ml of P. brassicae resting spores (1 × 10⁷ spores/ml), followed by the addition of commercial chitinase (Sigma C6137, chitinase extract from Streptomyces griseus) or purified PbChia1 protein (0.005 U/ml) to the tube to check the clubroot resistance. Some 1/2 Hoagland nutrient solution was added to the tubes every day to avoid dryness, and the Hoagland nutrient solution was completely changed each 7 d to avoid contamination. To test whether the chitinase affects the germination rate of resting spores, commercial chitinase or purified PbChia1 protein was incubated with P. brassicae resting spores for 3 or 6 d in host root exudates (rapeseed seedlings). DAPI (4’-6-diamidino-2-phenylindole-dihydrochloride) staining was used to measure the germination rate of resting spores [Citation9].
RNA isolation, DNA isolation and quantitative PCR
Plant materials or root galls were washed with water, and then grounded in liquid nitrogen, followed by total RNA extraction with the TRIZOL reagent [Citation52]. RNA samples were treated with DNase I to remove genomic DNA. Oligo (dT)18 primer was used for reverse transcription polymerase chain reaction, and cDNA was used as template for quantitative PCR (qPCR). qPCR was performed on a CFX96 real time PCR system (Bio Rad) with iTaq Universal SYBR Green super mix (Bio Rad). The cetyl trimethyl ammonium bromide (CTAB) method was used to extract the P. brassicae DNA [Citation52], and DNA was used as template for qPCR to quantify the P. brassicae DNA content in root galls. P. brassicae target actin gene was AY452179.1 and Arabidopsis actin gene was AT3G18780. The primers are listed in Table S3.
Generation of transgenic Arabidopsis plants
Full-length PbChia1 was cloned into pCNF3 at XbaI/BamHI restriction enzyme sites to generate pCNF3-PbChia1-FLAG, which was then transformed into Agrobacterium tumefaciens GV3101 by electroporation. A. tumefaciens was transformed to five- or six-week-old Arabidopsis Col-0 with the floral dip method [Citation53]. T0 generation seeds were grown in Murashige and Skoog (MS) media plates containing 50 mg/ml kanamycin. The surviving plants were transferred to grow in soil and identified by PCR and western blot to keep homozygous plants. T3 generation plants were used for subsequent study. Each flat grown 40 plants, monitored the survival rate of plants after inoculation with P. brassicae for 30 and 55 days. Survival rate=Number of plants survived/Total plants tested x100%. Experiment repeated 3 times.
Microscopic analysis
For trypan blue staining, roots were treated with 0.05% trypan blue solution overnight, and washed several times with plenty of water to remove excess dye [Citation54]. The root samples were observed under Nikon light microscopy (Nikon Eclipse 90i, Japan). For wheat germ agglutinin (WGA488) staining, 10 μg/ml WGA‐Alexa Fluor 488 (Invitrogen, Cat. No.: W11261) was added to the roots (infected by P. brassicae) or resting spores for 10 min before microscopy. A confocal microscope (Leica SP8) was used to detect the WGA‐Alexa Fluor 488 signal. For DAPI staining, the resting spores with nucleus were counted under UV excitation [Citation9]. Electron microscopy analysis was performed as described by Chen [Citation52]. For subcellular localization, the YFP fluorescence was expressed in tobacco leaves, and the epidermal cells were examined under a confocal laser scanning microscope (Leica SP8), with the excitation wavelength of 488 nm and emission wavelength between 490 nm and 560 nm.
ROS burst and MAPK assay
ROS burst and MAPK assay were performed according to previous descriptions [Citation55]. In brief, leaf discs of 4-week-old Arabidopsis plants were incubated with 100 nM flg22 or chitin in reaction solution containing luminol and horseradish peroxidase (Sigma, USA). The ROS production values were measured for a period of 30 min. Ten-day-old seedlings were treated with 100 nM flg22 or chitin for 5, 15, 30 and 45 min, respectively. MAPK activation was measured by western blotting with an α-pErk1/2 antibody (Cell Signaling, No. 9101, USA).
Statistical analysis
One-way ANOVA followed by Kruskal-Wallis test for multiple comparison and two-tailed Student’s t-test were conducted using Prism 8. All experiments were repeated independently for two or three times.
Results
Extraction and characterization of chitin from P. brassicae
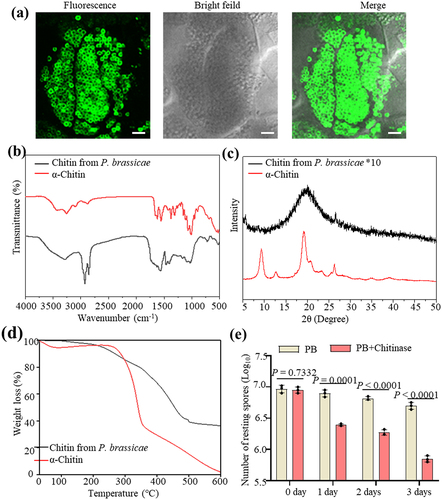
Chitin is present on the cell walls of the resting spores of P. brassicae. WGA488 staining revealed that in addition to resting spores, the primary plasmodia, zoosporagia and secondary plasmodia also contain chitin ( and Figure S1), indicating that chitin is abundant in different lifecycle stages of P. brassicae. Crudely extracted chitin was subjected to physicochemical evaluation with FTIR spectrum, XRD and TGA techniques. shows the FTIR spectrum of P. brassicae chitin and commercial chitin (α-chitin), which exhibited two bands at around 1662 cm − 1 and 1631 cm − 1, indicating the presence of amide I and amide II groups and that P. brassicae chitin is in an α-form [Citation56]. displays the visualized XRD spectra of P. brassicae chitin. There was a main diffraction peak of chitin at around 19.2°, and a small weak diffraction peak at around 26.3°, which was consistent with the crystal structure of chitin. However, unlike that of commercial α-chitin, the diffraction peak of chitin in the crude extract of P. brassicae was less pronounced, which may be related to the different sources of chitin. As shown by the TGA analysis in , the first and second weight loss for different chitin were very similar. However, in the third stage, there were some differences in the weight loss of chitin. The weight-loss rate of chitin from P. brassicae was very slow, and the reason was unclear. We next used chitinase (from Streptomyces griseus) to examine the chitin in P. brassicae. After treatment of the P. brassicae resting spores with chitinase for 3 d, the number of resting spores significantly decreased by 85.90% (). These results suggested that chitin is a functional component of P. brassicae.
Figure 1. Characteristics of chitin extracted from P. brassica. (a) Cross section of galls of rapeseed stained with WGA488 and the images were taken on confocal microscopy. Bar = 10 μm. (b-d) FTIR spectrum (b), XRD spectrum (c) and TGA thermograms (d) of chitin extract from P. brassicae. (e) Chitinase treatment on the resting spores of P. brassicae. Resting spores of P. brassicae were treated with commercial chitinase for 3 d at room temperature. The number of resting spores of P. brassicae was counted. Statistical analysis was performed by Student’s t-test (two-tailed). Data are mean ± s.D. n = 3 biological replicates. Experiments were repeated three times with similar results. α-chitin is commercial chitin and used as a control in b, c and d.
Identification and functional analysis of chitinase PbChia1 from P. brassicae genome ZJ-1
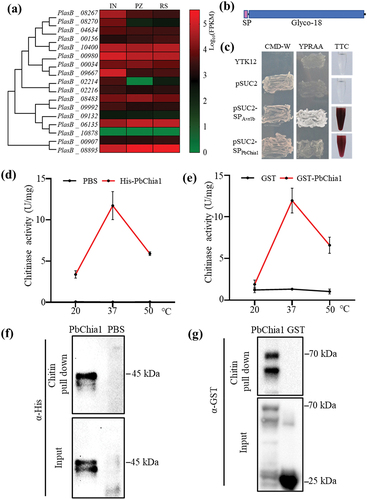
Blast2GO was used to systemically investigate chitinases in the genome of P. brassicae ZJ-1. As a result, 17 genes encoding putative chitinases were identified (Table S1). These chitinase genes were predicted to encode 275 to 1968 amino acids, with molecular weights ranging from 29.3 kDa to 209.5 kDa and pIs ranging from 4.66 to 8.89. P. brassicae chitinases were predicted to have subcellular localization in the mitochondria, cytoplasm or secretory. There were 16 chitinases belonging to the GH18 family, and one chitinase belonging to the GH19 family. Transcriptome analysis revealed that the 17 chitinase genes had different expression patterns (), suggesting that they may have functional differentiation. Phylogenetic tree analysis indicated that 13 chitinases were closely related to plant-derived chitinases and only two chitinases are closely associated with fungal-derived chitinases (Figure S2). The LC-MS/MS method was employed to screen functional chitinases from P. brassicae, and 15 chitinases were screened from clubroot galls of rapeseed (Table S2). Only one chitinase was derived from P. brassicae, whose gene number was PlasB_10400 and named as PbChia1 (Table S2). PbChia1 had no intron, with 1203 nucleotides encoding a peptide of 400 amino acids. The protein contained a signal peptide and typical GH18_chitinase domain (). Yeast invertase assay demonstrated that PbChia1 harbours a functional N-terminal signal peptide (). We next examined the subcellular localization of PbChia1-YFP fusion proteins with (PbChia1-YFP) or without signal peptide (PbChia1ΔSP-YFP) in plant cells. PbChia1-YFP and PbChia1ΔSP-YFP were transiently expressed in N. benthamiana. In epidermis cells expressing PbChia1-YFP, yellow fluorescence signal was observed in cytoplasm, plasma membrane and nucleus; while in epidermis cells expressing PbChia1ΔSP-YFP, yellow fluorescence signal was mainly concentrated in the nucleus (Figure S3a). Then, the apoplast washing fluid was extracted, and Western blotting indicated that PbChia1 but not PbChia1ΔSP was detected in the apoplast washing fluid (Figure S3b), suggesting that PbChia1 is a secreted protein. qPCR showed that PbChia1 had constitutive expression in different lifecycle stages, which is consistent with transcriptome data (Figure S3c and ). We next expressed PbChia1 protein in Escherichia coli and tested whether it has an chitinase activity. The full-length PbChia1 without the signal peptide was fused with His and GST, respectively. PbChia1-His and PbChia1-GST were purified, and then their chitinase activity was measured using colloidal chitin as the substrate. As a result, both PbChia1-His and PbChia1-GST showed chitin-binding ability (, e). Besides, they could effectively hydrolyse chitin into monomeric GlcNAc (, g), and both of them had the highest enzyme activity at 37 °C, which showed rapid decreases at 20 °C or 50 °C. These results indicated that PbChia1 is a functional chitinase.
Figure 2. PbChia1 is characterized as a chitinase. (a) Heatmap visualization of 17 predicted chitinase genes at different life stages of P. brassicae. A coloured bar indicates normalized reads per log10 (FPKM) in the expression profile at three life stages. IN indicates cortical infection; PZ stands for primary zoospores and RS indicates resting spores. Genes and samples were clustered according to their expression profiles. (b) Schematic illustration of PbChia1. (c) PbChia1 contains a functional signal peptide. By using a yeast signal-sequence trap system, yeast expressing the plasmid pSUC2-SPPbChia1 with the expression of PbChia1 signal peptide driven by the pSUC2 promoter could produce a red similar colour to that of the positive control. Yeast expressing the empty pSUC2 vector was used as a negative control, and yeast expressing pSUC2-SPAvr1b containing the signal peptide from the Phytophthora sojae effector Avr1b was the positive control. (d) and (e) Chitinase activity of PbChia1. PbChia1 was fused with the His tag fusion protein in pEt28a (d), or with the GST fusion protein in vector Pgex-6P1, GST alone served as a control (e). The chitinase enzyme activity of affinity-purified His-PbChia1, GST-PbChia1 and GST protein was analysed using chitin as substrate. The reaction of DNS (3,5-dinitrosalicylic acid) and GlcNAc was monitored at OD565 nm. One unit of chitinase activity was defined as the amount of enzyme required to release 1 mmol of N-acetyl-D-glucosamine per hour. Data are mean ± s.D. (f) and (g) Affinity-purified His-PbChia1 (f) and GST- PbChia1 (g) protein had the ability to bind chitin. Purified recombinant proteins were incubated with colloid chitin for 1 h under constant shaking, and the chitin-associated His-PbChia1 (f) and GST- PbChia1 (g) were detected using immunoblotting.
PbChia1 inhibits resting spore germination and reduces the pathogenicity of P. brassicae
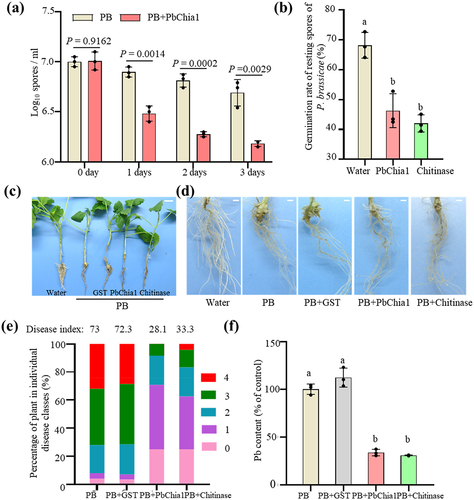
To examine the inhibitory effect of chitinase on resting spore germination, the resting spores of P. brassicae were incubated with purified PbChia1 protein for 3 d. As a result, the amount of resting spores significantly decreased (), and was reduced by 71.20% on the third day (). We further checked the germination rate of resting spores and nuclear status with DAPI staining at 3 d (Figure S4 and ). The germination rate of resting spores (without a nucleus) was 46.30% and 42.00% under PbChia1 and chitinase treatment, respectively, while that of the control group was 68.20%. The germination inhibition rate of PbChia1 was 32.10% (), indicating that the protein can significantly reduce the germination rate of resting spores in vitro. To explore the effect of PbChia1 protein on the development of clubroot, rapeseed plants were grown in liquid nutrient solution and co-inoculated with resting spores and the PbChia1 protein. The plants inoculated with resting spores only and together with GST protein showed galls on their roots, while those co-inoculated with resting spores and PbChia1 or chitinase protein had no obvious galls on the roots (). The disease index of plants inoculated with resting spores only and together with GST protein was 73 and 72.32, respectively (), while that of plants co-inoculated with resting spores and PbChia1 or chitinase protein was 28.1 and 33.3, respectively (). The biocontrol effect of PbChia1 was 61.29%, suggesting that the application of PbChia1 protein in vitro could alleviate the symptoms of clubroot. Observation of root slices and content of P. brassicae in root cells revealed that the PbChia1 protein could significantly reduce the pathogens inside the host (Figure S5). qPCR analysis demonstrated that the content of P. brassicae in the roots under PbChia1 protein treatment was lower than that under GST treatment (). Taken together, PbChia1 could decrease the concentration and germination rate of P. brassicae resting spores, reduce the content of pathogens, and relieve the clubroot symptom in vitro, indicating that chitin may play an important role in clubroot development.
Figure 3. Treatment of P. brassicae with purified PbChia1 protein. (a) Resting spores of P. brassicae were treated with 0.3 mg/mL PbChia1 protein for 3 d, and the number (a) and germination rate (b) were recorded. Resting spores stained with DAPI and the nucleus were observed under UV excitation. (c) and (d) Gall phenotype of rapeseed infected with P. brassicae for 30 d under different treatments. c shows the phenotype of the whole plants, bar = 1 cm. d shows the root phenotype, bar = 1 mm. (e) Phytopathological analysis of rapeseed inoculated with P. brassicae and PbChia1 protein. Percentages of plants in individual disease classes are shown. For each treatment, 24 to 28 rapeseed plants were analysed. (f) Pathogen DNA content was quantified by qPCR. Rapeseed actin gene was used as a reference gene to indicate the amount of plant, and P. brassicae actin gene was used as a reference gene to indicate the amount of pathogen. In a, b and f, One-way ANOVA with Kruskal-Wallis test. Data are mean ± s.D. n = 3 biological replicates. Different letters indicate significant differences (P < 0.05). All experiments in this figure were repeated three times with similar results.
Overexpression of PbChia1 in Arabidopsis increases its resistance to P. brassicae
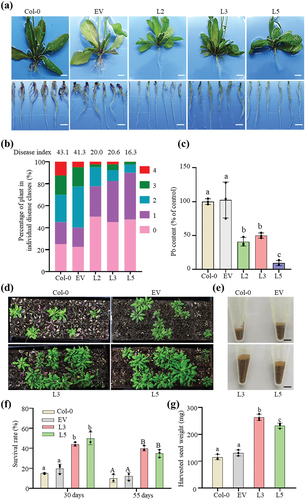
To characterize the biological functions of PbChia1, we generated stable transgenic Arabidopsis lines with constitutive expression of full-length PbChia1 under CaMV35S promoter. The three independent homozygous Arabidopsis lines (L2, L3 and L5) and Col-0 plants showed similar phenotypes in leaf morphology, root hair growth and seed yield (Figure S6). Next, we tested whether PbChia1 overexpression is accompanied by changes in susceptibility to P. brassicae. It was observed that club-shaped galls were formed on the roots of Col-0 and empty vector Arabidopsis plants infected by P. brassicae for 21 d, while no obvious symptom was observed for transgenic Arabidopsis lines (). In addition, PbChia1 transgenic plants had much lower disease index than Col-0 and empty vector plants (). qPCR confirmed that the infected roots of PbChia1 transgenic lines had a lower density of P. brassicae than Col-0 and empty vector plants (). Young plants may be killed by clubroot disease within a short time after infection. Hence, we examined the survival rate of the infected plants at 30 d and 55 d after P. brassicae inoculation. The average survival rate of transgenic plants was 3.13- and 3.96-fold that of Col-0 plants at 30 d and 55 d after inoculation, respectively (, e). Seeds of the surviving plants were harvested and weighed. The per plant seed weight of transgenic plants was about 2.15-fold that of Col-0 plants (, g). These results suggested that PbChia1 transgenic plants had strongly enhanced disease resistance to P. brassicae, which can relieve the severity of clubroot symptoms and promote the survival rate of infected plants and seed yield.
Figure 4. Effect of PbChia1 overexpression in Arabidopsis on its resistance to P. brassicae. (a) Phenotype of PbChia1 overexpression transgenic plants inoculated with P. brassicae for 21 d, scale bar = 1 cm. (b) Phytopathological analysis of Col-0 and transgenic plants. The percentages of plants in individual disease classes are shown. For each treatment, 40 Arabidopsis plants were analysed. (c) qPCR was used to examine the pathogen content in Col-0 and transgenic plants infected with P. brassicae. Statistical analysis was performed by one-way ANOVA with Tukey’s test (significance set at P ≤ 0.05). Different letters (a, b and c) indicate significant differences. n = 4 biological replicates; data are shown as mean ± s.D. (d) Phenotype of Col-0 and transgenic plants inoculated with P. brassicae for 30 d. Each flat was grown with 40 plants, and the seeds of surviving plants were harvested into a tube (e). (f) Survival rates of Col-0 and PbChia1 transgenic plants infected with P. brassicae for 30 d and 55 d. A total of 40 plants were analysed. (g) Weights of seeds from Col-0 and transgenic plants inoculated with P. brassicae. Statistical analysis was performed by one-way ANOVA with Tukey’s test (significance set at P ≤ 0.05). Different letters represent significant differences. n = 3 biological replicates; data are shown as mean ± s.D. All experiments in this figure were repeated three times with similar results.
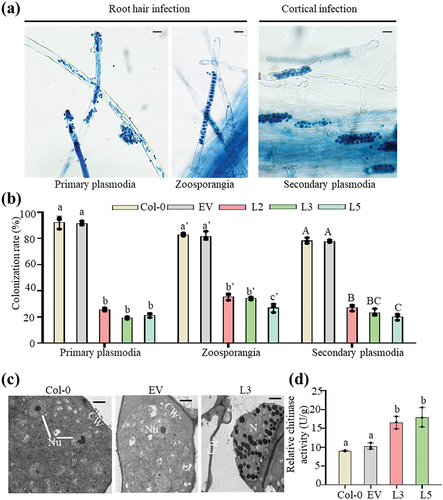
The life cycle of P. brassicae comprises three main stages: survival in soil as resting spores, root hair infection, and cortical infection [Citation8]. To validate the resistance of the transgenic lines to P. brassicae, we compared the root hair infection rate (form primary plasmodia and zoosporangia) and cortical infection rate (form secondary plasmodia) between Col-0, empty vector and transgenic PbChia1 plants (). The results showed that both root hair infection rate and cortical infection rate decreased significantly in PbChia1 transgenic plants relative to those in Col-0 plants (). We further observed the P. brassicae development state in the infected roots. The TEM results showed the presence of many early mature resting spores with typical nuclei and nucleoli in infected Col-0 and empty vector root cells (), while only secondary zoosporangia were observed on the infected roots of transgenic L3 plants (). These observations suggested that PbChia1 May inhibit the development of P. brassicae. In order to explore the disease resistance mechanism of transgenic PbChia1 plants, we measured the chitinase activity of Col-0 and PbChia1 transgenic plants. As a result, the chitinase activity of PbChia1 transgenic plants was 1.91-fold that of Col-0 plants) (). Besides, the PbChia1 transgenic lines with a relatively higher expression level of PbChia1 showed less severe symptoms (Figure S6). Therefore, it can be speculated that the stronger resistance of PbChia1 transgenic plants to P. brassicae may be derived from an increase in chitinase activity.
Figure 5. Overexpression of PbChia1 in Arabidopsis inhibits P. brassicae development. (a) the images show the key steps of P. brassicae infection in PbChia1 transgenic lines and control plants, including root hair and cortical infection stages. Primary plasmodia of root hair infection were observed in the roots stained with trypan blue for 3 d post inoculation. Zoosporangia of root hair infection and secondary plasmodia of cortical infection were observed in the roots stained with trypan blue for 12 d post inoculation. The pictures were taken under light microscopy. Scale bar = 10 µm. (b) Colonization rate (100%) of primary plasmodia, zoosporangia and secondary plasmodia per root in PbChia1 transgenic lines and control plants. The roots of more than 15 plants were selected and sliced into 1–2 cm segments. A total of approximately 100 root segments per sample were observed and counted to determine the presence of infection. Statistical analysis was performed by one-way ANOVA with Kruskal-Wallis test (significance set at P ≤ 0.05). Colonization rates indicated by different letters are significantly different. n = 3 biological replicates; data are shown as mean ± s.D. (c) Transgenic plants and control plants were inoculated with P. brassicae for 21 d, and the developmental status of P. brassicae was observed by transmission electron microscope. CW = plant cell wall; Nu = nucleus; N = nucleus without nucleolus; scale bar = 2 μm. (d) Determination of relative chitinase activity of 4 weeks PbChia1 transgenic lines and control plants. Statistical analysis was performed by one-way ANOVA with Kruskal-Wallis test (significance set at P ≤ 0.05). Different letters show significant differences, n = 3 biological replicates; data are shown as mean ± s.D.
PbChia1 alters certain host defence responses
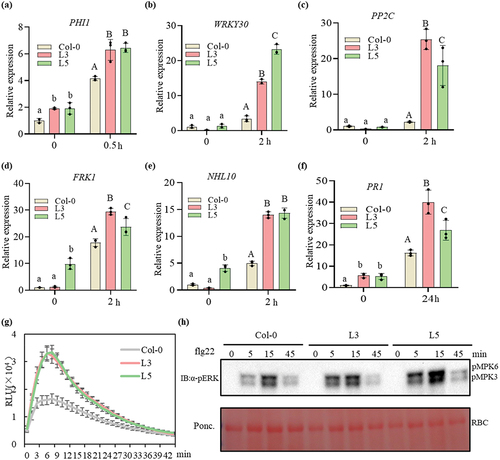
P. brassicae is an obligatory biotroph that requires the suppression of plant immune response for infection and complete life cycle. Flagellin 22 (flg22) or chitin is a well characterized PAMP and has been demonstrated to induce PTI in plants when administered [Citation57]. We assessed the transcript levels of many defence-related genes in PbChia1 transgenic lines. Early immune genes FRK1, WRKY30, PP2C, NHL10, PHI1 and the later immune gene PR1 were selected for detection. After flg22 treatment, all these genes were significantly up- regulated in PbChia1 transgenic lines compared with in Col-0 plants (). These results indicated that PbChia1 is likely to alter certain defence responses, and the expression of these defence genes changes the resistance to P. brassicae. We next attempted to determine whether PbChia1 activates or suppresses general defence responses. To this end, we activated the immune response using flg22 and monitored the accumulation of reactive oxygen species (ROS) and activation of mitogen-activated protein kinase cascades (MAPKs) in Col-0 and PbChia1 transgenic lines (). As a result, flg22 induced significant increases in ROS accumulation in PbChia1 transgenic lines compared with in Col-0 plants (). The phosphorylation level of MAPKs was also increased in PbChia1 transgenic lines (). Besides, we checked the chitin-triggered plant immunity. Similar to the results obtained under flg22 treatment, ROS accumulation, expression of immune-related genes and MAPK activation all increased in PbChia1 transgenic lines than those in Col-0 plants (Figure S7). All these results suggested that overexpression of PbChia1 in plants would enhance PAMP-triggered immunity.
Figure 6. Flg22-induced immune response in PbChai1 transgenic lines. (a-f) Immune response related genes were induced in PbChai1 transgenic lines. The 10-day-old seedlings grown in MS plates were treated with 100 nM flg22 for 0.5–2 h. Data were normalized to Arabidopsis actin gene (AT3G18780) expression in qPCR analysis. Statistical analysis in a to f was performed by one-way ANOVA with Kruskal-Wallis test (significance set at P ≤ 0.05). Different letters (a, b and c) indicate significant differences. n = 3 biological replicates; data are shown as mean ± s.D. All experiments were repeated three times with similar results. (g) Flg22-induced ROS burst in PbChai1 overexpression lines. The 10-day-old seedlings grown in MS plates were treated with 100 nM flg22 and the values represent means ± s.D (n = 24 biological replicates). (h) Activation of MAPK triggered by flg22. The 10-day-old seedlings grown in MS plates were treated with 100 nM flg22 for 0, 5, 15 and 45 min, respectively. Experiments were repeated twice with similar results.
PbChia1 resistance to different pathogens
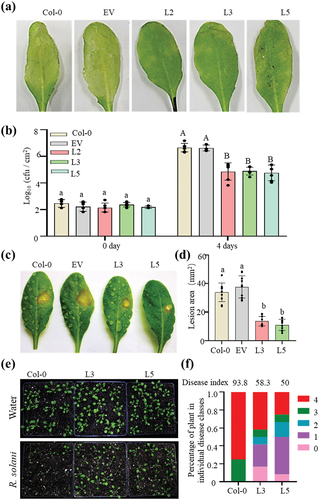
Since PbChia1 transgenic plants showed obvious resistance to the biotrophic pathogen P. brassicae, we further examined the disease resistance of PbChia1 transgenic plants to other pathogens, including the bacterial pathogen Pseudomonas syringae pv. tomato (Pst) DC3000, the necrotrophic pathogen Sclerotinia sclerotiorum 1980 and Rhizoctonia solani. The transgenic lines showed much less severe disease symptoms and proliferation of Pst DC3000 than Col-0 plants after Pst DC3000 infection (). The comparative analysis of B. cinerea symptoms revealed that smaller lesion was formed on PbChia1 transgenic plants than on Col-0 plants (). The disease index of Col-0 inoculated with R. solani was 93.75, while that of L3 and L5 transgenic plants was 58.33 and 50.00, respectively (), indicating that Arabidopsis PbChia1 transgenic plants had enhanced disease resistance to R. solani. These results suggest that PbChia1 alters host defence pathways and enhances plant immunity, and has a broad application prospect.
Figure 7. PbChia1 transgenic lines have higher disease resistance to Pst DC3000, S. sclerotiorum and R. solani. (a) Phenotypes of PbChia1 transgenic lines and control plants inoculated with Pst DC3000 at 1 × 10⁶ cfu ml − 1 for 4 d. (b) Bacterial populations in PbChia1 transgenic lines and control plants on day 0 and day 5 after leaf infiltration with 1 × 10⁶ cfu ml − 1. Statistical analysis was performed by one-way ANOVA with Tukey’s test (significance set at P ≤ 0.05). Bacterial populations indicated by different letters are significantly different. n = 4 biological replicates. Data are shown as mean ± s.D. (c) Phenotypes of PbChia1 transgenic lines and control plants inoculated with S. sclerotiorum 1980 for 30 h. (d) Statistics of lesion area in PbChia1 transgenic lines inoculated with S. sclerotiorum 1980 for 30 h. n = 10 biological replicates. Data are shown as mean ± s.D. One-way ANOVA with Tukey’s test was used to analyse the differences. The same letters indicate no significant difference, P ≤ 0.05. (e) Phenotypes of PbChia1 transgenic lines and control plants inoculated with R. solani for 3 d. (f) Disease index statistics of PbChia1 transgenic lines and control plants inoculated with R. solani for 3 d, n = 12 biological replicates. Data are shown as mean ± s.D. One-way ANOVA with Kruskal-Wallis test was used to analyse the differences. The same letters show no significant difference, P ≤ 0.05.
Discussion
PbChia1 is a potential candidate gene for breeding against clubroot
Rapeseed is a major crop providing abundant amounts of oil to humans. Clubroot caused by the soil-borne obligate biotrophic protist P. brassicae is one of the major diseases of cruciferous crops and vegetables worldwide. The resting spores of P. brassicae can survive for more than 17 years in an infected field without any host [Citation58]. There is currently no effective method to completely remove P. brassicae from an infected field, and the most effective control method may be the planting of resistant cultivars. Genomic and multi-omics research may be a powerful tool to identify major loci and resistance genes for clubroot resistance breeding [Citation59]. However, the population of P. brassicae in the field generally exhibits great diversity [Citation60,Citation61]. For example, Strelkov et al. reported 17 pathotypes from the canola fields of Canada [Citation62]. Besides, some clubroot-resistant germplasms are pathotype-specific [Citation63], and the population structure of P. brassicae may change quickly in the infected field [Citation59]. Repeated cultivation of the same cultivar in a field can result in resistance due to the rapid multiplication of rare pathotypes, frequent changes in pathogen population structure, and emergence of new virulent pathogens [Citation61,Citation64,Citation65]. Therefore, it is important to select genes with broad-spectrum resistance to P. brassicae pathotypes for the development of clubroot resistant cultivars. Chitinases, which are considered as PR proteins [Citation66], can catalyse the hydrolysis of chitin, inhibit pathogen growth and enhance plant immunity against fungi [Citation34,Citation47]. The cell walls of P. brassicae resting spore have been reported to contain chitin [Citation18]. Here, chitin could be detected in the whole life cycle of P. brassicae through WGA488 staining ( and Figure S1), crudely extracted chitin from P. brassicae resting spores was detected by FTIR, XRD and TGA, and showed similar characteristics to α-chitin (, c, d). But TGA analysis is a bit different between chitin of P. brassicae and α-chitin from bacteria, it could be speculated that the two sources of chitin may be different, or that the chitin of P. brassicae was a crude extract containing some impurities that could not be decomposed. Genome-wide analysis screened a total of 17 chitinases in the genome of P. brassicae ZJ-1 (Table S1, and Figure S2). LC-MS/MS screened one chitinase named as PbChia1 was derived from P. brassicae (Table S2). PbChia1 was found to be a secreted chitinase and expressed in all developmental stages of P. brassicae ( and Figure S3). Purified PbChia1 protein from E. coli inhibited the development of clubroot (). Overexpression of PbChia1 in Arabidopsis resulted in significantly improved resistance to P. brassicae (). Similar results were also reported for the antifungal activity of chitinase in enhancing resistance against other fungal and bacterial pathogens [Citation47,Citation67–69]. We also observed that higher expression of PbChia1 resulted in stronger resistance to P. brassicae and chitinases were not toxic to plant hosts (Figure S6 and S7). These results suggest that PbChia1 May be a potential gene for clubroot resistance breeding.
Regulation of chitinase PbChai1 on resistance to P. brassicae
PbChia1 transgenic plants showed significantly improved resistance to Pst DC3000, S. sclerotiorum and R. solani (), indicating that PbChia1 transgenic plants acquired a broad spectrum of disease resistance. In order to further explore the disease resistance mechanism of PbChia1 transgenic plants, the plants were treated with PAMPs, namely flg22 and chitin, to induce the innate immune response of plants. PbChia1 transgenic plants showed increases in ROS burst, MAPK activation and expression levels of marker genes related to immunity ( and Figure S8). These results suggested that PbChia1 overexpression could increase the accumulation of ROS and trigger disease defence-related mechanisms in plants, which is consistent with the findings in a study of chitinase expression in soybean [Citation69]. Chitinases play a dual role, digesting the cell wall to inhibit fungal growth and inducing host defence reaction by releasing pathogen-borne elicitors [Citation67]. In protist P. brassicae, chitin is a functional component, and its degradation may be of physiological importance for the normal growth and development of P. brassicae. However, it is not yet possible to knock out PbChia1 to verify its function due to its parasitic nature. We hypothesize that PbChia1 digests chitin to soluble N-acetyl glucosamine oligosaccharides, which can be utilized as a carbon source, and decomposition of chitin or N-acetyl glucosamine oligosaccharides will trigger other defence-related mechanisms [Citation19,Citation21], which can explain why PbChia1 transgenic plants showed enhanced resistance to P. brassicae, Pst DC3000, S. sclerotiorum and R. solani. It remains unclear whether these defence-related mechanisms are activated directly or indirectly. We used LC-MS/MS screen 14 chitinases from host and one chitinase from P. brassicae, which suggested that plant chitinases maybe have same function with microbial chitinases, plant chitinases are part of pathogenesis-related proteins, microbial chitinases PbChia1 expressed in plants like pathogenesis-related proteins involved in plant disease resistance.
Suppression of P. brassicae on chitin-triggered immunity
P. brassicae can suppress plant immunity (PTI and ETI) of susceptible hosts to form galls. Chitinase randomly cleaves chitin and generates different chitin oligosaccharides, which are recognized by cell surface LysM receptors to activate PTI [Citation70,Citation71]. To elude the chitin-triggered immunity in the infection, fungal pathogens have developed several strategies. M. oryzae secretes effector protein interacting with chitin, which suppresses the activation of PTI for rice blast disease [Citation72]. The effector protein Ecp6 in Cladosporium fulvum can sequester fungal chitin oligomers to avoid chitin-triggered immunity in the host plant [Citation73]. The evasion of chitin-binding effectors from chitin-triggered immunity can either capture free chitin oligosaccharides or protect pathogens from the digestion by plant chitinases [Citation74]. A recent study reported that two effectors PbChiB2 and PbChiB4, which belong to the CBM18 proteins of P. brassicae, suppress chitin-triggered immunity during clubroot development [Citation24]. The soil-borne fungus Verticillium dahlia can utilize an enzymatically active polysaccharide deacetylase to effectively cleave chitin oligomers into chitosan, suppressing chitin-triggered immune response during pathogen infection [75]. We are planning to study the effector functions to elucidate how P. brassicae overcomes the host immunity to successfully colonize the root by avoiding the activation of PTI or direct suppression of PTI.
Supplemental Material
Download Zip (1.9 MB)Acknowledgements
This research was financially supported by the National Natural Science Foundation of China (32172371), and the Fundamental Research Funds for the Central Universities (2662020ZKPY003). Collaborative Fund of Huazhong Agricultural University and Agricultural Genomics Institute at Shenzhen (SZYJY2021007), and the earmarked fund of China Agriculture Research System (CARS-13).
Disclosure statement
No potential conflict of interest was reported by the authors.
Data Availability statement
The datasets are available from the corresponding author on reasonable request.
Supplemental data
Supplemental data for this article can be accessed online at https://doi.org/10.1080/21505594.2023.2233147
Additional information
Funding
References
- Dixon, GR. The occurrence and economic impact of Plasmodiophora Brassicae and clubroot disease. J. Plant Growth Regul. 2009;28(3):194–202.
- Burki F, Kudryavtsev A, Matz MV, et al. Evolution of Rhizaria: new insights from phylogenomic analysis of uncultivated protists. BMC Evol Biol. 2010;10(1):377. doi: 10.1186/1471-2148-10-377
- Hwang SF, Strelkov SE, Feng J, et al. Plasmodiophora brassicae: a review of an emerging pathogen of the Canadian canola (Brassica napus) crop. Mol Plant Pathol. 2012;13(2):105–18. doi: 10.1111/j.1364-3703.2011.00729.x
- Kamoun S. Molecular genetics of pathogenic oomycetes. Eukaryotic Cell. 2003;2:191–199. doi: 10.1128/EC.2.2.191-199.2003
- Michielse CB, Hooykaas PJ, van den Hondel CA, et al. Agrobacterium-mediated transformation as a tool for functional genomics in fungi. Curr Genet. 2005;48:1–17. doi: 10.1007/s00294-005-0578-0
- Nakayashiki H, Hanada S, Quoc NB, et al. RNA silencing as a tool for exploring gene function in ascomycete fungi. Fungal Genet Biol. 2005;42(4):275–283. doi: 10.1016/j.fgb.2005.01.002
- Rolfe SA, Strelkov SE, Links MG, et al. The compact genome of the plant pathogen Plasmodiophora brassicae is adapted to intracellular interactions with host Brassica spp. BMC Genomics. 2016;17(1):272. doi: 10.1186/s12864-016-2597-2
- Schwelm A, Fogelqvist J, Knaust A, et al. The Plasmodiophora brassicae genome reveals insights in its life cycle and ancestry of chitin synthases. Sci Rep. 2015;5(1):11153. doi: 10.1038/srep11153
- Chen T, Bi K, Zhao Y, et al. MAPKK inhibitor U0126 inhibits Plasmodiophora brassicae development. Phytopathology. 2018;108:711–720. doi: 10.1094/PHYTO-07-17-0240-R
- Schwelm A, Dixelius C, Ludwig-Müller J. New kid on the block – the clubroot pathogen genome moves the plasmodiophorids into the genomic era. Eur J Plant Pathol. 2016;145(3):531–542. doi: 10.1007/s10658-015-0839-9
- Singh K, Tzelepis G, Zouhar M, et al. The immunophilin repertoire of Plasmodiophora brassicae and functional analysis of PbCYP3 cyclophilin. Mol Genet Genomics. 2018;293(2):381–390. doi: 10.1007/s00438-017-1395-0
- Bulman S, Richter F, Marschollek S, et al. Arabidopsis thaliana expressing PbBSMT, a gene encoding a SABATH-type methyltransferase from the plant pathogenic protist Plasmodiophora brassicae, show leaf chlorosis and altered host susceptibility. Plant Biol. 2019;21(S1):120–130. doi: 10.1111/plb.12728
- Djavaheri M, Ma L, Klessig DF, et al. Mimicking the host regulation of salicylic acid: a virulence strategy by the clubroot pathogen Plasmodiophora brassicae. Mol Genet Genomics. 2019;32(3):296–305. doi: 10.1094/MPMI-07-18-0192-R
- Pérez-López E, Hossain MM, Tu J, et al. Transcriptome analysis identifies Plasmodiophora brassicae secondary infection effector candidates. J Eukaryot Microbiol. 2020;67:337–351. doi: 10.1111/jeu.12784
- Pérez-López E, Hossain MM, Wei Y, et al. A clubroot pathogen effector targets cruciferous cysteine proteases to suppress plant immunity. Virulence. 2021;12(1):2327–2340. doi: 10.1080/21505594.2021.1968684
- Chen W, Li Y, Yan R, et al. SnRK1.1-mediated resistance of Arabidopsis thaliana to clubroot disease is inhibited by the novel Plasmodiophora brassicae effector PBZF1. Mol Plant Pathol. 2021;22(9):1057–1069. doi: 10.1111/mpp.13095
- Merzendorfer H. The cellular basis of chitin synthesis in fungi and insects: common principles and differences. Eur J Cell Biol. 2011;90(9):759–769. doi: 10.1016/j.ejcb.2011.04.014
- Moxham SE, Buczacki ST. Chemical composition of the resting spore wall of Plasmodiophora brassicae. Trans Br Mycol Soc. 1983;80(2):297–304. doi: 10.1016/S0007-1536(83)80013-8
- Kombrink A, Sánchez-Vallet A, Thomma BPHJ. The role of chitin detection in plant–pathogen interactions. Microbes Infect. 2011;13:1168–1176. doi: 10.1016/j.micinf.2011.07.010
- Pentecost JWG. Potential application of chitin signaling in engineering broad-spectrum disease resistance to fungal and bacterial pathogens in plants. Adv Crop Sci Tech. 2013;1:e103.
- Kishimoto K, Kouzai Y, Kaku H, et al. Perception of the chitin oligosaccharides contributes to disease resistance to blast fungus Magnaporthe oryzae in rice. Plant J. 2010;64(2):343–354. doi: 10.1111/j.1365-313X.2010.04328.x
- Wan J, Tanaka K, Zhang XC, et al. Lyk4, a lysin motif receptor-like kinase, is important for chitin signaling and plant innate immunity in Arabidopsis. Plant Physiol. 2012;160(1):396–406. doi: 10.1104/pp.112.201699
- Jin RD, Han T, Kim Y, et al. Suppression of clubroot formation in Chinese cabbage by the chitin compost and broth. J Biol Chem. 2006;49:171–175.
- Muirhead K, Pérez-López E. Plasmodiophora brassicae CBM18 proteins bind chitin and suppress chitin-triggered immunity. PhytoFrontiers. 2022;2:21–29. doi: 10.1094/PHYTOFR-04-21-0032-R
- Bravo JM, Campo S, Murillo I, et al. Fungus- and wound-induced accumulation of mRNA containing a class II chitinase of the pathogenesis-related protein 4 (PR-4) family of maize. Plant Mol Biol. 2003;52(4):745–759. doi: 10.1023/A:1025016416951
- Wang LY, Wang YS, Zhang JP, et al. Molecular cloning of class III chitinase gene from Avicennia marina and its expression analysis in response to cadmium and lead stress. Ecotoxicology. 2015;24(7–8):1697–1704. doi: 10.1007/s10646-015-1501-1
- Li P, Zhang Y, Wu X, et al. Drought stress impact on leaf proteome variations of faba bean (vicia faba L.) in the Qinghai-Tibet Plateau of China. Biotech. 2018;8:110. doi: 10.1007/s13205-018-1088-3
- Roby D, Toppan A, Esquerré-Tugayé MT. Systemic induction of chitinase activity and resistance in melon plants upon fungal infection or elicitor treatment. Physiol Mol Plant P. 1988;33:409–417. doi: 10.1016/0885-5765(88)90007-0
- Ntui VO, Azadi P, Thirukkumaran G, et al. Increased resistance to fusarium wilt in transgenic tobacco lines co-expressing chitinase and wasabi defensin genes. Plant Pathol. 2011;60(2):221–231. doi: 10.1111/j.1365-3059.2010.02352.x
- Jabeen N, Chaudhary Z, Gulfraz M, et al. Expression of rice chitinase gene in genetically engineered tomato confers enhanced resistance to fusarium wilt and early blight. Plant Pathol. 2015;31(3):252–258. doi: 10.5423/PPJ.OA.03.2015.0026
- Nookaraju A, Agrawal DC. Enhanced tolerance of transgenic grapevines expressing chitinase and β-1,3-glucanase genes to downy mildew. Plant Cell Tissue Organ Cult. 2012;111(1):15–28. doi: 10.1007/s11240-012-0166-1
- Marchant R, Davey MR, Lucas JA, et al. Expression of a chitinase transgene in rose (Rosa hybrida L.) reduces development of blackspot disease (Diplocarpon rosae Wolf). Mol Breed. 1998;4:187–194. doi: 10.1023/A:1009642707505
- Chen J, Piao Y, Liu Y, et al. Genome-wide identification and expression analysis of chitinase gene family in Brassica rapa reveals its role in clubroot resistance. Plant Sci. 2018;270:257–267. doi: 10.1016/j.plantsci.2018.02.017
- Abeles FB, Bosshart RP, Forrence LE, et al. Preparation and purification of glucanase and chitinase from bean leaves. Plant Physiol. 1971;47(1):129–134. doi: 10.1104/pp.47.1.129
- Staehelin C, Granado J, Müller J, et al. Perception of Rhizobium nodulation factors by tomato cells and inactivation by root chitinases. P Natl Acad Sci USA. 1994;91(6):2196–2200. doi: 10.1073/pnas.91.6.2196
- Khan A, Nasir IA, Tabassum B, et al. Expression studies of chitinase gene in transgenic potato against Alternaria solani. Plant Cell Tissue Organ Cult. 2017;128(3):563–576. doi: 10.1007/s11240-016-1134-y
- Zhao X, Situ G, He K, et al. Functional analysis of eight chitinase genes in rice stem borer and their potential application in pest control. Insect Mol Biol. 2018;27:835–846. doi: 10.1111/imb.12525
- Fan XJ, Mi YX, Ren H, et al. Cloning and functional expression of a chitinase cDNA from the apple leaf miner moth Lithocolletis ringoniella. Biochem Moscow. 2015;80(2):242–250. doi: 10.1134/S000629791502011X
- Asano T, Kageyama K, Hyakumachi M. Surface disinfestation of resting spores of Plasmodiophora brassicae used to infect hairy roots of Brassica spp. Phytopathology. 1999;89:314–319. doi: 10.1094/PHYTO.1999.89.4.314
- Siemens J, Nagel M, Ludwig-Muller J, et al. The interaction of Plasmodiophora brassicae and Arabidopsis thaliana: parameters for disease quantification and screening of mutant lines. J Phytopathol. 2002;150(11–12):592–605. doi: 10.1046/j.1439-0434.2002.00818.x
- Zhao Y, Chen X, Cheng J, et al. Application of Trichoderma Hz36 and Hk37 as biocontrol agents against clubroot caused by Plasmodiophora brassicae. J Fungi. 2022;28:777. doi: 10.3390/jof8080777
- Yang C, Yu Y, Huang J, et al. Binding of the Magnaporthe oryzae Chitinase MoChia1 by a Rice Tetratricopeptide Repeat Protein Allows Free Chitin to Trigger Immune Responses. Plant Cell. 2019;31(1):172–128. doi: 10.1105/tpc.18.00382
- Dhanabalan V, Xavier KAM, Eppen S, et al. Characterization of chitin extracted from enzymatically deproteinized Acetes shell residue with varying degree of hydrolysis. Carbohydr Polym. 2021;253:117203. doi: 10.1016/j.carbpol.2020.117203
- Bi K, He Z, Gao Z, et al. Integrated omics study of lipid droplets from Plasmodiophora brassicae. Sci Rep. 2016;6(1):36965. doi: 10.1038/srep36965
- Saitou N, Nei M. The neighbor-joining method: a new method for reconstructing phylogenetic trees. Mol Biol Evol. 1987;4(4):406. doi: 10.1093/oxfordjournals.molbev.a040454
- Sandhya C, Adapa LK, Nampoothiri KM, et al. Extracellular chitinase production by Trichoderma harzianum in submerged fermentation. J Basic Microbiol. 2004;44(1):49–58. doi: 10.1002/jobm.200310284
- Zhang FL, Ruan XL, Wang X, et al. Overexpression of a chitinase gene from Trichoderma asperellum increases disease resistance in transgenic soybean. Appl Biochem Biotechnol. 2016;180(8):1542–1558. doi: 10.1007/s12010-016-2186-5
- Liu B, Li JF, Ao Y, et al. Lysin motif-containing proteins LYP4 and LYP6 play dual roles in peptidoglycan and chitin perception in rice innate immunity. Plant Cell. 2012;24:3406–3419. doi: 10.1105/tpc.112.102475
- Jacobs KA, Collins-Racie LA, Colbert M, et al. A genetic selection for isolating cDnas encoding secreted proteins. Gene. 1997;198(1–2):289–296. doi: 10.1016/S0378-1119(97)00330-2
- Gietz RD, Schiestl RH. High-efficiency yeast transformation using the LiAc/SS carrier DNA/PEG method. Nat Protoc. 2007;2(1):31–34. doi: 10.1038/nprot.2007.13
- Lyda TA, Joshi MB, Andersen JF, et al. A unique, highly conserved secretory invertase is differentially expressed by promastigote developmental forms of all species of the human pathogen, Leishmania. Mol Cell Biochem. 2015;404(1–2):53–77. doi: 10.1007/s11010-015-2366-6
- Chen T, Bi K, He Z, et al. Arabidopsis mutant bik1 exhibits strong resistance to Plasmodiophora brassicae. Front Physiol. 2016;7:402. doi: 10.3389/fphys.2016.00402
- Clough SJ, Bent AF. Floral dip: a simplified method for Agrobacterium-mediated transformation of Arabidopsis thaliana. Plant J. 1998;16(6):735–743. doi: 10.1046/j.1365-313x.1998.00343.x
- Liesche J, Marek M, Günther-Pomorski T. Cell wall staining with Trypan blue enables quantitative analysis of morphological changes in yeast cells. Front Microbiol. 2015;6:107. doi: 10.3389/fmicb.2015.00107
- Qi P, Huang M, Hu X, et al. A Ralstonia solanacearum effector targets TGA transcription factors to subvert salicylic acid signaling. Plant Cell. 2022;34(5):1666–1683. doi: 10.1093/plcell/koac015
- Jang MK, Kong BG, Jeong YI, et al. Physicochemical characterization of α-chitin, β-chitin, and γ-chitin separated from natural resources. J Polym Sci. 2004;42:3423–3432. doi: 10.1002/pola.20176
- Sun Y, Li L, Macho AP, et al. Structural basis for flg22-induced activation of the Arabidopsis FLS2-BAK1 immune complex. Science. 2013;342(6158):624–628. doi: 10.1126/science.1243825
- Wallenhammar AC. Prevalence of Plasmodiophora brassicae in a spring oilseed rape growing area in central Sweden and factors influencing soil infestation levels. Plant Pathol. 1996;45(4):710–719. doi: 10.1046/j.1365-3059.1996.d01-173.x
- Hasan J, Megha S, Rahman H. Clubroot in Brassica: recent advances in genomics, breeding, and disease management. Genome. 2021;64(8):735–760. doi: 10.1139/gen-2020-0089
- Holtz MD, Hwang SF, Strelkov SE. Genotyping of Plasmodiophora brassicae reveals the presence of distinct populations. BMC Genomics. 2018;19(1):254. doi: 10.1186/s12864-018-4658-1
- Sedaghatkish A, Gossen BD, Yu F, et al. Whole-genome DNA similarity and population structure of Plasmodiophora brassicae strains from Canada. BMC Genomics. 2019;20(1):744. doi: 10.1186/s12864-019-6118-y
- Strelkov SE, Hwang SF, Manolii VP, et al. Virulence and pathotype classification of Plasmodiophora brassicae populations collected from clubroot resistant canola (Brassica napus) in Canada. Can J Plant Pathol. 2018;40:284–298. doi: 10.1080/07060661.2018.1459851
- Hirani AH, Gao F, Liu J, et al. Combinations of independent dominant loci conferring clubroot resistance in all four turnip accessions (Brassica rapa) from the European clubroot differential set. Front Plant Sci. 2018;9:1628. doi: 10.3389/fpls.2018.01628
- Strelkov SE, Hwang SF, Manolii VP, et al. Emergence of new virulence phenotypes of Plasmodiophora brassicae on canola (Brassica napus) in Alberta, Canada. Eur J Plant Pathol. 2016;145(3):517–529. doi: 10.1007/s10658-016-0888-8
- Cao T, Manolii VP, Zhou Q, et al. Effect of canola (Brassica napus) cultivar rotation on Plasmodiophora brassicae pathotype composition. Can J Plant Sci. 2020;100(2):218–225. doi: 10.1139/cjps-2019-0126
- Legrand M, Kauffmann S, Geoffroy P, et al. Biological function of pathogenesis-related proteins: Four tobacco pathogenesis-related proteins are chitinases. PNAS. 1987;84(19):6750–6754. doi: 10.1073/pnas.84.19.6750
- Dana M, Pintor-Toro T, Cubero B. Transgenic tobacco plants overexpressing chitinases of fungal origin show enhanced resistance to biotic and abiotic stress agents. Plant Physiol. 2006;142:722–730. doi: 10.1104/pp.106.086140
- Cletus J, Balasubramanian V, Vashisht D, et al. Transgenic expression of plant chitinases to enhance disease resistance. Biotechnol Lett. 2013;35(11):1719–1732. doi: 10.1007/s10529-013-1269-4
- Yang X, Yang J, Li H, et al. Overexpression of the chitinase gene CmCH1 from Coniothyrium minitans renders enhanced resistance to Sclerotinia sclerotiorum in soybean. Transgenic Res. 2020;29(2):187–198. doi: 10.1007/s11248-020-00190-2
- Cao Y, Liang Y, Tanaka K, et al. The kinase LYK5 is a major chitin receptor in Arabidopsis and forms a chitin-induced complex with related kinase CERK1. Elife. 2014;3:e03766. doi: 10.7554/eLife.03766
- Sánchez-Vallet A, Mesters JR, Thomma BPHJ. The battle for chitin recognition in plant-microbe interactions. FEMS Microbiol Rev. 2015;39:171–183. doi: 10.1093/femsre/fuu003
- Mentlak TA, Kombrink A, Shinya T, et al. Effector-mediated suppression of chitin-triggered immunity by magnaporthe oryzae is necessary for rice blast disease. Plant Cell. 2012;24(1):322–335. doi: 10.1105/tpc.111.092957
- de Jonge R, Peter van Esse, van Esse HP A, et al. Conserved fungal LysM effector Ecp6 prevents chitin-triggered immunity in plants. Science. 2010;329:953–955. doi: 10.1126/science.1190859
- Marshall R, Kombrink A, Motteram J, et al. Analysis of two in planta expressed LysM effector homologs from the fungus Mycosphaerella graminicola reveals novel functional properties and varying contributions to virulence on wheat. Plant Physiol. 2011;156:756–769. doi: 10.1104/pp.111.176347