Abstract
While deforestation continues to be a threat to species diversity in the tropics, reforestation either by natural succession or human tree planting is also occurring. Very little is known about how bird communities respond to human-mediated reforestation schemes in tropical areas. We surveyed bird communities in Central Panama to compare their abundance and richness in mature forest, young natural succession (fallow pastures), active cattle pastures, and native species reforestation areas. We found the greatest abundance of birds in mature forest, while natural succession areas had slightly greater species richness relative to mature forest. Bird communities were most similar in forest and natural succession areas, and were distinct from bird communities in cattle pastures and reforestation areas. Migratory bird species were most abundant in the young natural succession areas. Reforestation areas that were closer to mature forest had a greater abundance of birds relative to areas further from forests. Our study provides a baseline for future studies at this site that will allow assessment of the speed at which reforestation efforts with tree plantations will support a more diverse and abundant bird community. Moreover, our finding of the greatest species richness and migratory bird abundance in a natural succession habitat supports previous bird community studies in agroforestry and successional habitats.
Introduction
Many species are suffering declines in their population numbers, with habitat loss due to land-use change cited as the major cause (Millenium Ecosystem Assessement Citation2005). Since >90% of the land area in tropical areas occurs outside the boundaries of forest reserves, planning for conservation will require a better understanding of the value of human-modified landscapes for supporting biological diversity (Chazdon et al. Citation2009). Birds are often used to assess or predict the effects of land-use change (Hughes et al. Citation2002; Petit & Petit Citation2003; Harvey et al. Citation2006), because they are easy to observe and provide important ecosystem services (Sekercioglu Citation2006; Whelan et al. Citation2008). Moreover, many birds have diverse and specialized requirements for food, which makes them good indicators for habitat change. A variety of types of agricultural development have reduced forest cover and thereby decreased the abundance and diversity of bird species relative to forest habitats in the Neotropics (Petit et al. Citation1999; Estrada & Coates-Estrada Citation2005; Faria et al. Citation2006; Harvey et al. Citation2006; Scales et al. Citation2008; Milder et al. Citation2010) as well as the Paleotropics (Waltert et al. Citation2004, Citation2005; Marsden & Symes Citation2008; Scales et al. Citation2008).
Like other countries in Central America, Panama has increasingly become fragmented due to forest clearing for cattle pastures and subsistence agriculture (Kaimowitz Citation1996). The result of forest clearing or human modification is a simplification of bird communities and a shift toward communities comprising of open woodland, grassland, and scrub species (Petit et al. Citation1999; Petit & Petit Citation2003). At the same time that deforestation is occurring, other parts of Panama are being reforested either by natural succession or by establishment of tree plantations (Wright & Muller-Landau Citation2006; Wright & Samaniego 2008; Hall et al. Citation2011; van Breugel et al. Citation2011). Very little is known about how bird communities are responding to various types of reforestation schemes in Panama, although recent work in Costa Rica has shown that some migratory birds preferred plantation-style reforestation treatments (Lindell et al. Citation2011) and that overall bird community composition and species richness was similar in actively and passively restored patches (Reid et al. Citation2012).
In Central Panama, many forests have been protected along the banks of the Panama Canal (Ibáñez et al. Citation2002). Despite this, approximately half of the canal’s watershed is deforested, and reforestation of the watershed is the official policy (Law 21) of Panama Canal Authority (ACP). Since 2009, the Agua Salud Project (ASP), an ecosystem services project in the Panama Canal Watershed, has begun to investigate the effects of different types of reforestation efforts and land uses on hydrology, carbon storage, and species conservation (Stallard et al. Citation2010). Due to the large quantities of data being collected on the environment and the 25–40-year project horizon, the ASP offers a unique opportunity to monitor changes in bird communities among different landscape types in Central Panama.
Here, we present data from bird surveys conducted between 2010 and 2011 within the treatment sites of the ASP. We surveyed bird communities in mature forest, natural succession areas, cattle pastures, and a newly installed reforestation site. Our overall hypothesis is that human plantation efforts can eventually mimic natural succession for providing bird habitat. We predict that (1) bird communities in newly planted reforestation areas will most resemble bird communities in cattle pastures, and (2) when a canopy forms in the reforestation area, the bird communities in reforestation areas will resemble those of natural succession areas. This paper provides data to test the first prediction. Our specific goals in surveying the bird communities were to estimate and compare the abundance, species richness, and species composition of birds using the four habitat types at the baseline, when reforestation sites were first planted. We also wanted to assess whether distance from the forest edge affected bird abundances within the newly planted reforestation site.
Methods
Study sites
We received permission for our observational field study from the Panama’s National Authority for the Environment (ANAM) and the Panama Canal Authority (ACP). The principle study site of the ASP borders Soberania National Park in Central Panama (9°13′ N, 79°47′W). Following is a description of each habitat type where we conducted bird surveys in 2010–11. Our survey areas could not be placed randomly in the landscape due to the constraint that we had permission to work only in and alongside ASP-owned areas. Further floristic details about these sites and representative photographs and maps are at http://www.ctfs.si.edu/aguasalud/page/catchments/#forest.
Mature forest
Two transects were established in forested areas of Soberania National Park (22,000 ha total). One transect was accessed from Pipeline Road near the Limbo River, in an area where previous studies have described the avifauna (Robinson et al. Citation2000). A second transect was accessed from the ASP. Neither site included large streams or rivers within 30 m of our bird count points. The forest in Soberania is a mix of mature second growth and old growth forest, both of which were represented in our transects (one each). Canopy cover was approximately 96% in our mature forest transect areas, with canopy heights ranging from 23 to 28 m (see vegetation survey methods below).
Natural succession
Two transects were in natural succession within the principle ASP area. These sites were abandoned pasture (approximately, 5–6 years previously) and reforestation was occurring via natural regeneration. Another term for this type of habitat is rastrojo. The area contained trees that were about 4 m high, but taller, remnant trees from cattle pastures or live fences were also present. Neither site contained large streams or rivers, as in mature forest. These transects were situated approximately 1.5 km from the edge of Soberania National Forest. In our transect areas, canopy cover averaged 51%, with tree heights ranging from 4 to 8 m.
Pasture
Two transects were in active cattle pasture either within or near the ASP principle area. Both pastures had a small river running through the center with gallery forest, and each had isolated, large, remnant trees in them. Each area of pasture included ~40 ha and the surrounding matrix of land uses included young naturally regenerating secondary forest (rastrojo) and other pastures. Cattle were grazed at the intensity of ~1.3 heads/ha. These transects were situated approximately 2–3 km from the edge of Soberania National Forest. Canopy cover was approximately 16% in our transect areas, with all cover coming from 20 to 25 m tall remnant trees.
Reforestation with native species
Two transects were set up in two distinct areas where reforestation with native species was occurring with the ASP site. All land was cleared completely before planting to homogenize the light environment, a requirement for the experimental design of the plantations that would not necessarily be followed to this extreme in a production plantation. Its previous use included active cattle pasture and young regenerating secondary forest (<5-years old). The reforestation treatments in 2008 included 75 ha of land area where five native timber species (Anacardium excelsum, Dalbergia retusa, Pachira quinata, Tabebuia rosea, and Terminalia amazonia) and five companion native species (Erytrina fusca, Gliricidia sepium, Inga punctata, Luehea seemannii, and Ochroma pyramidale) were planted either as a monoculture or as polycultural mixes. The bird survey transects were not situated with respect to particular plots of monoculture or polycultural treatments, but rather covered a much larger area that encompassed many treatments (each reforestation treatment plot was 45 × 39 m). At the time of the 2010 survey, most plantation trees were ~1–2 m in height. There was no canopy cover above the transects with native species reforestation. The grassy vegetation between trees was cleared four times a year since planting. One reforestation area was directly adjacent to Soberania National Forest while another was ~2 km away from the forest edge.
Bird and vegetation survey methods
In order to compare bird species richness and abundance, we sampled 80 points across the various land uses described above. The sample points fell along transects within each habitat type (see sample sizes in ). Within transects, each point was separated by >100 m and at least 50 m from the edge of a particular habitat. In particular, if a stream or river ran through our land-use type, we consistently set up our bird counts to avoid the stream-associated vegetation. We used a hand-held GPS to set up the points and confirm distances.
Table 1. Density estimates (number of birds per ha, D) and the corresponding coefficients of variation (CV) and 95% confidence intervals (CI95) generated by the program DISTANCE based on the number of bird detections (n).
For this study, we define a transect as a collection of 10 sample points, and a survey as one of the three distinct time periods when transects were walked and points were visited. All 80 points were visited twice within a survey, with at least 5 days between visits. The first survey occurred during the dry season, in January and February of 2010. The second survey happened in June and July 2010, during the wet season. The final survey occurred during the dry season in January and February of 2011. Since there were three surveys, each sample point was visited a total of six times during the study for a total of 480 bird count samples.
At the sample points, we counted birds using 10-minute fixed radius point counts (25 m radius) to record all visual and aural signs of birds. The point-count method is best suited for obtaining a broad sample of bird communities across a patchy landscape (Petit et al. Citation1995). Moreover, limiting our counts to a 25-m radius increased the detectability of birds across the different landscape types (Petit et al. Citation1995) and decreased the likelihood of counting the same birds from one point to the next. We surveyed for 10 minutes to improve the quality of our raw count data in terms of detectability (Etterson et al. Citation2009). During the hours of 6:00–10:00 am, on non-rainy days, one observer (RZ) was responsible for conducting the visual and aural surveys. For each bird detected, the observer estimated and recorded the radial distance from herself to the individual bird. An assistant, who made digital audio recordings during each point count, accompanied the observer. We did not count birds that were flying over the count circle. Along with point count data, we kept an ongoing list of additional sightings outside of points as we walked the transects. On most days we completed one transect (or 10 sample points).
To compare canopy characteristics among land-use types, we rapidly estimated canopy cover, average canopy height, and the height of the tallest emergent tree in our 25 m radius sample circle. To estimate the canopy cover, we took four readings (facing N, S, E, and W) with a hand-held concave densiometer at the center of the bird count point. For canopy and emergent tree heights, we used a digital rangefinder to improve our estimates. These vegetation measurements were not taken in the reforestation treatments because no canopy existed. Further, due to constraints, our vegetation sampling was not complete across all bird count points, but at least 10 points per habitat type were sampled.
Statistical analyses
We used the program DISTANCE 6.0 (Thomas et al. Citation2010) to estimate and compare the bird density among the four habitat types, pooled over all 480 counts. We fit at least six detection functions per habitat and used AIC model selection to choose the best-fit models. These were a half-normal model with a hermite polynomial expansion for mature forest, and a uniform model with cosine polynomial expansion for all other habitat types. The detection functions allowed an estimation of bird density (number of birds per hectare) in each of the four habitat types. We compared 95% confidence intervals to assess differences in bird density. The DISTANCE program requires a minimum of 60–100 observations within a category to give reliable estimates, so we did not do this analysis for migratory birds. While DISTANCE is often used to estimate detection probabilities and density estimates for individual bird species, we did not pursue this approach since only two bird species in our dataset had more than 60 individuals. In addition to the DISTANCE bird density estimates, we calculated the mean number of bird detections in different landscape types based on count data with no distance corrections, so that our results could be compared to previous studies. This also gives a relative abundance of birds in habitats with similar detection probabilities. To compare bird abundances in reforestation areas that were close and far from the forest edge, we relied on bird detections per point, as detection likelihood was similar in the same type of habitat. We used a two-tailed t-test to compare the abundance of birds in reforestation areas near and far from the forest edge. To further describe the bird community, we used the point count data to list the three most abundant species per habitat, and classify the species using diet and habitat information from Ridgely and Gwynne (Citation1989).
We used both point count data and our cumulative list of birds to report the total number of species observed in each habitat. With the point count data only, we used EstimateS (2010) to construct sample-based rarefaction (or species accumulation) curves for comparison of species richness among the habitats, scaling the curves to the number of individuals and the number of samples (Gotelli & Colwell Citation2001; Colwell et al. Citation2004). Since our curves did not reach asymptotes, we also used an asymptotic species richness estimator for species abundance data, Chao1, to represent species estimations in each land-use type (Chao Citation2005). For these analyses we used data from point counts in all of the surveys combined.
We also wanted to compare the species community composition among the habitats using point count data. We followed the techniques outlined in Clarke Citation(1993), which include calculating the Bray–Curtis index of similarity (Bray & Curtis Citation1957), followed by non-metric multidimensional scaling (NMDS) and analysis of similarity (ANOSIM). These analyses were all completed using the program PAST (Hammer et al. Citation2001). The community composition analyses compared the bird communities among sample points, with the bird species identities summed up over all surveys at each point. We also calculated an overall Bray–Curtis similarity value to numerically compare between the sites.
Results
Data from complete bird list
We recorded 225 bird species in our complete list, which combined fixed radius point counts and additional observations between points (Table S1). We recorded 109 species that occurred in mature forests only, and 143 species in natural succession. In cattle pasture and reforestation areas, we recorded 97 and 61 species, respectively for our complete list. Across all land-use types, we recorded 26 migratory bird species in our complete list (Table S1).
Data from point counts
We counted 1729 individual birds in fixed radius point counts. Using distance corrections, bird density estimates were significantly different in the four land uses, with the greatest density estimate in mature forest, then natural succession (, ). Bird density estimates in natural succession had overlapping confidence intervals with estimates from cattle pastures, although the overall estimate was greater in natural succession areas. Reforestation areas had very low bird density estimates (). When using the number of birds per point (or mean detections per point), we observed similar values in mature forest and natural succession (). Relative to these two habitats, we observed lower mean detection values for birds in cattle pasture and reforestation habitats (). In contrast, detection values for migratory bird species were greatest in natural succession and similarly low in the other habitats ().
Figure 1. Abundance estimates for birds in various landscapes of Central Panama. (a) Density estimates and 95% confidence intervals (error bars) for birds (no. of birds per hectare) using distance corrections. (b) Mean detections (or no. of birds) per point count survey for all bird species, error bars are one standard error. (c) Mean detections (or no. of birds per point count survey for migratory birds only, error bars are one standard error. For all panes, MF = mature forest, NS = natural succession, C = cattle pasture, R = reforestation with native species.
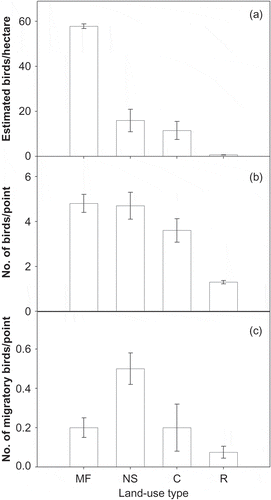
The accumulation of species occurred most rapidly during surveys in natural succession and mature forest (). The curves demonstrate the high species richness observed and estimated for natural succession, forest, and pasture, which differed from the reforestation area where abundances and species diversity estimates were relatively low (). The NMDS comparison of species similarity composition, however, suggests that species composition was more similar between mature forest and natural succession, while cattle pasture bird communities were more similar to those in the reforestation treatments (, ). Among all habitats, the bird community compositions were significantly different (ANOSIM R = 0.8301, p < 0.001). The low similarity between communities in forested and non-forested landscapes is also apparent when comparing the most abundant species of each habitat (Table 4). The mature forest was dominated by forest specialists and woodland generalists, while the other habitats were dominated by woodland and agricultural generalists (Table 4). The primary bird species in the reforestation areas were those that foraged in open, scrub habitats with seed-eating birds highly represented ().
Figure 2. Species richness curves and estimators for birds in various landscapes in Central Panama. Species rarefaction curves are scaled by (a) sample and (b) number of individual birds counted. (c) The Chao1 species richness estimator scaled by number of samples. For all panels, error bars represent 95% of confidence intervals and closed circles = mature forest, open circles = natural succession, closed triangles = cattle pasture, and open triangles = native species reforestation.
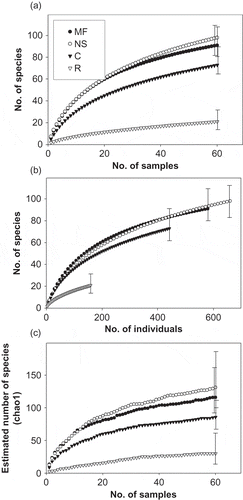
Figure 3. NMDS ordination plot using the Bray–Curtis index to show similarity among habitats, with 95% confidence ellipses. Each point represents the bird community species composition at one count point, summed over the different counts. Habitat labels are: mature forest = crosses, natural succession = open squares, reforestation = open circles, cattle pasture = filled triangles.
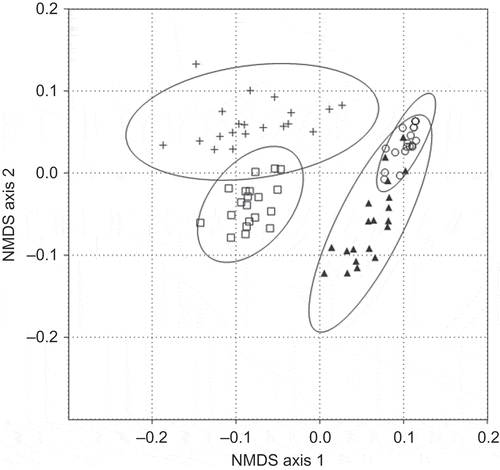
Table 2. Cumulative numbers of species observed and estimated number of species present in each land use, using point count data only from the Agua Salud Ecosystem Services Project in Central Panama.
Table 3. Similarity of species composition for total bird communities based on the Bray–Curtis index of similarity, among all pairs of habitats sampled in Central Panama.
Table 4. Most abundant bird species in each land-use type at the Agua Salud Ecosystem Services project in Central Panama, primary foraging substrate, diet and habitat affinity.
Distance to the mature forest edge had an effect on bird abundance and species richness in the reforestation areas. Using data from point counts at these two transects only, we found that the site adjacent to the forest had a significantly higher mean bird detections per point (mean ± 1 s.e. was 1.48 ± 0.10 for adjacent and 1.15 ± 0.10 for far transect; t = 2.339, d.f. = 18, P = 0.031 (two-tailed)). The number of species observed in each transect were 17 and 8 for adjacent and far transects, respectively. Abundances in this habitat were very low in general, and most sample points (81/120 or 68% of the points) had zero birds.
According to the IUCN Red List, nearly all of the species we observed were in the category of Least Concern for their conservation status. The only exceptions were two species in the Near Threatened category. These were Harpia harpyja (Harpy Eagle, observed in mature forest, known to be a reintroduction in the area) and Vermivora chrysoptera (Golden-winged Warbler, observed in natural succession).
Discussion
Our study recorded the greatest abundance and species richness of birds in mature forest and natural succession habitats. Cattle pastures and the early stages of tree plantations supported fewer bird species and had more similar species composition. We discuss these results with respect to differences in bird abundances in other parts of Central America, differences in bird-feeding guilds, and similarity of bird communities among the different land-use types. Further, we discuss several caveats in our interpretation due to aspects of the ASP study design and our bird survey methods.
The mean bird detections per point in our study were similar to previous studies in natural succession and restoration areas of Central America (Petit et al. Citation1999; Reid et al. Citation2012). The shift from dominance by understory insectivores and omnivores in mature forest to scrub granivores in more open habitats is similar to previous descriptions for bird communities in Central America (Petit et al. Citation1999; Milder et al. Citation2010; Karp et al. Citation2011). In general, birds were very sparse in the reforestation habitat. These sites lacked foliage and canopy cover, resulting in greater exposure to high temperature and low humidity, a lack of perching structures, and greater exposure to predators. The bird communities in the reforestation area were dominated by 2–3 bird species that are adapted to grassy, edge, or meadow-like habitats (). We observed these birds using the young reforestation trees as perches from which they foraged on seeds and insects associated with the grass growing between the trees. Similar results of low-bird counts were observed in agricultural situations relative to forests or shaded plantations (Petit et al. Citation1999; Estrada & Estrada-Coates Citation2005).
The cattle pasture sites in our study had intermediate levels of bird abundances relative to the other habitat types (). The pastures in our study had both isolated trees within pastures as well as live fences, both of which were used heavily by birds. Previous studies have also documented high bird use of isolated remnant trees (Guevara et al. Citation1986) and live fences in cattle pastures (Estrada et al. Citation2000; Estrada & Coates-Estrada Citation2005; Harvey et al. Citation2006). Live fences are increasingly being recommended as a management tool for increasing connectivity in agricultural landscapes (Leon & Harvey Citation2006).
The high abundance and species richness of birds in secondary or successional areas has been documented in many studies (Karr Citation1976; Martin Citation1985; Petit & Petit Citation2003), supporting the hypothesis that intermediate levels of disturbance lead to high-species richness (Connell Citation1978). A similar type of intermediate habitat between forests and pastures occurs in agroforestry systems. The bird abundances observed in our study, however, are lower than other studies that have measured abundances of birds in shaded coffee and cacao farms. For example, in our mature forest and natural succession areas, the mean number of bird detections per point was ~5± 0.5 (Figure 1b), while studies in these agrosystems have found a relatively greater mean bird detections per point, with mean values closer to ~8 birds per point (Petit et al. Citation1999; Reitsma et al. Citation2001; Van Bael et al. Citation2007). The increase in bird abundance in these shaded agroforestry systems is also represented by high abundances of migratory bird species, with mean values of ~1 bird per point in shaded cacao (Van Bael et al. Citation2007) and 0.6 birds per point in shaded coffee (Petit et al. Citation1999). These values for migratory species are equal to or greater than any of the landscapes in our study (Figure 1c), emphasizing the importance of shaded agroforestry systems for migratory bird species (Greenberg et al. Citation1994; Wunderle & Latta Citation1996; Greenberg et al. Citation1997; Van Bael et al. Citation2007).
Our measurements of species richness are likely underestimated. The bird community in one of our transect areas Soberania National Park (bordering the Limbo River) has been very well studied (Robinson et al. Citation2000). We compared our species number from the complete list to Robinson et al. Citation(2000) and found that we counted 74% of the number of species reported in their study, which was much more extensive in terms of time and types of survey methods. Looking solely at migratory birds, in our list the total species number was only 54% of the number of species reported in Robinson et al. Citation(2000). These comparisons, as well as the fact that our rarefied species accumulation curves did not plateau, suggest that future surveys will identify more species in these areas.
The proximity of a reforestation site to mature forest was an important factor in our study, even when the plantation trees were very small. Birds that use the edges of mature forest may be more likely to venture out into the ‘open’ setting of the new plantation, as our study showed a greater abundance and number of species near the forest. Graham and Blake Citation(2001) found that proximity to continuous forest was the most influential element for separating bird communities in a mixed agricultural and forested landscape in Southern Mexico.
In our study there are some important factors to address regarding comparability among the habitat types. These factors include (1) bird detection differences among the habitats, (2) differences in age since previous land use and (3) differences in treatment methodology. Not surprisingly, the best-fit detection function types were different in mature forest relative to the other habitat types. In mature forest, bird detections decreased with distance from the observer, while the other habitat types showed a uniform detection probability across our point count fixed radius. This resulted in relatively higher abundance estimates for mature forest when the distance correction was used compared to mean detections per point ( vs. ). With respect to age, native species reforestation trees had been planted recently, while the natural succession sites were 3–4 years further along in their development (~5–6 years since previous land use). This meant that the average tree height was 2 m taller in the natural succession sites compared to the native species plantation sites (Van Bael, personal observation). Moreover, the human-mediated reforestation treatments included the clearing of all previous trees to homogenize the light structure, while the natural succession areas still contained pasture-associated trees and live fences in the matrix of vegetation. Also, the underbrush was cleared four times a year in the reforestation plantations. Finally, it is important to point out that we did not count birds associated with stream vegetation in the cattle pasture or reforestation sites. If we had, the bird abundances and diversities would undoubtedly have been higher. A companion study at the ASP will focus exclusively on comparing the stream-associated birds in the human-modified and forested landscapes (G. Toral and S. Van Bael, in prep.)
In general, the effects of human-mediated reforestation on bird communities are not well known. For conservation purposes, it is important to know how human-mediated restoration efforts compare with natural succession. We show that bird abundances and species diversity remain very low in tree plantations within 1–2 years of planting, and that the birds using reforestation areas are very similar to bird communities in active cattle pastures. This work provides a baseline to compare subsequent periods, test our predictions for future development of bird communities in reforestation sites, and thereby assess the speed at which reforestation efforts with tree plantations will support a more diverse and abundant bird community. Such information will be useful for land managers who are trying to balance economic sustainability with biodiversity management, as well as for aiding ecosystem service evaluation of different land management schemes.
Supplementary material
Supplementary Table S1 is available online.
TBSM 842187 Supplementary material
Download PDF (111.4 KB)Acknowledgements
The authors thank Charles Perrings, Ann Kinzig, Michiel van Breugel, Federico Davis, Daniela Weber, Raineldo Urriola, Argelis Ruiz for help with planning, facilities, and logistics. For help in the field, they thank Andrea Concepcion, Robert Rich, Jack Hruksa, Isis Ochoa, and Katherine Arauz. The authors also thank the Smithsonian Tropical Research Institute, Arizona State University initiative, the Ruth Povo Foundation, and an anonymous donor for funding.
References
- Bray JR, Curtis JT. 1957. An ordination of the upland forest communities of southern Wisconsin. Ecol Monogr. 27:325–349.
- Chao A. 2005. Species richness estimation. Encyclopedia Stat Sci. 12:7907–7916.
- Chazdon RL, Peres CA, Dent D, Sheil D, Lugo AE, Lamb D, Stork NE, Miller SE. 2009. The potential for species conservation in tropical secondary forests. Conserv Biol [Internet]. 23:1406–1417. Available from: http://dx.doi.org/10.1111/j.1523-1739.2009.01338.x. doi:10.1111/j.1523-1739.2009.01338.x
- Clarke K. 1993. Non‐parametric multivariate analyses of changes in community structure. Aust J Ecol. 18:117–143.
- Colwell RK, Mao CX, Chang J. 2004. Interpolating, extrapolating, and comparing incidence-based species accumulation curves. Ecology. 85:2717–2727. Available from <Go to ISI>://000224844700011.
- Connell JH. 1978. Diversity in tropical rain forests and coral reefs - high diversity of trees and corals is maintained only in a non-equilibrium state. Science. 199:1302–1310. Available from <Go to ISI>://A1978EQ62200009. doi:10.1126/Science.199.4335.1302
- Estrada A, Cammarano P, Coates-Estrada R. 2000. Bird species richness in vegetation fences and in strips of residual rain forest vegetation at Los Tuxtlas, Mexico. Biodiversity Conserv. 9:1399–1416. Available from <Go to ISI>://000089974900004.
- Estrada A, Coates-Estrada R. 2005. Diversity of Neotropical migratory landbird species assemblages in forest fragments and man-made vegetation in Los Tuxtlas, Mexico. Biodiversity Conserv. 14:1719–1734. Available from <Go to ISI>://000229935300009.
- Etterson MA, Niemi GJ, Danz NP. 2009. Estimating the effects of detection heterogeneity and overdispersion on trends estimated from avian point counts. Ecol Appl. 19:2049–2066.
- Faria D, Laps RR, Baumgarten J, Cetra M. 2006. Bat and bird assemblages from forests and shade cacao plantations in two contrasting landscapes in the Atlantic Forest of southern Bahia, Brazil. Biodiversity Conserv. 15:587–612. Available from <Go to ISI>://000235489200003.
- Gotelli NJ, Colwell RK. 2001. Quantifying biodiversity: procedures and pitfalls in the measurement and comparison of species richness. Ecol Lett. 4:379–391.
- Graham CH, Blake JG. 2001. Influence of patch- and landscape-level factors on bird assemblages in a fragmented tropical landscape. Ecol Appl. 11:1709–1721. Available from <Go to ISI>://000172456700012. doi:10.2307/3061090
- Greenberg R, Bichier P, Angon AC, Reitsma R. 1997. Bird populations in shade and sun coffee plantations in central Guatemala. Conserv Biol. 11:448–459. Available from <Go to ISI>://A1997WV11500027.
- Greenberg R, Salgado-Ortiz J, Macias-Caballero C. 1994. Aggressive competition for critical resources among migratory birds in the Neotropics. Bird Conserv Int. 4:115–127.
- Guevara S, Purata SE, Maarel E. 1986. The role of remnant forest trees in tropical secondary succession. Plant Ecol. 66:77–84.
- Hall JS, Ashton MS, Garen EJ, Jose S. 2011. The ecology and ecosystem services of native trees: implications for reforestation and land restoration in Mesoamerica. Forest Ecol Manag [Internet]. 261:1553–1557. Available from: http://www.sciencedirect.com/science/article/pii/S0378112710007115. doi:10.1016/j.foreco.2010.12.011
- Hammer Ø, Harper DA, Ryan PD. 2001. PAST: paleontological statistics software package for education and data analysis. Palaeont Electronica. 4:9.
- Harvey CA, Medina A, Sánchez DM, Vílchez S, Hernández B, Saenz JC, Maes JM, Casanoves F, Sinclair FL. 2006. Patterns of animal diversity in different forms of tree cover in agricultural landscapes. Ecol Appl [Internet]. 16:1986–1999. Available from: http://dx.doi.org/10.1890/1051-0761(2006)016[1986:POADID]2.0.CO;2. doi:10.1890/1051-0761(2006)016[1986:poadid]2.0.co;2
- Hughes JB, Daily GC, Ehrlich PR. 2002. Conservation of tropical forest birds in countryside habitats. Ecol Lett [Internet]. 5:121–129. Available from: http://dx.doi.org/10.1046/j.1461-0248.2002.00294.x. doi:10.1046/j.1461-0248.2002.00294.x
- Ibáñez R, Condit R, Angehr G, Aguilar S, García T, Martínez R, Sanjur A, Stallard R, Wright SJ, Rand AS, Heckadon S. 2002. An ecosystem report on the Panama Canal: monitoring the status of the forest communities and the watershed. Environ Monit Assess. 80:65–99.
- Kaimowitz D. 1996. Livestock and deforestation in Central America in the 1980s and 1990s: a policy perspective. Jakarta: Center for International Forestry Research.
- Karp DS, Ziv G, Zook J, Ehrlich PR, Daily GC. 2011. Resilience and stability in bird guilds across tropical countryside. Proc Natl Acad Sci. 108:21134–21139.
- Karr JR. 1976. On the relative abundance of migrants from the north temperate zone in tropical habitats. Wilson Bull. 88:433–458.
- Leon MC, Harvey CA. 2006. Live fences and landscape connectivity in a neotropical agricultural landscape. Agroforest Syst. 68:15–26.
- Lindell CA, Cole RJ, Holl KD, Zahawi RA. 2011. Migratory bird species in young tropical forest restoration sites: effects of vegetation height, planting design, and season. Bird Conserv Int. 1:1–12.
- Marsden SJ, Symes CT. 2008. Bird richness and composition along an agricultural gradient in New Guinea: the influence of land use, habitat heterogeneity and proximity to intact forest. Aust Ecol. 33:784–793.
- Martin TE. 1985. Selection of second-growth woodlands by frugivorous migrating birds in Panama: an effect of fruit size and plant density? J Trop Ecol. 1:157–170.
- Milder JC, DeClerck FAJ, Sanfiorenzo A, Sánchez DM, Tobar DE, Zuckerberg B. 2010. Effects of farm and landscape management on bird and butterfly conservation in western Honduras. Ecosphere [Internet]. 1:art2. Available from: http://dx.doi.org/10.1890/ES10-00003.1. doi:10.1890/es10-00003.1
- Millenium Ecosystem Assessment. 2005. Ecosystems and human well-being: biodiversity synthesis. Washington (DC): World Resources Institute.
- Petit LJ, Petit DR. 2003. Evaluating the importance of human-modified lands for Neotropical bird conservation. Conserv Biol [Internet]. 17:687–694. Available from: http://dx.doi.org/10.1046/j.1523-1739.2003.00124.x. doi:10.1046/j.1523-1739.2003.00124.x
- Petit LJ, Petit DR, Christian DG, Powell HDW. 1999. Bird communities of natural and modified habitats in Panama. Ecography. 22:292–304.
- Petit DR, Petit LJ, Saab VA, Martin TE. 1995. Fixed-radius point counts in forests: factors influencing effectiveness and efficiency. Monitoring bird populations by point counts United States Forest Service, General Technical Report PSW-GTR-149.49-56. Washington (DC): United States Forest Service.
- Reid JL, Harris JBC, Zahawi RA. 2012. Avian habitat preference in tropical forest restoration in Southern Costa Rica. Biotropica. 44:350–359. Available from <Go to ISI>://000303496500010. doi:10.1111/J.1744–7429.2011.00814.X
- Reitsma R, Parrish JD, McLarney W. 2001. The role of cacao plantations in maintaining forest avian diversity in southeastern Costa Rica. Agrofores Syst. 53:185–193.
- Ridgely RS, Gwynne JA. 1989. A guide to the birds of Panama. Princeton (NJ): Princeton University Press.
- Robinson WD, Brawn JD, Robinson SK. 2000. Forest bird community structure in central Panama: influence of spatial scale and biogeography. Ecol Monogr. 70:209–235. Available from <Go to ISI>://000086984100002.
- Scales BR, Marsden SJ. 2008. Biodiversity in small-scale tropical agroforests: a review of species richness and abundance shifts and the factors influencing them. Environ Conserv. 35:160–172.
- Sekercioglu CH. 2006. Increasing awareness of avian ecological function. Trends Ecol Evol [Internet]. 21:464–471. Available from: http://www.sciencedirect.com/science/article/pii/S0169534706001595. doi:10.1016/j.tree.2006.05.007
- Stallard RF, Ogden FL, Elsenbeer H, Hall J. 2010. Panama Canal watershed experiment: Agua Salud Project. Water Res Impact. 12:17–20.
- Thomas L, Buckland ST, Rexstad EA, Laake JL, Strindberg S, Hedley SL, Bishop JRB, Marques TA, Burnham KP. 2010. Distance software: design and analysis of distance sampling surveys for estimating population size. J Appl Ecol. 47:5–14. Available from <Go to ISI>://000274191300002. doi:10.1111/J.1365–2664.2009.01737.X
- Van Bael SA, Bichier P, Ochoa I, Greenberg R. 2007. Bird diversity in cacao farms and forest fragments of western Panama. Biodiversity Conserv. 16:2245–2256. Available from <Go to ISI>://000247932200002.
- van Breugel M, Hall JS, Craven DJ, Gregoire TG, Park A, Dent DH, Wishnie MH, Mariscal E, Deago J, Ibarra D, et al. 2011. Early growth and survival of 49 tropical tree species across sites differing in soil fertility and rainfall in Panama. Forest Ecol Manag [Internet]. 261:1580–1589. Available from: http://www.sciencedirect.com/science/article/pii/S0378112710004780. doi:10.1016/j.foreco.2010.08.019
- Waltert M, Bobo KS, Sainge NM, Fermon H, Mühlenberg M. 2005. From forest to farmland: habitat effects on Afrotropical forest bird diversity. Ecol Appl. 15:1351–1366.
- Waltert M, Mardiastuti A, Muhlenberg M. 2004. Effects of land use on bird species richness in Sulawesi, Indonesia. Conserv Biol. 18:1339–1346. Available from <Go to ISI>://000224071800019. doi:10.1111/J.1523–1739.2004.00127.X
- Whelan CJ, Wenny DG, Marquis RJ. 2008. Ecosystem services provided by birds. Ann NY Acad Sci [Internet]. 1134:25–60. Available from: http://dx.doi.org/10.1196/annals.1439.003. doi:10.1196/annals.1439.003
- Wright SJ, Muller-Landau HC. 2006. The future of tropical forest species. Biotropica [Internet]. 38:287–301. Available from: http://dx.doi.org/10.1111/j.1744-7429.2006.00154.x. doi:10.1111/j.1744-7429.2006.00154.x
- Wright SJ, Samaniego MJ. 2008. Historical, demographic, and economic correlates of land-use change in the Republic of Panama. Ecol Soc. 13:17.
- Wunderle J, Latta S. 1996. Avian abundance in sun and shade coffee plantations and remnant pine forest in the Cordillera Central, Dominican Republic. Ornithol Neotrop. 7:19–34.