
 ?Mathematical formulae have been encoded as MathML and are displayed in this HTML version using MathJax in order to improve their display. Uncheck the box to turn MathJax off. This feature requires Javascript. Click on a formula to zoom.
ABSTRACT
Cancer is the second leading cause of death globally, and colorectal cancer (CRC) is among the five most common cancers. The small GTPase KRAS is an oncogene that is mutated in ~30% of all CRCs. Pharmacological treatments of CRC are currently unsatisfactory, but much hope rests on network-centric approaches to drug development and cancer treatment. These approaches, however, require a better understanding of how networks downstream of Ras oncoproteins are connected in a particular tissue context – here colon and CRC. Previously we have shown that competition for binding to a ‘hub’ protein, such as Ras, can induce a rewiring of signal transduction networks. In this study, we analysed 56 established and predicted effectors that contain a structural domain with the potential ability to bind to Ras oncoproteins and their link to pathways coordinating intestinal homoeostasis and barrier function. Using protein concentrations in colon tissue and Ras-effector binding affinities, a computational network model was generated that predicted how effectors differentially and competitively bind to Ras in colon context. The model also predicted both qualitative and quantitative changes in Ras-effector complex formations with increased levels of active Ras – to simulate its upregulation in cancer – simply as an emergent property of competition for the same binding interface on the surface of Ras. We also considered how the number of Ras-effector complexes at the membrane can be increased by additional domains present in some effectors that are recruited to the membrane in response to specific conditions (inputs/stimuli/growth factors) in colon context and CRC.
Introduction
The large intestine (also called large bowel or colon) is the last part of the gastrointestinal tract, which is responsible for the detoxification and elimination of non-absorbed ingested products while conserving fluids and electrolytes like sodium and chloride. Its inner surface is composed of columnar epithelial cells that – in contrast to the small intestine – have no villi protruding into the lumen [Citation1]. The intestinal epithelial cells (IECs) invaginate and create crypts, which increases the absorptive surface of the tissue. At the base of the crypt is a population of intestinal stem cells (ISCs), which proliferate, differentiate into diverse cell types, and migrate upwards to the surface. Together with luminal extrusion of effete cells, this enables the constant regeneration of the epithelial lining, the integrity of which is maintained by adhesion junctions between the IECs. It is intriguing to envisage the high level of coordination needed to enable intestinal cells to undergo a series of cell fates during their lifetime – part of which is achieved by members of the superfamily of small GTPases [Citation2–4].
Small GTPases of the Ras superfamily (with the Ras, Rac/Rho, Arf, and Rab subfamilies; see Figure S1) are critical regulators of intestinal epithelial homoeostasis and barrier function [Citation5]. Small GTPases tightly bind guanosine triphosphate (GTP) and guanosine diphosphate (GDP). Binding to GDP keeps the GTPase in an inactive state, whereas upon GTP binding, there is a conformational change in the protein structure that allows the binding and activation of diverse downstream effectors. The transition between these two states, inactive GDP-bound and active GTP-bound protein, is regulated by two main protein groups: GTPase-activating proteins (GAPs) that catalyse the hydrolysis of GTP and guanine nucleotide exchange factors (GEFs) that catalyse the exchange of GDP for GTP [Citation6]. The Ras oncoprotein members of the Ras subfamily, HRAS, NRAS and KRAS (with the isoforms 4A and 4B), henceforth referred to as Ras proteins, are membrane-associated proteins that play a fundamental role in cell signalling. When activated, Ras-GTP proteins can interact with several effectors (e.g. PI3-kinases, RalGDS, and Raf kinases), thereby controlling important cellular processes such as survival, polarization, adhesion, migration, and proliferation [Citation7].
CRC has been estimated to be the fourth leading cause of cancer death [Citation8], which is believed to be related to today’s pervasive lifestyle entailing an increase of risk factors such as diet, smoking or alcohol consumption [Citation9]. CRC development starts with the formation of precancerous polyps, which are aggregates of abnormal cells that protrude into the lumen of the colon. These polyps accumulate genetic changes that lead to invasion of the bowel wall and spread to surrounding lymph nodes, finally leading to remote metastasis. Genetically, tumour development in the colon is characterized by the stepwise accumulation of genetic and epigenetic alterations. APC loss and KRAS mutations are one of the early events in this process, followed by p53 loss. The majority of KRAS mutations are single point mutations at codons G12, G13, and Q61, which render K-Ras insensitive to GAP-mediated GTP hydrolysis. This results in an accumulation of constitutively GTP-bound active K-Ras in cells leading to enduring activation of downstream effector pathways. While Ras effectors have predominantly been studied in the context of the oncogenic Raf and PI3-kinase oncogenic pathways, there is evidence that other Ras effectors also play a role in cancer [Citation10].
Ras effectors are (with few exceptions) multi-domain proteins and their interaction with Ras proteins involves a domain with a ubiquitin-like fold [Citation11,Citation12]. Based on a limited sequence homology, the ubiquitin-like domains can be further subclassified into the RalGDS/AF6 Ras association domain (RA), the Ras binding domain (RBD), and the PI3-kinase family, Ras-binding domain (PI3K_rbd). However, the presence of an RA, RBD or PI3K_rbd domain per se does not qualify as a true effector for Ras proteins [Citation13,Citation14] and some effectors are likely not to bind, or bind with low affinity to Ras∙GTP [Citation13,Citation14]. All effectors bind to Ras proteins using the same and thus ‘mutually exclusive’ binding surface. Previous studies have shown that if Ras is present at limiting concentration, the formation of specific Ras-effector complexes and downstream pathway activation can be altered by changing the concentration of individual effector proteins [Citation15]. Therefore, changes in the relative concentrations of the Ras binding partners can cause network rewiring and alterations in cell fate decisions [Citation16]. As Ras has a wide range of binding partners, understanding how the interactions with its partners take place is key to comprehend how the signals propagate downstream and consequently modify the cellular outcomes. The central hypothesis is that manipulation of protein abundances of Ras interaction partners in colon cancer context may steer downstream signalling networks back to a more physiologically state and, for example, reduce proliferation.
Here, we analysed 56 established and predicted effectors that contain a structural domain with the potential ability to bind to Ras oncoproteins. Further, we classified the effectors according to their outputs into 12 downstream signalling pathways. Using in vitro measured and in silico estimated affinities, combined with protein concentrations in colon tissue, we generated a simple mathematical model of Ras effectors competing for binding to Ras. The model predicted that three out of 12 pathways are predominantly active in normal colon context, which are the RAF-MEK-ERK, the RAL-PLD, and the RASSF-MST pathways. The model also forecasted how downstream pathways rewired when the levels of active Ras were increased. Further, we examined the pairwise binding between Ras and effectors by accounting for additional domains present in Ras effectors that may interact with the membrane (where Ras is localized) in response to conditions and stimuli in colon context, as this will result in increased effective binding affinities.
Results
Identification and classification of 56 established and predicted human Ras effectors
Proteins that bind to the effector lobe of Ras proteins in the GTP-bound state (‘canonical’ Ras effectors) are characterized by presenting a domain with a ubiquitin (UB)-like topology [Citation12]. On the basis of different consensus sequences, the UB-like superfamily can be further sub-divided into the RA (RalGDS/AF6 Ras association domain), the RBD (Raf-like Ras-binding domain), and PI3K_rbd (Ras-binding domain of PI3Kinase-like proteins) domain sub-families. We used the PROSITE, SMART, and Pfam sequence-based prediction databases to retrieve all human genes and their close homologs/family members containing a canonical Ras binding domain, which resulted in a list of 56 effectors (note: RIN4 is a shorter version of the close homologs RIN1, RIN2, and RIN3, and it misses a Ras binding domain) (; Table S1). The largest number of ubiquitin-like domains belong to the RA family (65%), followed by the RBD (15%) and PI3K_rbd (12%) domains (Figure S2(a)). Three UB-like domains cannot be further sub-classified, and one domain was assigned manually as an RA domain [Citation17].
Figure 1. Domain composition of 56 putative human Ras effectors. Domain structure of proteins containing RA, RBD, PI3K_rbd and UB domains (in red). The Figure has been prepared following domain assignments in Table S1. Family members with similar domain compositions are only drawn once and all gene IDs are listed preceding the domains. The colour code for the additional domains follows the classification as in
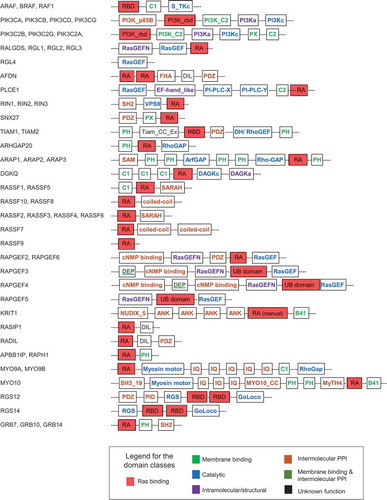
We also retrieved all domains that are predicted to be present in the Ras effectors in addition to the UB-fold (). Altogether, the 56 effectors contained 149 additional domains that fell into 41 domain families (Table S1). The number of additional domains present in Ras effectors ranged from zero to ten per effector (Table S1, Figure S2(b)). The 41 domain families were further sub-classified into four groups (Figure S2(b)):
Catalytic domains: This class contains 13 domains with catalytic functions, such as GAPs, GEFs, and serine/threonine kinases, which mediate signalling downstream of Ras-effector activation. Notably, many of the effectors contain domains that function as GEF and GAPs for other members of the Ras superfamily, such as Rap (RasGEF), Rho/Rac (RhoGAP and DH/RhoGEF), Arf (ArfGAP), and Rab (VPS9), suggesting that Ras protein signalling is upstream of those other Ras superfamily proteins (Figure S1(b)).
Intermolecular protein-protein interaction (PPI)-mediating domains: 15 domains, such as PDZ, SH2, and coiled-coil, are present in this group. They can mediate interactions with both upstream and downstream proteins in the signalling network. Examples are SH2 domains that bind to phosphotyrosine-containing peptides (e.g. of ErbB membrane receptors), PID domains that bind to phosphotyrosine peptides, and MyTH4 domains with the ability to bind to microtubules.
Membrane-binding domains: Six domains (PH, C1, C2, B41, PX, and PI3K_C2) can bind to membranes. PH domains are known to bind to inositol phosphates, C1 domains bind to diacylglycerol, and C2 domains bind to calcium and lipids.
Intramolecular/structural domains: These domains serve as accessory parts for the catalytic domains of RasGEF (RasGEFN), PI3Kc (PI3Ka), DAGKc (DAGKa), and PLCXc/PLCYc (EF-hand_like).
One domain (DEP) is involved in both, membrane binding and intermolecular PPI, whereas two others (DIL and Tiam_CC_Ex) have a yet unknown function. Summarizing, the domain analysis suggests that Ras effectors, in addition to their role as potential Ras interactors, are predicted to be part of a highly interconnected signalling network, where the additional domains can either serve as interaction platforms to mediate binding with other proteins and membrane structures, or as activity executing elements, or (as predicted for most of the effectors) a combination of both functions.
Ras effectors and downstream pathways in colon context
To obtain protein expression levels for Ras members and effectors in the context of the colon, data from a recent high-coverage mass spectrometry based deep proteome and transcriptome human tissue atlas were analysed [Citation18]. Protein expression data in colon tissue were available for two (K-Ras and H-Ras) of the three Ras proteins (K-Ras, H-Ras, and N-Ras) and for 49 of the 56 effectors (Table S2). The protein abundances for N-Ras and four effectors (RALGDS, RGL1, ARHGAP20, and RAPGEF5) not detected by mass spectrometry were estimated based on their mRNA (transcript) levels based on a regression model between transcript and protein levels of all detected genes/proteins in colon tissue [Citation18] (); Table S2). Three Ras effectors (RGL4, RASSF10, and RASSF9) were not detected by either mRNA sequencing or mass spectrometry (of colon tissue). K-Ras was most highly expressed (276 nM) compared to the other Ras members and indeed all effectors, which concentration ranged in from 0.01 nM (= no protein expression) to 50 nM ()). To link the effectors that are expressed in colon tissue (above a threshold of > 1 nM) to downstream pathways that are likely relevant in intestinal cells, the 56 effectors were classified into 12 groups based on their additional domains present and/or their known functions obtained from specific literature searches (Table S1; )):
Figure 2. Protein concentrations and pathways downstream of expressed Ras effectors in colon. (a) Protein concentrations of Ras proteins and effectors in colon tissue based on the Wang et al 2019 dataset [Citation12]. The colours correspond to the 12 different downstream pathway classes associated with the 56 Ras effectors (see panel b). A star preceding the protein name indicates that protein concentrations were extrapolated from mRNA levels. (b) Ras effectors expressed in colon tissue (≥ 1 nM) are shown as circles where their sizes correspond to their protein expression levels (see legend). The 12 downstream effector pathways connect to a variety of output/responses and their known (or potential) role in colon homoeostasis and physiology
![Figure 2. Protein concentrations and pathways downstream of expressed Ras effectors in colon. (a) Protein concentrations of Ras proteins and effectors in colon tissue based on the Wang et al 2019 dataset [Citation12]. The colours correspond to the 12 different downstream pathway classes associated with the 56 Ras effectors (see panel b). A star preceding the protein name indicates that protein concentrations were extrapolated from mRNA levels. (b) Ras effectors expressed in colon tissue (≥ 1 nM) are shown as circles where their sizes correspond to their protein expression levels (see legend). The 12 downstream effector pathways connect to a variety of output/responses and their known (or potential) role in colon homoeostasis and physiology](/cms/asset/bbab3f1e-3b89-4966-869a-4e720ca1b118/ksgt_a_1724596_f0002_oc.jpg)
MEK-ERK-ETS signalling: This class comprises the effectors ARAF, RAF1, and BRAF, of which ARAF is most highly expressed. This pathway links to mitotic signalling and thus proliferation/self-renewal and differentiation of ISCs [Citation19].
PIP3-PDK-AKT-BAD signalling: This group includes the effectors PIK3C2A, PIK3C2B, and PIK3CB, with PIK3C2A having the highest concentration. PI3 kinase signalling is critical for intestinal epithelial cell growth and survival [Citation20].
Ral-PLD-Sec5 signalling: This class consists of the effectors RGL1, RALGDS, RGL2, and RGL3, of which RGL1 is highest expressed. Ral GTPases are important for the regeneration of ISCs through the internalization of Wnt receptors [Citation21].
Actin-Nectin-cadherin signalling: The effector AFDN (alternative gene ID: MLLT4) is the only member of this group. AFDN is important for formation of adherens junctions, and thereby organizes adhesion between intestinal cells and thus barrier functions [Citation22].
DAG-IP3-PKC-Ca signalling: This group is comprised of the effector PLCE1, which, however, is not expressed in colon tissues according to the Wang et al, 2019 dataset [Citation18]. A role for PLCE1 in NF-κB-dependent proinflammatory gene expression has been proposed in colon epithelial cells [Citation23] and its altered expression levels have been associated with CRC [Citation24].
ABL-RAB4-RAB5 signalling: This group is constituted of the effectors SNX27, RIN2, RIN1, and RIN3, of which SNX27 is the most highly expressed. The Rab subfamily controls intestinal epithelial barrier integrity by endosomal recycling of junctional proteins [Citation5]. Rab vesicles have also been implicated in the Wnt ligand delivery and Paneth cell maturation at the intestinal stem cell niche [Citation25].
RAC-PAK-RHO signalling: This class is composed by the effectors ARAP1, ARHGAP20, and DGKQ, of which ARAP1 is the most highly expressed. Rho and Rac proteins are regulators of the actin cytoskeleton, which is critical to mediate interactions with junctional proteins such as occludin and zona occludens (ZO) proteins in epithelial cells [Citation26].
MST-LATS-Hippo signalling: The Effectors RASSF4, RASSF2, RASSF5, RASSF7, and RASSF9 belong to this class of which RASSF4 is the most highly expressed. RASSF proteins serves as an adaptor for the assembly of multiple protein complexes, involving MST kinases and other SARAH domain proteins [Citation27]. The MST/Hippo pathway plays a role in intestinal regeneration by regulating cell proliferation, apoptosis and differentiation [Citation28].
RAP-signalling: This group is comprised of the effectors RASIP1, RAPGEF5, RAPGEF2, RAPGEF6, KRIT1, APBB1IP, and RAPH1, of which RASIP1 is most highly expressed. Rap signalling is critical for cell-cell junction formation between epithelial cells [Citation5,Citation29].
Myosin-Actin signalling: The effector MYO9B is part of this class. This non-muscle myosin is an actin-based motor, which is important for intracellular movements. MYO9B contains a GAP domain specific for Rho GTPases and plays a role in cell migration and regulation of intestinal epithelial barrier functions [Citation30].
GPCR and G-protein signalling: The effector RGS14 belongs to this group. It is suggested to act as a scaffold that integrates G protein and RAS-RAF-MAP-kinase signalling pathways [Citation31]. It is at present unknown which function RGS14 exhibits in the context of the intestine, but network analyses based on the STRING database [Citation32] suggest a link with RAP signalling and thus junction/adhesion pathways.
RTK signalling: This class includes the effector Grb7. The SH2 domain of Grb7 is known to bind many receptor tyrosine kinases (e.g. ErbB, Tek/Tie, Kit, and ephrin receptors) as well as cytoplasmic proteins [Citation33]. ErbB and ephrin signalling is important for intestinal stem cell homoeostasis and regeneration [Citation34,Citation35]. Grb7 has been shown to associate with focal adhesion kinase (FAK) and to play a role in cell migration in intestinal cells [Citation36].
Altogether, it is remarkable that all downstream Ras effector pathways converge one way or the other on output responses such as cell adhesion/cell junctions/barrier function, migration, proliferation, survival, and apoptosis – processes that all play a critical role in intestinal homoeostasis and barrier function.
A computational model of Ras-effectors in the context of the colon
The different effectors compete for binding to Ras proteins as they use a similar binding site on Ras, hence characterizing their interaction as mutually exclusive ()). Based on the law of mass action at steady state, it holds that the amount of a particular effector complexed with Ras is related to the affinity between Ras and the effector (Kd or equilibrium dissociation constant) and the concentrations of all proteins involved (see Methods). As the presence of an UB-like domain is not alone a sufficient criterion to qualify as a high affinity interactor for Ras, but is the result of specific amino acid interactions with favourable energy contributions in the interface, Kd values have to be assessed on a pair-wise individual basis for all Ras-effector complexes. Equilibrium binding constants for the different Ras-effectors were collated, when available, from previous biophysical characterizations of in vitro expressed and purified proteins (e.g. isothermal titration calorimetry or surface plasmon resonance) (Table S3) (reviewed in [Citation37], and obtained from [Citation13,Citation14,Citation38–40]). Further, estimates of Kd values for Ras and effectors were obtained from a previous genome wide in silico 3D structure-based prediction/homology modelling and energy calculation approach [Citation17].
Figure 3. Network modelling of Ras effector interaction and competition. (a) Overlay of seven 3D complex structures with Ras displayed in grey in all structures and the UB-like domains (of effectors) shown in different colours as indicated next to the superimposition. The following pdb structures were used: 1gua.pdb for RAF1, 1he8.pdb for PIK3CG, 1lfd.pdb for RALGDS, 6amb.pdb for AFDN, 2c5l.pdb for PLCE1, 3ddc.pdb for RASSF5, and 4k81.pdb for GRB14. The superimposition and visualization was done using the SwissPdbViewer software. (b) Results of the equilibrium network analysis of nano molar concentrations of Ras-effector complexes in colon tissue. The complex formations were calculated using increasing amounts of total Ras with 100% corresponding to the total concentration of Ras for mimicking a 100% load of GTP. (c) Similar as in panel (b), but the Ras-effector complexes are here displayed in percent (normalized by the total concentration of all Ras-effector complexes)
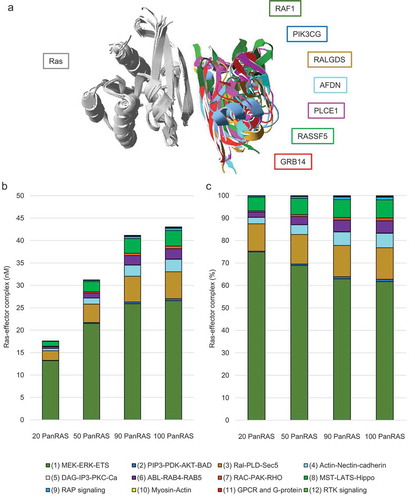
An equilibrium binding model for Ras in complex with the 56 effectors was generated based on the mass action law and mutually exclusive binding sites (see Methods), where effector-specific Kd values (Table S3) and concentrations in the context of colon for Ras proteins and effectors were incorporated (Table S2). As Ras has to be in a GTP-bound active conformation to bind effectors, different concentrations of active Ras were used in the model, where 100% GTP load corresponded to the total Ras (sum of H-, N-, and K-Ras) concentration in colon tissue. Solving the equations of our Ras-effector model system allowed us to calculate the concentrations for each of the effectors in complex with Ras in equilibrium (Table S4). To enable easier visualization and biological relevant data interpretation, the individual complex concentrations were summed up according to the 12 effector pathway groups defined before ()). Due to the high abundance of K-Ras in colon tissue, ~88% of effector complexes are formed with K-Ras as compared to H-Ras and N-Ras (Figure S3).
In normal colon tissue, the active Ras (GTP) concentration was estimated to be 20% (in mouse fibroblasts [Citation41]). In this low Ras-GTP regime, the 01_RAF_MEK_ERK effector group had the highest concentration of complexes formed with Ras (13 nM), followed by the 03_RALGDS_RAL and 08_RASSF_MST_LATS_Hippo effector groups. When the levels of active Ras were increased, as expected, overall a higher concentration of effectors were found in complex with Ras and the same order of Ras-binding preference was kept ()). However, when normalized to the total concentration of Ras-effector complexes ()), the high affinity binders, like for instance Raf proteins, bound proportionally less, in favour of more binding of low affinity effectors, such as the effectors associated with the pathways 04_AFDN_Actin_Nectin_Cadherin and 06_RIN_ABL_RAB. Thus, both a quantitative (overall more binding of effectors) and a qualitative (proportionally more binding of low-affinity effectors) effect with increased active Ras was predicted by our computational model.
Some of the 56 Ras effectors also bind to other Ras subfamily members, such as RAP [Citation42] and RRAS proteins (Figure S4(a)), sometimes even with higher affinity than to Ras [Citation13]. As RAP and RRAS proteins are highly expressed in colon tissue (Figure S4(b), this is expected to impact our competition model in the sense that less effectors would be available to bind to Ras as they are sequestered by RAP/RRAS proteins. We tested this by incorporating additional reactions involving binding of some of the 56 effectors (such as AFDN and RALGDS) to RAP and RRAS proteins (Table S5). The impact on Ras-effector complex formation was only minor (Figure S5(a)-(c)), which can be related to the low affinity of those effectors (such as AFDN and RALGDS) in complex with Ras. However, including RAP and RRAS proteins as interactors for some of the 56 Ras effectors, overall increases the total amount in complex with Ras/RAP/RRAS for some of the effector classes, such as class 3 (RALGDS & endocytosis) and class 4 (AFDN & adhesion) (Figure S5(d)-(e)). Due to the high abundance of RAP and high affinity in complex with AFDN, the adhesion signalling pathway becomes of greater importance in normal colon context and of respective smaller relevance when Ras oncoproteins are upregulated (Figure S5(e)). It also shows that with increasing GTP levels of Ras oncoproteins, mainly the Ras-mediated proliferation pathway increases, while RAP-mediated adhesion pathways are unaffected, ultimately decreasing the ratio of adhesion vs proliferation.
To explore further the behaviour of the Ras-effector competition model, we next generated patient-specific models for individual CRC patients. Gene expression information for Ras proteins and effectors was obtained from the TCGA database for 170 individuals with KRAS mutation-driven colon cancers. For each patient-specific model, the Kd values were kept identical as in our previous model (Table S3), but the Ras and effector protein concentrations (estimated from a protein-specific gene-protein relation; see methods) in colon tissue were changed according to each patient’s expression value (assuming 100% GTP load; Table S6). The 56 Ras-effector complexes were calculated for each of the 170 models and added up according to the 12 effector groups (). The predicted Ras-effector complexes showed a substantial variability for the individual CRC tissues (), albeit the group-related averages across all individuals correlated remarkably well (R = 0.98) with the Ras-effector complexes with 100% active Ras in normal colon tissue (Table S2) for the 12 effector groups computed previously ()).
Figure 4. Results of personalized network modelling of Ras effector interaction competition in 170 CRC patients. (a) Ras (sum of H-, K-, and N-Ras) concentrations in 170 CRC patients. (b) Results of the equilibrium network analysis of 56 Ras-effector complexes added up according to the 12 effector classes in CRC tissue of 170 patients. The samples patients follow the same order as in panel (a). (c) Boxplot representation of concentrations of Ras in complex with effector class 01 (associated with the MEK_ERK_ETS pathway). (d) Boxplot representation of concentrations of Ras in complex with effector class 03 (associated with the Ral_PLD_Sec5 pathway). (e) Boxplot representation of concentrations of Ras in complex with effector class 08 (associated with the MST_LATS_Hippo pathway). (f) Correlation of the 12 Ras effector group complex concentrations in normal colon tissue (with 100% active Ras) with the average complex concentrations of the 12 Ras effector groups in CRC tissue of the 170 individuals. The arrows in panels (c), (d), and (e) indicate the concentration of complex formation in normal colon context with 100% active Ras
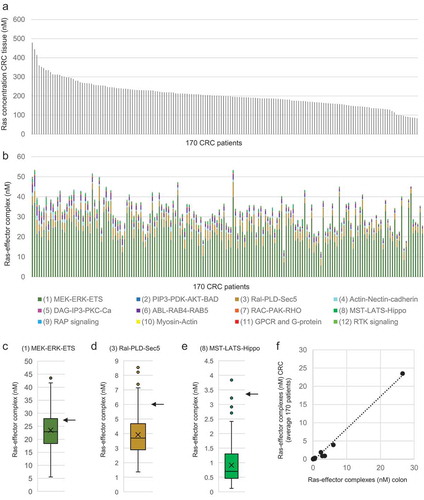
In summary, our model suggests that the RAF_MEK_ERK effector group is the main group in complex with active Ras both in normal colon and in CRC tissues (~60%). However, other effector groups, such as the Ral_PLD_Sec5, the MST_LATS_Hippo, the Actin_Nectin_cadherin, and the Abl_Rab groups compete for binding and are predicted to be in complex with Ras proteins (~15%, ~5%, ~5%, and ~5%, respectively), in particular with increasing active Ras concentration as this favours binding of low affinity effectors.
Additional domains that are predicted to increase the number of Ras-effector complexes at the plasma membrane
The ability of Ras to act as a signalling hub is inevitably linked to its enrichment at the plasma membrane (PM) [Citation43]. However, network modelling suggested that membrane anchoring of only one of the two interacting partners only leads to a small increase in the number of complexes formed by the two partners [Citation44]. Rather, it needs the association of both interacting partners to the PM that is then predicted to significantly increase the number of interacting complexes by increasing the ‘apparent binding affinity’ around 100-fold (‘piggyback’ mechanism [Citation44];). Therefore, understanding the rules and affinities that dictate binding of UB-like domains to Ras and of additional effector domains to the membrane, or to membrane-associated proteins, becomes of equal importance. As many effectors have rather low binding affinities mediated by their Ras binding domains, the condition-specific additional effector recruitment to the plasma membrane can provide a mechanism to transiently alter Ras-effector binding hierarchies and downstream signalling pathways.
The cellular localizations of Ras effectors are predominantly in the cytosol, although additional subcellular localizations are possible according to the COMPARTMENTS databases (https://compartments.jensenlab.org/Search) (Figure S6). Manual literature searches were performed for all the additional domains identified in the 56 effectors to determine the domains that can associate to the PM either directly or through interaction with membrane-associated (transmembrane) proteins. We found that 38 effectors have at least one domain that has the potential to bind the PM or PM-associated proteins ()). Interestingly, there was a very good agreement between the 38 effectors identified via our domain-based approach and the subcellular PM localization retrieved from the COMPARTMENTS database (Figure S6). For example, effectors such as RalGDS and RASSF family members that lack a specific domain for membrane association, were generally not localized to the PM (Figure S6).
Figure 5. Additional domains in effectors that can mediate binding to the PM or PM-associated proteins. (a) Statistics for effectors and additional domains with ability to be linked to the PM. (b)-(i) Schematic representations and affinities between UB-like domains binding to Ras (R) and additional domains and their binding partners (selected examples for which affinities are available)
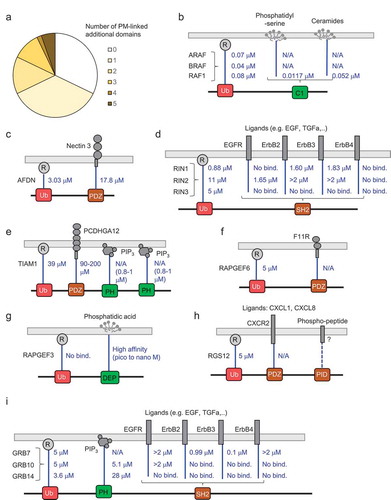
We next gathered specific information for each of the 56 effectors in the 12 effector groups regarding their detailed mode of interaction with the PM and/or PM-associated proteins, including affinities whenever available (). We also highlighted stimuli and conditions that could favour the recruitment of the domains to the membrane during normal intestine homoeostasis and in CRC context.
Raf effectors (class 1): The C1 domains of Raf proteins can bind to the PM, and for RAF1 this binding has been linked to an increased effective affinity with Ras at the membrane, thereby promoting MAPK signalling [Citation45,Citation46]. In agreement with this, high affinities were determined with different lipids such as phosphatidylserine and ceramide in complex with the C1 domain of RAF1 () [Citation47],). Sphingolipids, such as ceramide, are enriched in the apical membrane of the polarized intestinal cells and alterations in sphingolipid metabolism are observed in CRC [Citation48,Citation49]. Thus, the condition-specific lipid composition of intestinal cells may impact the number of signalling complexes between Raf kinases and Ras.
PI3K effectors (class 2): The group of PI3K contains several domains with the ability to be associated to the PM, such as C2, the PX, and the PI3K_C2 domains. Recent biochemical studies have shown cooperative binding of the C2 and PX domains with affinities in complex with different phosphoinositides in the range of 4.5 to 52 μM [Citation50]. An important source of phosphoinositide production at the PM are PI3K’s themselves. Gain of function mutations in PI3K (e.g. in PIK3CA) are found in 10–20% of colorectal cancers [Citation51].
RalGDS effectors (class 3): This group of RalGDS/RalGDS-like proteins does not contain any additional domains with the potential to link to the PM, which agrees well with subcellular localization information (Figure S6).
Afadin (class 4): The binding affinity of the PDZ domain of AFDN in complex with a peptide of the cell adhesion protein Nectin 3 was in the range of 17.8 μM [Citation52], which together with the moderate binding affinity in complex with Ras (3.03 μM) could nevertheless improve overall binding and the number of Ras-AFDN complexes at the membrane ()). Expression changes of cell adhesion-associated proteins have been shown to be associated with colorectal cancer progression [Citation53].
PLCE1 (class 5): This phospholipase contains a C2 domain that could direct the protein to the membrane, possibly by binding to the alpha subunit of heterotrimeric G proteins [Citation54] in addition to binding to Ras∙GTP [Citation55].
SNX27_RIN effectors (class 6): RIN family members (RIN1, RIN2, and RIN3) contain SH2 domains – a domain type with the ability to bind phosphotyrosine peptides. Binding affinities were determined with each of the three SH2 domains in complex with a large set of different phosphopeptides corresponding to sequences of the ErbB family member receptors ()) [Citation56]. The highest binding affinities ranged between 1.6 and > 2 micromolar. ErbB signalling is critical in normal intestinal homoeostasis [Citation19] and its downstream pathways are also involved in the development and progression of CRC [Citation57].
TIAM_RAC/RHO-linked effectors (class 7): TIAM1 and TIAM2 both contain a PDZ domain and two PH domains that can associate to the PM. Peptide binding motifs of TIAM PDZ domains were recently experimentally determined, which predicted that TIAM1 could bind to the Protocadherin gamma-A12 adhesion molecule with affinities in the range of 90 to 200 μM [Citation58] ()). Binding affinities of the PH domains with PIP3 were estimated to be in the range of 0.8 to 1 mM (estimated from other PH domain containing RhoGEF proteins [Citation59]). Thus, Ras-mediated TIAM1 activation of Rac1 [Citation60] may be condition specific, modulated through adhesion and phospholipid signalling.
RASSF effectors (class 8): Except RASSF1 and RASSF5 proteins, which contain a C1 domain, no other RASSF family member contains a domain with the ability to associate to the PM. A recent combined experimental and structural modelling work suggested that the C1 domain of RASSF1A is required for death receptor-dependent apoptosis by mediating binding to the tumour necrosis factor receptor 1 and TRAIL-R1/DR4 [Citation61].
RAPGEF/RAP-linked effectors (class 9): The PDZ domain of RAPGEF6 (= PDZ-GEF2) has been shown to interact with the junction protein F11R (= JAM-A) [Citation62], but no affinity was determined for this interaction ()). The DEP domain of RAPGEF3 (= Epac1) has been shown to bind to phosphatidic acid at the PM with estimated high affinity [Citation63] ()). However, cAMP is needed to bind to RAPGEF3 in order to release the autoinhibition and free the DEP domain to interact with the PM.
Myosin-linked effectors (class 10): MYO9A binds to cell-cell junctions on one end and to the actin filaments on the other end, thereby connecting the actin cytoskeleton and Rho-mediated (RhoGAP) signalling at cell junctions for coordinating epithelial cell migration [Citation30].
RGS effectors (class 11): The PDZ domain of RGS12 has been shown to bind to the interleukin-8 receptor B (CXCR2) [Citation64], but no affinities were measured ()). Overexpression of CXCR2 has been associated with poor prognosis in CRC patients [Citation65] and its ligands (the CXC family of chemokines) have been suggested as prognostic markers and drug targets in CRC [Citation66].
GRB effectors (class 12): The SH2 domains of GRB7 and GRB10, similar as the RIN1/RIN2 proteins, have been shown to bind to phosphotyrosine peptides of the ErbB family receptors ()) [Citation56]. Together with the PH domain present in all Grb effectors with affinities in the range of 5 to 28 μM for GRB10 and GRB14 [Citation67], each of the three Grb family members has at least one additional domain where binding has been demonstrated to the PM or a PM-associated protein.
In summary, many Ras effectors were identified that not only contain at least one additional domain with the potential to bind to the PM or PM-associated proteins, but in many instances, we found direct binding evidence. In addition, many of those binding events had been shown to be of relevance in colon or CRC context.
Discussion
Systems biology and associated network-centric approaches are becoming an increasingly powerful tool in drug discovery and development [Citation68]. Computational modelling can be used to reveal system behaviours that are otherwise difficult to isolate or to study experimentally. In the present study, we generated a quantitative network model that predicted the concentration of effectors in complex with Ras oncoproteins at equilibrium using law of mass action and thus unravelled how effectors compete for binding to Ras proteins. The model required equilibrium binding constants (Kd values) and the concentrations of Ras proteins and effectors in colon/colorectal cancer tissue.
All Ras effectors described to date contain a domain with an UB-like fold that mediates binding to Ras. However, binding affinities can vary considerably for different effectors [Citation13], and despite extensive research in the past decade, not all UB-like domains of Ras effectors have been probed experimentally for binding to Ras [Citation37]. Moreover, none of the affinities have been probed in the context of the full-length protein. As a result, currently many affinities are only available as estimates based on 3D structure-energy predictions [Citation17], which however, are also strong evidence, as these predictions were extensively validated and calibrated against experimental data [Citation17]. Here, we have taken a systems approach and established a list of 56 effectors that contain a structural domain with the potential to bind to Ras proteins. Except for three effectors, we could assign to each Ras-effector pair a Kd value that was either previously in vitro experimentally determined or in silico computationally predicted. With respect to tissue-specific concentrations, we would like to emphasize the exceptionally high coverage of protein detection in 29 human normal tissues published by Wang and colleagues [Citation18]. This, for the first time enabled the generation of a Ras-effector competition binding model of that scale where most protein concentrations were directly available from a mass spectrometry study and did not have to be estimated from mRNA levels (which is known to poorly correlate with protein levels [Citation69]). Moreover, as Wang and colleagues [Citation18] also measured mRNA levels in the identical colon tissue, we were able to calculate a pairwise gene-specific mRNA-protein relation, a factor that was used to calculate protein concentrations from gene expression values for colon cancer tissues catalogued in the TCGA database [Citation70]. As large-scale consortia, such as GTEx [Citation71] or TCGA [Citation70] have provided substantial gene expression data for individuals in different normal and cancerous tissues, this opens the exciting possibility for the generation of personalized mathematical models that include protein concentrations that are estimated from mRNA levels in an (as) accurate (as possible) way. It will also enable to fine-tune patient-specific models by incorporating the adjusted binding constants in a mutant-specific fashion (e.g. KRAS G12D vs G12V, G13D, etc) [Citation72].
By combining Ras-effector binding constants (Kd values) with protein concentrations in colon tissue, a mathematical network model was generated that is able to predict how Ras differentially engages with different sets of Ras effectors. The Raf effectors were found to be the main group predicted to be in complex with Ras in normal colon context (~60%). The downstream MEK-ERK-ETS pathway is related to cell migration, lipid metabolism, transcription and in general, cell proliferation. Other effector groups, such as RalGDS/-like effectors, RASSF effectors, AFDN, and RIN effectors are predicted to be less found in complex with Ras (~15%, ~5%, ~5%, and ~5%, respectively). The RASSF-MST-LATS pathway leads to both cell cycle progression and apoptosis, as well as microtubule reorganization. While it was remarkable to observe that many of the 12 Ras effector pathways converged on migration and adhesion-related outputs, pathways related to proliferation, survival and apoptosis quantitatively dominated according to our Ras-effector model. Our model also predicted that with increasing concentration of active Ras the total amount of all effectors that form complexes increase, but that increasing Ras especially favoured binding of low affinity effectors that otherwise cannot effectively compete. In fact, 18 effectors have measured or predicted Kd values of >10 μM, suggesting that they are not real Ras binders, or ‘condition-specific’ effectors that only engage in effective complexes with Ras if they are recruited to the PM using additional domains (‘piggyback’ mechanism [Citation44]).
Additional domains present in effectors were further predicted to increase the number of complexes formed between Ras and effectors at the PM. Many of the effectors contained classical membrane-binding domains, such as PH, C1 or C2 domains [Citation73]. The PH domains are small domains found in a variety of proteins and can bind phosphatidylinositol in biological membranes. The C1 domain or Protein kinase C-like phorbol ester (PE)/diacylglycerol (DAG)-binding domain binds PE and DAG in a phospholipid and zinc dependent manner. The C2 domain is a calcium dependent membrane targeting module found in cellular proteins and is involved in signal transduction and membrane trafficking. C2 domains show lipid selectivity for the components of cell membranes such as phosphatidylserine and phosphatidylcholine. Therefore, condition-specific alterations in the composition of lipids in the PM can modulate the amount of a particular effector in complex with Ras at the PM. For example, profound shifts in the composition of lipids have been observed during differentiation of epithelial cells, where
sphingomyelin shifted towards glycosphingolipid, together with an increase in plasmalogen, phosphatidylethanolamine, and cholesterol [Citation74]. Other effectors contained domains that mediated binding to proteins that were constitutively associated to the PM, such as adhesion receptors (for AFDN, TIAM1, and RAPGEF6), receptor tyrosine kinases (for RIN1, RIN2, GRB7, and GRB14), G protein-coupled receptors (for RGS12) and death receptors (for RASSF1). While interactions of effectors with adhesion receptors are expected to be permanent (unless adhesion receptors are degraded, e.g. during migration phases), interactions that involved binding of SH2 domains to phosphotyrosine peptides of receptors will be transient and dependent on a certain stimulus (e.g. EGF and TGFα for the activation of ErbB family receptors and CXCL1 and CXCL8 for CXCR2).
As affinities for Ras-effectors mediated by the UB-like domains and those of additional domains in complex with the PM/PM-associated proteins are generally in similar orders of magnitude (both ranging from nM to μM), it will become of equal importance to understand and quantify both modes of binding and integrate them into mathematical models. In fact, the combination of two anchor points in two proteins is predicted to greatly impact the overall affinity between two proteins [Citation75]. This is expected to have important consequences for network rewiring downstream of oncogenic Ras proteins. Supposedly, rewiring would not anymore be merely result of a constitutive activation of (mainly) a single downstream Raf-MAPK pathway, but the result of all competing interactions that are effectively modulated by signals (e.g. microenvironment) of the tumour or anatomical changes (poor differentiation and loss of cell adhesion in advanced cancer stages).
Over the last 10 years, it became apparent that properties of signalling networks are highly cell type-specific [Citation76–78]. Therefore, efforts to measure cell- and tissue-specific protein expression levels are increasing (e.g. the Human Protein Atlas initiative [Citation79]). The question now becomes rather how to integrate protein abundances with context-specific conditions and localized signalling responses. Even if we take our Ras-effector network as a simple example, it becomes clear that quantitatively predicting the impact of micro environmental conditions, will almost certainly require the consideration of way larger (if not complete) networks to get a satisfactory predictive model. Henceforth, moving towards whole-cell/-tissue networks highlights the need for new transformational approaches to predict how biological signalling networks are rewired in specific (patho)physiological contexts. As K-Ras mutated CRC is a health burden that current therapies cannot successfully treat, rewiring protein networks from a cancerous state to a more physiological normal state is of high interest as it could pave the way for identifying novel drug targets.
Materials and methods
Identification of effectors that contain Ras binding domains
The sequence-based prediction of domains is based on a set of sequence features. As different tools use slightly different consensus sequences to recognize a specific domain, we used four different sequence-based prediction tools to retrieve the list of all human proteins that contain a Ras binding domain. The SMART (Simple Modular Architecture Research Tool) database (http://smart.embl.de/) contains protein information mainly related to domains and domain architecture for a range of organisms. It allows for the specific search of proteins depending on the domains they present as well as a domain search through protein sequence or sequence identifier. This database was mainly used to retrieve all the human proteins that present an RA, RBD or PI3K_rbd domain (Table S1). Unknown sequences, fragments and isoforms of proteins already present in the list were filtered out. We used the InterPro (https://www.ebi.ac.uk/interpro/beta/), Pfam (https://pfam.xfam.org/), and PROSITE (https://prosite.expasy.org/) prediction tools in a similar way (Table S1). The same four databases were used to predict the 42 additional domains present in Ras effectors (Table S1).
Protein expression in normal colon tissue
We used the results from a recent high-coverage mass-spectrometry-based study to obtain protein expression values for the Ras proteins and effectors in colon tissue [Citation18]. The protein expression data were provided in units of ‘molecules/cell’. In order to obtain a nano molar (nM) concentration unit from the protein copies per cell values (Table S2), we assumed that the cell volume of an average human cell is 4000 μm3 [Citation80] and the molecules obtained in one mole of a substance (Avogadro number NA) is 6.022 × 10²³ mol-1. Thus, we used the formula
molar = prot copies/(cell vol * NA) = mol/L
that is
nano molar = 109 * prot copies/(cell vol * NA).
Therefore, considering that 4000 μm3 = 4 * 10−12 L, it results:
nano molar = prot copies/(4 * 602.2).
For some proteins no expression was detected by mass spectrometry. In those cases, we calculated the protein levels from mRNA levels reported by Wang and colleagues [Citation18] for the identical tissue using the overall (albeit weak) correlation obtained between mRNA and protein expression [Citation18]. This was done by first matching the Tables EV2 [of 18] (mRNA levels) and EV5 [of 18] (protein levels) on the column ‘Gene names’ and then selection of the subset of data with common gene name. In the case of gene/protein isoforms (i.e. multiple entries for the same gene/protein name), we chose the tissue-specific maximum values, all isoforms confounded. We constructed a linear regression model between gene and protein expression data in log-log plot (only strictly positive values of mRNA in FPKM units and protein copies per cell). We estimated the undetected proteins (with non-null coding gene) by means of the regression line y = a * x + b. Considering that y = Log(Y)and x = Log(X), thus
where X is the mRNA value and Y is the protein copy number.
Classification of 56 effectors into 12 effector classes
In order to classify the 56 effectors into 12 overall effector pathway classes (Table S1), we used the UniProt database (https://www.uniprot.org/), the function of the additional domains present in effectors (obtained from the SMART, Pfam, PROSITE, and InterPro websites and manual searches), surveyed known functions about signalling pathways in colon context (in particular the barrier function [Citation5];), and integrated manual literature searches (see main text) to classify the 56 effectors into 12 overall effector pathway classes (Table S1).
Equilibrium binding model of Ras proteins and effectors
The Ras-effector model consists of 56 reaction schemes, in the format of
where
with R referring to the molar concentration of Ras and E 1, …, E56 to the molar concentration of the 56 effectors in colon tissue.
Following the principles of mass conservation, with
:
the system to solve becomes:
with i = 1, …, 56. This enables us to calculate variables C1, C2, …, C56, which represent the nano molar concentrations of each of the 56 effectors in complex with Ras.
The affinities for each of the 56 effectors (Kd,i) were obtained from (i) either in vitro measured Kd values of Ras proteins in complex with (except for PI3K) the Ras binding domains and not the full lengths effectors (previously published for 18 complexes see Table S3); (ii) or estimated based on in silico 3D structure-based energy predictions [Citation17] (available for 25 Ras effector complexes). Predictions based on Kiel and colleagues [Citation17] were translated into approximated Kd values by assigning the binding free energies from the two sets of template structures (S = short) and (L = long) using the following rules:
‘twilight/twilight’: Kd = 5 μM,
‘twilight’: Kd = 7.5 μM,
‘twilight/non-binding’: Kd = 10 μM,
‘non-binding’: Kd = 20 μM,
Effectors that have been measured in vitro and shown not to bind, were assigned a very low affinity of 50 μM (four effectors). Effectors that have not been tested for binding so far (either in vitro or in silico, were assigned a low affinity value of 39 μM, which correspond to the lowest affinity measured for 17 of the in vitro assessed effectors (nine effectors).
Network simulations in COPASI using ordinary differential equations (ODEs)
The network of Ras with 56 effectors and additional reactions of RAP and RRAS in complex with a set of the 56 effectors was modelled using COPASI software (version 4.27) [Citation81]. Reactions of the model were defined based on reversible mass action (see Table S5). Kd values were converted into kon (forward reaction) and koff (reverse reaction) values following Kd = koff/kon with kon fixed to 1e6 M−1 s−1. Steady state analyses were performed using the concentrations of Ras, RAP, RRAS, and the 56 effectors as initial values.
Gene and protein expression data in 170 patients with colorectal cancer
We used the Human Protein Atlas database (https://www.proteinatlas.org) to obtain mRNA levels (in FPKM units) for 597 colorectal cancer patients. Of those, we selected 170 patients with KRAS mutant-containing cancers, information that was obtained from the COSMIC database (https://cancer.sanger.ac.uk/cosmic) (Table S6). In order to estimate the corresponding protein concentrations (in nM) for those patients, we first obtained the tissue-specific relation between individual mRNA-protein pairs from Wang and colleagues [Citation18] (Table S5). In order to increase the confidence and coverage of the mRNA-protein relation, we obtained mRNA expression levels in colon tissue from another resource, the GTEx consortium (average expression values in FPKM units are provided on the Human Protein Atlas database; see also Table S5). FPKM values from Wang and colleagues [Citation18] and the GTEx consortium in normal colon tissue generally agreed well (Table S6). A protein-specific factor was obtained by dividing the protein level in nM by the average mRNA level of Wang/GTEx. This factor was used to calculate the protein levels of the effectors and Ras proteins using the TCGA mRNA (in FPKM values) of the 170 individual CRC patients (Table S6).
Supplemental Material
Download MS Excel (368.1 KB)Supplemental Material
Download MS Excel (69.8 KB)Supplemental Material
Download MS Excel (23.1 KB)Supplemental Material
Download MS Excel (13.1 KB)Supplemental Material
Download MS Excel (11.2 KB)Supplemental Material
Download MS Excel (29.2 KB)Supplemental Material
Download PDF (285.9 KB)Acknowledgments
We would like to thank Miriam Caffarini, Cian D’Arcy, and Philipp Junk for helpful discussions and critical comments on the manuscript.
Disclosure statement
No potential conflict of interest was reported by the authors.
Supplementary Material
The supplementary data for this article can be accessed here.
Additional information
Funding
References
- Allaire JM, Crowley SM, Law HT, et al. The intestinal epithelium: central coordinator of mucosal immunity. Trends Immunol. 2019 Feb;40(2):174.
- Colicelli J. Human RAS superfamily proteins and related GTPases. Sci STKE. 2004 Sept 7;2004(250):RE13.
- Nakhaei-Rad S, Haghighi F, Nouri P, et al. Structural fingerprints, interactions, and signaling networks of RAS family proteins beyond RAS isoforms. Crit Rev Biochem Mol Biol. 2018 Apr;53(2):130–156.
- Waters AM, Der CJ. KRAS: the critical driver and therapeutic target for pancreatic cancer. Cold Spring Harb Perspect Med. 2018 Sept 4;8(9):pii: a031435.
- Citalán-Madrid AF, García-Ponce A, Vargas-Robles H, et al. Small GTPases of the Ras superfamily regulate intestinal epithelial homeostasis and barrier function via common and unique mechanisms. Tissue Barriers. 2013 Dec 1;1(5):e26938.
- Vetter IR, Wittinghofer A. The guanine nucleotide-binding switch in three dimensions. Science. 2001 Nov 9;294(5545):1299–1304.
- Simanshu DK, Nissley DV, McCormick F. RAS proteins and their regulators in human disease. Cell. 2017 June 29;170(1):17–33.
- Kim HS, Heo JS, Lee J, et al. The impact of KRAS mutations on prognosis in surgically resected colorectal cancer patients with liver and lung metastases: a retrospective analysis. BMC Cancer. 2016 Feb;18(16):120.
- Simon K. Colorectal cancer development and advances in screening. Clin Interv Aging. 2016 July;19(11):967–976.
- Engin HB, Carlin D, Pratt D, et al. Modeling of RAS complexes supports roles in cancer for less studied partners. BMC Biophys. 2017 Aug 11;10(Suppl 1):5.
- Huang L, Hofer F, Martin GS, et al. Structural basis for the interaction of Ras with RalGDS. Nat Struct Biol. 1998 June;5(6):422–426.
- Kiel C, Serrano L. The ubiquitin domain superfold: structure-based sequence alignments and characterization of binding epitopes. J Mol Biol. 2006 Jan 27;355(4):821–844.
- Wohlgemuth S, Kiel C, Krämer A, et al. Recognizing and defining true Ras binding domains I: biochemical analysis. J Mol Biol. 2005 May 6;348(3):741–758.
- Kiel C, Wohlgemuth S, Rousseau F, et al. Recognizing and defining true Ras binding domains II: in silico prediction based on homology modelling and energy calculations. J Mol Biol. 2005 May 6;348(3):759–775.
- Kiel C, Verschueren E, Yang JS, et al. Integration of protein abundance and structure data reveals competition in the ErbB signaling network. Sci Signal. 2013 Dec 17;6(306):ra109.
- Romano D, Nguyen LK, Matallanas D, et al. Protein interaction switches coordinate Raf-1 and MST2/Hippo signalling. Nat Cell Biol. 2014 July;16(7):673–684.
- Kiel C, Foglierini M, Kuemmerer N, et al. A genome-wide Ras-effector interaction network. J Mol Biol. 2007 July 27;370(5):1020–1032.
- Wang D, Eraslan B, Wieland T, et al. A deep proteome and transcriptome abundance atlas of 29 healthy human tissues. Mol Syst Biol. 2019 Feb 18;15(2):e8503.
- Spit M, Koo BK, Maurice MM. Tales from the crypt: intestinal niche signals in tissue renewal, plasticity and cancer. Open Biol. 2018 Sept 12;8(9):pii: 180120.
- Gauthier R, Harnois C, Drolet JF, et al. Human intestinal epithelial cell survival: differentiation state-specific control mechanisms. Am J Physiol Cell Physiol. 2001 June;280(6):C1540–54.
- Johansson J, Naszai M, Hodder MC, et al. RAL GTPases drive intestinal stem cell function and regeneration through internalization of WNT signalosomes. Cell Stem Cell. 2019 Apr 4;24(4):592–607.e7.
- Garcia MA, Nelson WJ, Chavez N. Cell-cell junctions organize structural and signaling networks. Cold Spring Harb Perspect Biol. 2018 Apr 2;10(4):a029181.
- Wakita M, Edamatsu H, Li M, et al. Phospholipase Cϵ activates nuclear factor-κB signaling by causing cytoplasmic localization of ribosomal s6 kinase and facilitating its phosphorylation of inhibitor κB in colon epithelial cells. J Biol Chem. 2016 June 10;291(24):12586–12600.
- Danielsen SA, Cekaite L, Ågesen TH, et al. Phospholipase C isozymes are deregulated in colorectal cancer–insights gained from gene set enrichment analysis of the transcriptome. PLoS One. 2011;6(9):e24419.
- Das S, Yu S, Sakamori R, et al. Rab8a vesicles regulate Wnt ligand delivery and Paneth cell maturation at the intestinal stem cell niche. Development. 2015 June 15;142(12):2147–2162.
- Popoff MR, Geny B. Multifaceted role of Rho, Rac, Cdc42 and Ras in intercellular junctions, lessons from toxins. Biochim Biophys Acta. 2009 Apr;1788(4):797–812.
- Chan JJ, Flatters D, Rodrigues-Lima F, et al. Comparative analysis of interactions of RASSF1-10. Adv Biol Regul. 2013 May;53(2):190–201.
- Hong AW, Meng Z, Guan KL. The Hippo pathway in intestinal regeneration and disease. Nat Rev Gastroenterol Hepatol. 2016 June;13(6):324–337.
- Kooistra MR, Dubé N, Bos JL. Rap1: a key regulator in cell-cell junction formation. J Cell Sci. 2007 Jan 1;120(Pt 1):17–22.
- Omelchenko T, Hall A. Myosin-IXA regulates collective epithelial cell migration by targeting RhoGAP activity to cell-cell junctions. Curr Biol. 2012 Feb 21;22(4):278–288.
- Gerber KJ, Squires KE, Hepler JR. 14-3-3γ binds regulator of G protein signaling 14 (RGS14) at distinct sites to inhibit the RGS14: Gαi-AlF4-signaling complex and RGS14 nuclear localization. J Biol Chem. 2018 Sept 21;293(38):14616–14631.
- Szklarczyk D, Gable AL, Lyon D, et al. STRING v11: protein-protein association networks with increased coverage, supporting functional discovery in genome-wide experimental datasets. Nucleic Acids Res. 2019 Jan 8;47(D1):D607–D613.
- Shen TL 1, Guan JL. . Grb7 in intracellular signaling and its role in cell regulation. Front Biosci. 2004 Jan 1;9:192–200.
- Islam S, Loizides AM, Fialkovich JJ, et al. Developmental expression of Eph and ephrin family genes in mammalian small intestine. Dig Dis Sci. 2010 Sept;55(9):2478–2488.
- Beumer J, Clevers H. Regulation and plasticity of intestinal stem cells during homeostasis and regeneration. Development. 2016 Oct 15;143(20):3639–3649.
- Han DC, Guan JL. Association of focal adhesion kinase with Grb7 and its role in cell migration. J Biol Chem. 1999 Aug 20;274(34):24425–24430.
- Smith MJ, Ikura M. Integrated RAS signaling defined by parallel NMR detection of effectors and regulators. Nat Chem Biol. 2014 Mar;10(3):223–230.
- Rudolph MG, Linnemann T, Grunewald P, et al. Thermodynamics of Ras/effector and Cdc42/effector interactions probed by isothermal titration calorimetry. J Biol Chem. 2001 June 29;276(26):23914–23921.
- Pacold ME, Suire S, Perisic O, et al. Crystal structure and functional analysis of Ras binding to its effector phosphoinositide 3-kinase gamma. Cell. 2000 Dec 8;103(6):931–943.
- Esser D, Bauer B, Wolthuis RM, et al. Structure determination of the Ras-binding domain of the Ral-specific guanine nucleotide exchange factor Rlf. Biochemistry. 1998 Sept 29;37(39):13453–13462.
- Gulbins E, Coggeshall KM, Langlet C, et al. Activation of Ras in vitro and in intact fibroblasts by the Vav guanine nucleotide exchange protein. Mol Cell Biol. 1994 Feb;14(2):906–913.
- Raaijmakers JH, Bos JL. Specificity in Ras and Rap signaling. J Biol Chem. 2009 Apr 24;284(17):10995–10999.
- Schmick M, Kraemer A, Bastiaens PI. Ras moves to stay in place. Trends Cell Biol. 2015 Apr;25(4):190–197.
- Kholodenko BN, Hoek JB, Westerhoff HV. Why cytoplasmic signalling proteins should be recruited to cell membranes. Trends Cell Biol. 2000 May;10(5):173–178.
- Li S, Jang H, Zhang J1, et al. Raf-1 cysteine-rich domain increases the affinity of K-Ras/Raf at the membrane, promoting MAPK signaling. Structure. 2018 Mar 6;26(3):513–525.e2.
- Li ZL, Prakash P, Buck M. A “Tug of War” maintains a dynamic protein-membrane complex: molecular dynamics simulations of C-Raf RBD-CRD bound to K-Ras4B at an anionic membrane. ACS Cent Sci. 2018 Feb 28;4(2):298–305.
- Hekman M, Hamm H, Villar AV, et al. Associations of B- and C-Raf with cholesterol, phosphatidylserine, and lipid second messengers: preferential binding of Raf to artificial lipid rafts. J Biol Chem. 2002 July 5;277(27):24090–24102.
- Pakiet A, Kobiela J, Stepnowski P, et al. Changes in lipids composition and metabolism in colorectal cancer: a review. Lipids Health Dis. 2019 Jan 26;18(1):29.
- García-Barros M, Coant N, Truman JP, et al. Sphingolipids in colon cancer. Biochim Biophys Acta. 2014 May;1841(5):773–782.
- Chen KE, Tillu VA, Chandra M, et al. Molecular basis for membrane recruitment by the PX and C2 domains of class II phosphoinositide 3-kinase-C2α. Structure. 2018 Dec 4;26(12):1612–1625.e4.
- Hamada T, Nowak JA, Ogino S. PIK3CA mutation and colorectal cancer precision medicine. Oncotarget. 2017 Apr 4;8(14):22305–22306.
- Fujiwara Y, Goda N, Tamashiro T, et al. Crystal structure of afadin PDZ domain-nectin-3 complex shows the structural plasticity of the ligand-binding site. Protein Sci. 2015 Mar;24(3):376–385.
- Paschos KA, Canovas D, Bird NC. The role of cell adhesion molecules in the progression of colorectal cancer and the development of liver metastasis. Cell Signal. 2009 May;21(5):665–674.
- Fukami K. Structure, regulation, and function of phospholipase C isozymes. J Biochem. 2002 Mar;131(3):293–299.
- Kelley GG, Reks SE, Ondrako JM, et al. Phospholipase C(epsilon): a novel Ras effector. Embo J. 2001 Feb 15;20(4):743–754.
- Jones RB, Gordus A, Krall JA, et al. A quantitative protein interaction network for the ErbB receptors using protein microarrays. Nature. 2006 Jan 12;439(7073):168–174.
- Krasinskas AM. EGFR signaling in colorectal carcinoma. Patholog Res Int. 2011;2011:932932.
- Shepherd TR, Hard RL, Murray AM, et al. Distinct ligand specificity of the Tiam1 and Tiam2 PDZ domains. Biochemistry. 2011 Mar 1;50(8):1296–1308.
- Cash JN, Davis EM, Tesmer JJG. Structural and biochemical characterization of the catalytic core of the metastatic factor P-Rex1 and Its regulation by PtdIns(3,4,5)P3. Structure. 2016 May 3;24(5):730–740.
- Yamauchi J, Miyamoto Y, Tanoue A, et al. Ras activation of a Rac1 exchange factor, Tiam1, mediates neurotrophin-3-induced Schwann cell migration. Proc Natl Acad Sci U S A. 2005 Oct 11;102(41):14889–14894.
- Foley CJ, Freedman H, Choo SL, et al. Dynamics of RASSF1A/MOAP-1 association with death receptors. Mol Cell Biol. 2008 July;28(14):4520–4535.
- Guo XX, An S, Yang Y, et al. Rap-interacting proteins are key players in the Rap symphony orchestra. Cell Physiol Biochem. 2016;39(1):137–156.
- Consonni SV, Gloerich M, Spanjaard E, et al. cAMP regulates DEP domain-mediated binding of the guanine nucleotide exchange factor Epac1 to phosphatidic acid at the plasma membrane. Proc Natl Acad Sci U S A. 2012 Mar 6;109(10):3814–3819.
- Snow BE, Hall RA, Krumins AM, et al. GTPase activating specificity of RGS12 and binding specificity of an alternatively spliced PDZ (PSD-95/Dlg/ZO-1) domain. J Biol Chem. 1998 July 10;273(28):17749–17755.
- Zhao J, Ou B, Feng H, et al. Overexpression of CXCR2 predicts poor prognosis in patients with colorectal cancer. Oncotarget. 2017 Apr 25;8(17):28442–28454.
- Cabrero-de Las Heras S, Martínez-Balibrea E. CXC family of chemokines as prognostic or predictive biomarkers and possible drug targets in colorectal cancer. World J Gastroenterol. 2018 Nov 14;24(42):4738–4749.
- Depetris RS, Wu J, Hubbard SR. Structural and functional studies of the Ras-associating and pleckstrin-homology domains of Grb10 and Grb14. Nat Struct Mol Biol. 2009 Aug;16(8):833–839.
- Berg EL. Systems biology in drug discovery and development. Drug Discov Today. 2014 Feb;19(2):113–125.
- Liu Y, Beyer A, Aebersold R. On the dependency of cellular protein levels on mRNA abundance. Cell. 2016 Apr 21;165(3):535–550.
- Weinstein JN, Collisson EA, Mills GB, et al. Cancer genome atlas research network, the cancer genome atlas pan-cancer analysis project. Nat Genet. 2013 Oct;45(10):1113–1120.
- Lonsdale J, Thomas J, Salvatore M. GTEx consortium. The genotype-tissue expression (GTEx) project. Nat Genet. 2013 June;45(6):580–585.
- Muñoz-Maldonado C, Zimmer Y, Medová M. A comparative analysis of individual RAS mutations in cancer biology. Front Oncol. 2019 Oct;18(9):1088.
- Hurley JH, Misra S. Signaling and subcellular targeting by membrane-binding domains. Annu Rev Biophys Biomol Struct. 2000;29:49–79.
- Sampaio JL, Gerl MJ, Klose C, et al. Membrane lipidome of an epithelial cell line. Proc Natl Acad Sci U S A. 2011 Feb 1;108(5):1903–1907.
- Jensen JK, Dolmer K, Schar C, et al. Receptor-associated protein (RAP) has two high-affinity binding sites for the low-density lipoprotein receptor-related protein (LRP): consequences for the chaperone functions of RAP. Biochem J. 2009 June 26;421(2):273–282.
- van Boxel-dezaire AH, Rani MR, Stark GR. Complex modulation of cell type-specific signaling in response to type I interferons. Immunity. 2006 Sept;25(3):361–372.
- Miller-Jensen K, Janes KA, Brugge JS, et al. Common effector processing mediates cell-specific responses to stimuli. Nature. 2007 Aug 2;448(7153):604–608.
- Kiel C, Serrano L. Cell type-specific importance of ras-c-raf complex association rate constants for MAPK signaling. Sci Signal. 2009 July 28;2(81):ra38.
- Uhlén M, Fagerberg L, Hallström BM, et al. Tissue-based map of the human proteome. Science. 2015;347(6220):1260419.
- Milo R. What is the total number of protein molecules per cell volume? A call to rethink some published values. Bioessays. 2013 Dec;35(12):1050–1055.
- Hoops S, Sahle S, Gauges R, et al. COPASI–a complex pathway simulator. Bioinformatics. 2006 Dec 15;22(24):3067–3074.