
ABSTRACT
The 3T3-L1 cell line is used as an adipocyte differentiation model for the analysis of genes specifically expressed during the differentiation course. This cell model has several applications in obesity and insulin resistance research. We built a data resource to model gene expression of differentiating and mature adipocytes in response to several drugs and gene manipulations. We surveyed the literature survey for microarray datasets of differentiating 3T3-L1 cell line sampled at one or more time points under genetic or pharmacological perturbations. Data and metadata were obtained from the gene expression omnibus. The metadata were manually curated using unified language across the studies. Probe intensities were mapped and collapsed to genes using a reproducible pipeline. Samples were classified into none, genetically or pharmacologically modified. In addition to the clean datasets, two aggregated sets were further homogenized for illustration purposes. The curated datasets are available as an R/Bioconductor experimental data package curatedAdipoArray. The package documents the source code of the data collection, curation and processing. Finally, we used a subset of the data to effectively remove batch effects and reproduce biological observations.
Database URL
Background & summary
Adipocytes specialize in storing lipids and triglycerides, therefore they are the primary focus in obesity and diabetes research. To study adipocytes in vitro, researchers leverage the potential of pre-adipocytes such as 3T3-L1 to differentiate into adipocytes by chemical induction [Citation1]. This cell model was successfully used to study lipid synthesis, white vs brown adipose tissue development, insulin-sensitizing drug action [Citation2–4]. Pre-adipocytes execute a well-defined transcriptional programme upon induction that culminates in the accumulation of lipids droplets [Citation1,Citation5]. Transcription factors and co-factors drive the adipocyte differentiation process by inducing the expression of several genes necessary to not only control adipogenesis but also the lipid synthesis and storage. Chromatin immunoprecipitation followed by sequencing (ChIP-Seq) helps to identify the role of transcription factors in the process. Similarly, profiling by microarrays and RNA sequencing (RNA-Seq) facilitates studying the changes in gene expression during the development of the adipocyte phenotype. Over the years, datasets of varying sizes have been generated using different protocols and platforms.
Data repositories such as gene expression omnibus (GEO) and sequence read archive (SRA) provide data in raw and processed forms [Citation6,Citation7]. The diversity of these datasets hinders their reuse by other researchers as it requires significant investment in collecting and processing data. Compiling resources dedicated to the study of particular models may alleviate these difficulties [Citation8]. Careful curation of the metadata and processing the data in standard pipelines increase the utility of the available data. This would allow combining, comparing and integrating data from different studies or types of data. We previously curated two large RNA- and ChIP-Seq datasets for modelling the transcriptional programme of the differentiating adipocyte [Citation9]. Here, we surveyed the literature for microarrays studies using the 3T3-L1 model to study the effect of specific genetic perturbations and chemical compounds on the differentiation course and the behaviour of mature adipocytes. Relevant metadata were manually curated using unified language across the studies, and processed data were made available in a user-friendly format.
In this article, we document the curation process and provide a descriptive analysis of a subset of the data for technical validation. We first describe the induction and perturbation of the pre-adipocyte cell line model. Then, we state the search strategy and the inclusion criteria of the studies. Next, we present the steps and the tools for obtaining and processing the datasets. Finally, using a subset of the data, we perform an analysis for technical validation. We used dimension reduction to evaluate the removal of batch effects and to categorize samples into biologically meaningful groups. We also studied the expression of known adipogenic markers and their expected patterns under peroxisome proliferator-activated receptor gamma (Pparg)-knockdown. Together, the documentation and the descriptive analysis provide an assessment for the validity of the model and the appropriateness of the curation process.
Materials & methods
3T3-L1 differentiation & perturbation
3T3-L1 pre-adipocytes differentiate into mature adipocytes when induced with special chemical cocktails [Citation1]. Most studies used a variant containing 1-Methyl-3-isobutylxanthine, Dexamethasone and Insulin (MDI). Fully confluent pre-adipocytes cultures were treated with MDI at day 0, and the media was supplemented with insulin at two-day intervals. Lipid accumulation indicates the progress of differentiation which is usually completed after day 7. The cell cultures were perturbed either before or after the treatment of MDI. Chemical perturbation included synthetic drugs or natural compounds. Genetic perturbation involved the knockdown or the over-expression of key genes. Cell cultures were sampled at one or more time points to isolate RNA for hybridization.
Data collection & acquisition
We surveyed the literature for ‘3T3-L1’ ‘microarray’ studies. The inclusion criteria were MDI-induced, 3T3-L1, microarray studies with, or without perturbation. Forty-seven public datasets from 43 published studies were found. Datasets and related articles were manually examined for complete metadata and annotations. Six datasets were excluded for missing probe intensities or annotations. The remaining 41 public datasets were retrieved from GEO using GEOquery [Citation10]. A metadata table was created for each study to hold the study and sample-level information. These included: public repository identifiers; differentiation status and time; treatment type, target, does and duration.
Data processing & packaging
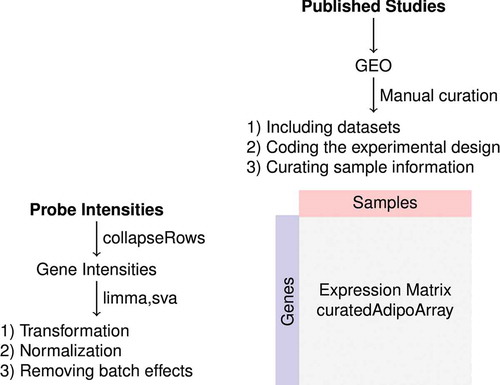
Probes were mapped to unique gene symbols. When multiple probes were linked to a single gene, the probe intensities were collapsed to the ‘MaxMean’ using collapseRows [Citation11]. The probe intensities and the sample metadata from each dataset were packaged in R/Bioconductor SummarizedExperiment objects separately [Citation12,Citation13]. The objects were merged into two datasets based on the type of perturbations; pharmacological or genetic. Probes with low intensities (<10) or missing data were removed. The intensities were log2-transformed and normalized so they would have similar distributions across arrays using limma [Citation14]. Batch (study of origin) removal procedure was applied using parametric empirical Bayes adjustment (sva) [Citation15,Citation16]. The aggregated datasets were packaged into separate SummarizedExperiment objects and distributed as an R/Bioconductor package (curatedAdipoArray). represents a summary of the data collection, curation and processing.
Figure 1. Diagram of the data curation and processing. Metadata were obtained from gene expression omnibus (GEO) and the original articles. Studies were examined and filtered for the details of complete experimental design. Sample information was curated using a unified language across studies. Probe intensities were obtained from GEO, mapped and collapsed to genes. Expression data were log2-transformed and normalized, and batch effects were removed. The curated metadata and the expression matrix were packaged in a R/Bioconductor experiment data package (curatedAdipoArray)
Methods of technical validation
Generating Pparg-knockdown adipocytes
To illustrate the utility of the curated dataset, we used data from two of the curated studies to show they reflect true adipocyte biology and could be used to extract relevant knowledge after removal of batch effects. The two datasets were constructed by knocking down the peroxisome proliferator-activated receptor gamma (Pparg) in the 3T3-L1 pre-adipocytes [Citation17,Citation18]. Cells were transfected with Pparg siRNA using lipofectamine or electroporation. Transfected cells were subjected to the standard adipocyte differentiation protocol with MDI as described above. Mature adipocytes were collected around day 7 and hybridized to microarrays.
Removing batch effects
Data were obtained from two independent studies (GSE12929; n = 48) and (GSE14004; n = 9) [Citation17,Citation18]. Probes were mapped to genes, and the intensities were collapsed, filtered, transformed and normalized as described earlier. The known batch (study of origin) was removed using parametric empirical Bayes adjustment [Citation15]. Dimension reduction using principal component analysis (PCA) was applied before and after the removal of batch effects.
Differential expression analysis
Gene expression in Pparg-knockdown cells (n = 27) was compared to control cells (n = 30) using limma [Citation14]. Fold-change, p-value and false discovery rate (FDR) were calculated for each gene. A list of PPARG targets was obtained from [Citation19]. Forty-eight genes were previously identified and experimentally validated as targets for the transcription factor in mouse adipocytes. Twenty-nine of those genes were found in the dataset.
Gene set enrichment analysis
Differentially expressed genes were ranked based on the fold-change. A list of gene ontology (GO) terms and their mouse gene symbols was prepared using Org.Mm.db.eg and GO.db [Citation20,Citation21]. Gene set enrichment analysis (GSEA) was applied to the list of genes using clusterProfiler [Citation22,Citation23]. Enrichment score (shift towards either end of the ranked list) and p-values were calculated for each term to indicate significance. Five relevant GO terms were identified and their results visualized: brown fat cell differentiation (GO:0050873), positive regulation of fat cell differentiation (GO:0045600), response to lipid (GO:0033993), nuclear receptor transcription coactivator activity (GO:0030374) and fatty acid oxidation (GO:0019395).
Software environment & code availability
The curated datasets are available from Bioconductor experimental hub (https://bioconductor.org/packages/curatedAdipoArray/). The scripts for collecting, processing and packaging the datasets are available on GitHub under GPL-3 licence (https://github.com/MahShaaban/curatedAdipoArray). The code for performing the technical validation is available on (https://github.com/BCMSLab/curated_perturbed_describtor). The software environment where the code was executed is available as a docker image (https://hub.docker.com/r/bcmslab/adiporeg_array).
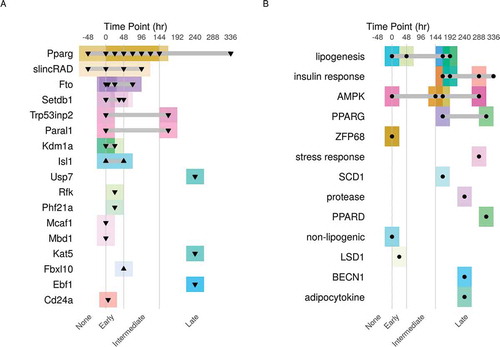
Figure 2. The experimental design of the curated datasets. A schematic description of the experimental design of the MDI-induced 3T3-L1 adipocytes under A) genetic or B) pharmacological perturbations. Each dataset is described by the target of the modification (right), the time point of intervention in hours (top) and the type of modification (▼, knockdown; ▲, overexpression; ● drug treatment). The time course was divided into four stages (0 and before, None; after 0 to 48, Early; after 48 to 144, Intermediate; after 144 hours, Late). Each dataset was represented by a separate colour (box) around the data points
Results & discussion
A summary of the data records
We divided the datasets into two main categories based on the experimental design of each study. summarizes the experimental design of the datasets; cell maturation status and the treatment. First, datasets where the differentiation course was modulated using genetic perturbations either through knocking-down or over-expressing genes (). Second, datasets in which the perturbation was achieved using pharmacological (chemical or natural) compounds (). In addition, three datasets of gene expression from the same model without perturbations were included for reference [Citation24–26].
Table 1. Datasets of genetically modified adipocyte differentiation course. GEO, gene expression omnibus; Ref., reference
Table 2. Datasets of pharmacologically modified adipocyte differentiation course. GEO, gene expression omnibus; Ref., reference
A transcriptional programme drives the differentiation of adipocytes through a series of factors which induce the expression of genes needed for the metabolic and morphological changes ( & )). The most important of these factors is PPARG. By knocking down the gene coding for PPARG in pre-adipocytes, researchers could identify its contribution to the differentiation course. Other aspects of gene regulation such as histone modification were studied by perturbing genes like Setdb1, Kdm1a, Kat5, LSD1 and Phf21a. Genes coding for DNA binding proteins such as Mbd1 and Mcaf1 and non-coding genes such as Paral1 and slincRAD were also studied for their role in controlling gene expression.
To study adipocytes in-vitro, 3T3-L1 pre-adipocytes are induced to differentiate for 7 to 14 days. Researchers use the mature adipocytes to study the behaviour of fat cells in response to certain stimuli ( & )). Adipocytes are specialized in lipid synthesis and storage of excess energy. Several studies used this cell to model insulin responses to drugs such as rosiglitazone, dexamethasone or pioglitazone. All are drugs used to treat diabetes. Similarly, responses to short-chain fatty acids and other lipogenic compounds were investigated. The effect of linoleic acids and metformin on the adipocytes through AMPK was also studied. Finally, the role of adipocytes in creating an inflammatory environment is recognized as harmful and has been studied using asbestos and adipocytokine stimulants.
Stage of differentiation explains the variance between samples after removing batch effects
The study of origin explained the most variance between the samples before removing the batch effects (). Using empirical Bayes adjustment, we were able to remove these effects. Afterwards, the stage of differentiation accounted for more variance (). The first component of the PCA separated the samples before applying the batch removal procedure ()). Growing adipocytes in an induction media cause substantial changes in the gene expression which is captured in three stages of early, intermediate and late differentiation. Stage of differentiation corresponded to the second and the third components and successfully separated the samples after applying the procedure ()). Together, removing the study batch reduced the influence of the unwanted variable and gave a meaningful sample separation.
To combine datasets from different sources is to increase the chances of detecting true signals. Independent datasets can be incorporated in a meta-analysis or merged into a larger dataset. One of the main challenges when combining data is the batch effects. It arises from the discrepancies between the datasets such as the cell origin, reagents and platforms on which the data were generated [Citation15]. As a proof of concept, we used empirical Bayes adjustment to maximize the signal derived from two datasets for further analysis [Citation16].
Pparg-knockdown results in failure of induction of key target genes
The adipogenic transcription factor PPARG is the master regulator of the adipocyte differentiation. PPARG regulates the transcription of key adipogenic and lipogenic genes especially in the intermediate-late stage of differentiation [Citation58]. The knockdown of Pparg would most probably result in the failure of the differentiation/maturation of the induced 3T3-L1 [Citation59]. We selected a subset of the data where Pparg was knocked down in 3T3-L1 pre-adipocytes prior to the MDI-induction. We studied the effect of the knockdown on the differential expression of key targets and gene set enrichment of related-gene ontology terms.
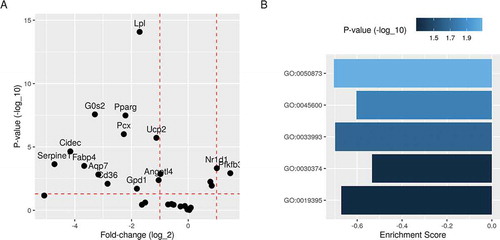
The knockdown of Pparg in the pre-adipocytes resulted in the failure of induction of key gene targets [Citation19]. Most downstream genes from PPARG were down-regulated in the Pparg-knockdown cells compared to the controls ()). These included key fatty acids metabolism and lipid synthesis genes. Lipoprotein lipase (Lpl), cell death-inducing DFFA like effector C (Cidec) and Cd36 were one or more log2 fold less in expression than in controls. These genes have essential functions during the differentiation process. Their down-regulation would likely mean that cells would accumulate less lipid and fail to differentiate into mature adipocytes.
Figure 3. Principal component analysis of differentiating Pparg-knockdown 3T3-L1 pre-adipocytes. Principal component analysis was applied before and after removing batch effects. A) The amount of variance explained and B) the correlation of (study) and (stage) of differentiation with the first three components are shown before and after applying the procedure. C) The first and second principal components are shown. Samples are coloured by the study of origin (red, GSE12929; blue, GSE14004). D) The second and third principal components are shown. Samples are coloured by the stage of differentiation (red, none; green, early; blue, intermediate; magenta, late stage)
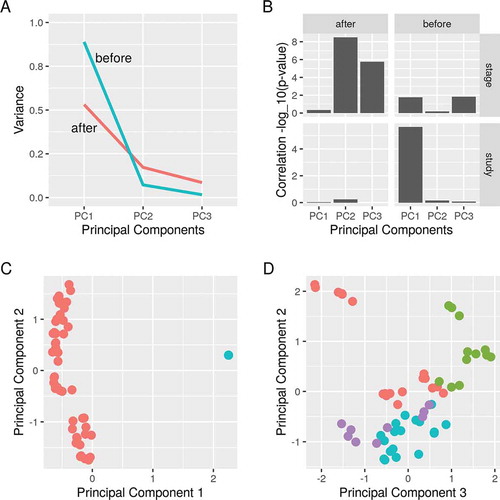
Figure 4. Differential expression and gene set enrichment analysis of differentiating Pparg-knockdown 3T3-L1 pre-adipocytes. Differential expression analysis was applied to the process data to identify regulated genes between Pparg-knockdown and control conditions. A) Fold-change (log2) and p-values (-log10) of previously identified PPARG target genes are shown. B) Differentially expressed genes were ranked by fold-change and used to calculate the enrichment score and p-values of relevant gene ontology terms. Brown fat cell differentiation (GO:0050873); positive regulation of fat cell differentiation (GO:0045600); response to lipid (GO:0033993); fatty acid oxidation (GO:0019395); nuclear receptor transcription coactivator activity (GO:0030374)
Pre-adipocytes fail to mature under the knockdown of key adipogenesis regulators
The effect of Pparg-knockdown can be also evaluated on a gene set level. When the knockdown and control conditions were compared, several key gene ontology terms were significantly enriched ()). For example, two cell differentiation terms – brown fat cell differentiation (GO:0050873) and positive regulation of fat cell differentiation (GO:0045600) – had higher fractions of their gene members down-regulated by the transcription factor Pparg knocking down. Similarly, response to lipid (GO:0033993) and fatty acid oxidation (GO:0019395) were significantly enriched. Finally, nuclear receptor transcription coactivator activity (GO:0030374) is a key molecular function that was enriched during differentiation.
Concluding remarks
We collected two datasets of previously published microarrays examining differentiation of 3T3-L1 under genetic and pharmacological perturbations. The metadata of the studies were curated and the data were processed and homogenized. We analysed a subset of the data where the key adipogenic transcription factor coding gene (Pparg) was knocked down before the induction. We illustrated a method for removing batch effects and generating biologically meaningful results.
Author contributions
MA collected, processed and analysed the data and prepared the manuscript. DSM contributed to editing the manuscript. DRK supervised the study and contributed to writing the manuscript.
Acknowledgments
We thank all the lab members for the critical discussion of the various drafts of this manuscript.
Disclosure statement
The authors declare no competing interests.
Additional information
Funding
References
- Green H, Kehinde O. An established preadipose cell line and its differentiation in culture II. Factors affecting the adipose conversion. Cell. 1975;5(1):19–27.
- Glenn KC, Shieh JJ, Laird DM. Characterization of 3T3-L1 storage lipid metabolism: effect of somatotropin and insulin on specific pathways. Endocrinology. 1992;131:1115–1124.
- Thomson MJ, Williams MG, Frost SC. Development of insulin resistance in 3T3-L1 adipocytes. J Biol Chem. 1997;272:7759–7764.
- Sarjeant K, Stephens JM. Adipogenesis. Cold Spring Harb Perspect Biol. 2012;4(9):a008417.
- Füllgrabe J, Ghislat G, Cho D-H, et al. Transcriptional regulation of mammalian autophagy at a glance. J Cell Sci. 2016;129:3059–3066.
- Edgar R. Gene expression omnibus: NCBI gene expression and hybridization array data repository. Nucleic Acids Res. 2002;30:207–210.
- Leinonen R, Sugawara H, Shumway M. on behalf of the international nucleotide sequence database collaboration. The sequence read archive. Nucleic Acids Res. 2011;39:D19–D21.
- Huang H, Jörgensen C, Stvilia B. Genomics data curation roles, skills and perception of data quality. Lib Inf Sci Res. 2015;37:10–20.
- Ahmed M, Kim DR. Modelling the gene expression and the DNA-binding in the 3T3-L1 differentiating adipocytes. Adipocyte. 2019;8:401–411.
- Davis S, Meltzer PS. GEOquery: A bridge between the gene expression omnibus (GEO) and BioConductor. Bioinformatics. 2007;23(14):1846–1847.
- Langfelder P, Horvath S. WGCNA: an R package for weighted correlation network analysis. BMC Bioinformatics. 2008;9:559.
- R Core Team. R: A language and environment for statistical computing. R Foundation for Statistical Computing; 2017. [access date 2020 September 25]. Available from: https://www.r-project.org/
- Huber W, Carey VJ, Gentleman R, et al. Orchestrating high-throughput genomic analysis with Bioconductor. Nat Methods. 2015;12:115–121.
- Smyth GK. limma: linear models for microarray data. In: Carey GR, Huber VJ, Irizarry W, et al., editors. Bioinformatics and computational biology solutions using R and bioconductor. New York: Springer; 2005. p. 397–420.
- Johnson WE, Li C, Rabinovic A. Adjusting batch effects in microarray expression data using empirical Bayes methods. Biostatistics. 2007;8:118–127.
- Leek JT, Johnson WE, Parker HS, et al. sva: surrogate variable analysis. R Package. 2019. DOI:10.18129/B9.bioc.sva.
- Schupp M, Cristancho AG, Lefterova MI, et al. Re-expression of GATA2 cooperates with peroxisome proliferator-activated receptor-gamma depletion to revert the adipocyte phenotype. J Biol Chem. 2009;284:9458–9464.
- Hamza MS, Pott S, Vega VB, et al. De-novo identification of PPARgamma/RXR binding sites and direct targets during adipogenesis. PLoS One. 2009;4:e4907.
- Fang S, Yu L, Mei H, et al. Cisplatin promotes mesenchymal-like characteristics in osteosarcoma through snail. Oncol Lett. 2016;12:5007–5014.
- Carlson M org.Mm.eg.db: genome wide annotation for human. R package; 2019. doi:10.18129/B9.bioc.org.Mm.eg.db
- Carlson M GO.db: a set of annotation maps describing the entire gene ontology. R package version 3.2.2. R package; 2015. Available from: https://bioconductor.org/packages/release/data/annotation/html/GO.db.html
- Subramanian A, Tamayo P, Mootha VK, et al. Gene set enrichment analysis: a knowledge-based approach for interpreting genome-wide expression profiles. Proc Nat Acad Sci. 2005;102:15545–15550.
- Yu G, Wang L-G, Han Y, et al. clusterProfiler: an R package for comparing biological themes among gene clusters. OMICS. 2012;16:284–287.
- Mikkelsen TS, Xu Z, Zhang X, et al. Comparative epigenomic analysis of murine and human adipogenesis. Cell. 2010;143:156–169.
- Halama A, Horsch M, Kastenmüller G, et al. Metabolic switch during adipogenesis: from branched chain amino acid catabolism to lipid synthesis. Arch Biochem Biophys. 2016;589:93–107.
- Cheung KJ, Tzameli I, Pissios P, et al. Xanthine oxidoreductase is a regulator of adipogenesis and PPARgamma activity. Cell Metab. 2007;5:115–128.
- Smith NC, Swaminathan V, Pallegar NK, et al. CD24 is required for regulating gene expression, but not glucose uptake, during adipogenesis. Adipocyte. 2018;7:248–260.
- Griffin MJ, Zhou Y, Kang S, et al. Early B-cell factor-1 (EBF1) is a key regulator of metabolic and inflammatory signaling pathways in mature adipocytes. J Biol Chem. 2013;288:35925–35939.
- Inagaki T, Iwasaki S, Matsumura Y, et al. The FBXL10/KDM2B scaffolding protein associates with novel polycomb repressive complex-1 to regulate adipogenesis. J Biol Chem. 2015;290:4163–4177.
- Zhang M, Zhang Y. The demethylase activity of FTO (fat mass and obesity associated protein) is required for preadipocyte differentiation. PloS One. 2015;10:e0133788.
- Ma X, Yang P, Kaplan WH, et al. ISL1 regulates peroxisome proliferator-activated receptor activation and early adipogenesis via bone morphogenetic protein 4-dependent and -independent mechanisms. Mol Cell Biol. 2014;34:3607–3617.
- Gao Y, Koppen A, Rakhshandehroo M, et al. Early adipogenesis is regulated through USP7-mediated deubiquitination of the histone acetyltransferase TIP60. Nat Commun. 2013;4:2656.
- Hanzu FA, Musri MM, Sánchez-Herrero A, et al. Histone demethylase KDM1A represses inflammatory gene expression in preadipocytes. Obesity. 2013;21:616–625.
- Hino S, Sakamoto A, Nagaoka K, et al. FAD-dependent lysine-specific demethylase-1 regulates cellular energy expenditure. Nat Commun. 2012;3:758.
- Firmin FF, Oger F, Gheeraert C, et al. The RBM14/CoAA-interacting, long intergenic non-coding RNA Paral1 regulates adipogenesis and coactivates the nuclear receptor PPARγ. Sci Rep. 2017;7:14087.
- Matsumura Y, Nakaki R, Inagaki T, Yoshida A, Kano Y, Kimura H, et al. H3K4/H3K9me3 Bivalent Chromatin Domains Targeted by Lineage-Specific DNA Methylation Pauses Adipocyte Differentiation. Mol Cell. 2015;60: 584–596
- Romero M, Sabaté-Pérez A, Francis VA, et al. TP53INP2 regulates adiposity by activating β-catenin through autophagy-dependent sequestration of GSK3β. Nat Cell Biol. 2018;20:443–454.
- Chew SH, Okazaki Y, Nagai H, et al. Cancer-promoting role of adipocytes in asbestos-induced mesothelial carcinogenesis through dysregulated adipocytokine production. Carcinogenesis. 2014;35:164–172.
- Jiang S, Wang Z, Riethoven -J-J, et al. Conjugated linoleic acid activates AMP-activated protein kinase and reduces adiposity more effectively when used with metformin in mice. J Nutr. 2009;139:2244–2251.
- Jiang S, Chen H, Wang Z, et al. Activated AMPK and prostaglandins are involved in the response to conjugated linoleic acid and are sufficient to cause lipid reductions in adipocytes. J Nutr Biochem. 2011;22:656–664.
- LaRosa PC, Riethoven -J-JM-JM, Chen H, et al. Trans-10, cis-12 conjugated linoleic acid activates the integrated stress response pathway in adipocytes. Physiol Genomics. 2007;31:544–553.
- Wu -T-T-T, Chen -C-C-C, Lin J-T-T, et al. The anti-inflammatory function of adenine occurs through AMPK activation and its downstream transcriptional regulation in THP-1 cells. Biosci Biotechnol Biochem. 2019;84:2220–2229.
- Deng Y, Xu J, Zhang X, et al. Berberine attenuates autophagy in adipocytes by targeting BECN1. Autophagy. 2014;10:1776–1786.
- Hsiao A, Worrall DS, Olefsky JM, et al. Variance-modeled posterior inference of microarray data: detecting gene-expression changes in 3T3-L1 adipocytes. Bioinformatics. 2004;20:3108–3127.
- Rong JX, Klein J-LD, Qiu Y, et al. Rosiglitazone induces mitochondrial biogenesis in differentiated murine 3T3-L1 and C3H/10T1/2 adipocytes. PPAR Res. 2011;2011:179454.
- Yu C-Y-Y, Mayba O, Lee JV, et al. Genome-wide analysis of glucocorticoid receptor binding regions in adipocytes reveal gene network involved in triglyceride homeostasis. PLoS One. 2010;5:e15188.
- Wang P, Renes J, Bouwman F, et al. Absence of an adipogenic effect of rosiglitazone on mature 3T3-L1 adipocytes: increase of lipid catabolism and reduction of adipokine expression. Diabetologia. 2007;50: 654–665.
- Step SE, Lim H-W-W, Marinis JM, et al. Anti-diabetic rosiglitazone remodels the adipocyte transcriptome by redistributing transcription to PPARγ-driven enhancers. Genes Dev. 2014;28:1018–1028.
- Kang S, Tsai LT, Zhou Y, et al. Identification of nuclear hormone receptor pathways causing insulin resistance by transcriptional and epigenomic analysis. Nat Cell Biol. 2015;17:44–56.
- Suzuki R, Tanaka M, Takanashi M, et al. Anthocyanidins-enriched bilberry extracts inhibit 3T3-L1 adipocyte differentiation via the insulin pathway. Nutr Metab. 2011;8:14.
- Shaw B, Lambert S, Wong MHT, et al. Monounsaturated fatty acids trigger distinct transcriptional networks in differentiated 3T3-L1 preadipocytes. J Nutrigenetics Nutrigenomics. 2013;6:1–15.
- Pereira-Fernandes A, Vanparys C, Vergauwen L, et al. Toxicogenomics in the 3T3-L1 cell line, a new approach for screening of obesogenic compounds. Toxicol Sci. 2014;140:352–363.
- Roberts LD, Murray AJ, Menassa D, et al. The contrasting roles of PPARδ and PPARγ in regulating the metabolic switch between oxidation and storage of fats in white adipose tissue. Genome Biol. 2011;12:R75.
- Puhl AC, Milton FA, Cvoro A, et al. Mechanisms of peroxisome proliferator activated receptor γ regulation by non-steroidal anti-inflammatory drugs. Nucl Recept Signal. 2015;13:e004.
- Loonam CR, O’Dell SD, Sharp PA, et al. Microarray analysis reveals altered lipid and glucose metabolism genes in differentiated, ritonavir-treated 3T3-L1 adipocytes. Curr HIV Res. 2016;14:37–46.
- Ralston JC, Badoud F, Cattrysse B, et al. Inhibition of stearoyl-CoA desaturase-1 in differentiating 3T3-L1 preadipocytes upregulates elongase 6 and downregulates genes affecting triacylglycerol synthesis. Int J Obesity. 2014;38:1449–1456.
- Kablan A, Saunders RA, Szkudlarek-Mikho M, et al. Prieurianin causes weight loss in diet-induced obese mice and inhibits adipogenesis in cultured preadipocytes. J Diabetes Metab. 2010;1:1000101.
- Walczak R, Tontonoz P. PPARadigms and PPARadoxes: expanding roles for PPARgamma in the control of lipid metabolism. J Lipid Res. 2002;43:177–186.
- Barak Y, Nelson MC, Ong ES, et al. PPARγ is required for placental, cardiac, and adipose tissue development. Mol Cell. 1999;4:585–595.