
ABSTRACT
Obesity has become a serious global public health problem; a deeper understanding of systemic change of chromatin accessibility during human adipogenesis contributes to conquering obesity and its related diseases. Here, we applied the ATAC-seq method to depict a high-quality genome‐wide time-resolved accessible chromatin atlas during adipogenesis of human adipose-derived stem cells (hASCs). Our data indicated that the chromatin accessibility drastic dynamically reformed during the adipogenesis of hASCs and 8 h may be the critical transition node of adipogenesis chromatin states from commitment phase to determination phase. Moreover, upon adipogenesis, we also found that the chromatin accessibility of regions related to anti-apoptotic, angiogenic and immunoregulatory gradually increased, which is beneficial to maintaining the health of adipose tissue (AT). Finally, the chromatin accessibility changed significantly in intronic regions of peroxisome proliferator‐activated receptor γ during adipogenesis, and these regions were rich in transcription factors binding motifs that were exposed for further regulation. Overall, we systematically analysed the complex change of chromatin accessibility occurring in the early stage of adipogenesis and deepened our understanding of human adipogenesis. Furthermore, we also provided a good reference data resource of genome‐wide chromatin accessibility for future studies on human adipogenesis.
1. Introduction
Obesity has become a severe public health problem worldwide, often accompanied by metabolic disorders and chronic inflammation [Citation1,Citation2]. Patients with obesity are also at higher risk of other diseases, including type 2 diabetes, cardiovascular diseases and certain cancers [Citation3]. Obesity is characterized by excessive accumulation of AT, which can be realized by expanding in adipocyte size (hypertrophy) or forming new adipocytes (hyperplasia). In physiological conditions, the AT plays not only a key regulator of lipid storage and release but also an important endocrine organ secreting many different hormones. In pathophysiological conditions of obesity, excess lipids accumulate in both the visceral depot and the ectopic sites that produce lipotoxicity in these tissues [Citation4]. Along with the AT expansion also accompany hypoxic state, pro-inflammatory state, which become dangerous to health [Citation2]. Clearly, a healthy and well-functional AT is of significant importance for health. The metabolic complications of both too much AT (in obesity) or too little (lipoatrophy/lipodystrophy) are quite similar deleterious. Adipogenesis, the process of adipose-derived stem cells (ASCs) converting into new adipocytes, plays an important role in AT expansion of obesity. Notably, some literature indicates that inhibited or promoted the process of adipogenesis all may contribute to reversing the metabolic disorders of obesity and also may accompany other adverse health effects [Citation5,Citation6]. Adipogenesis is a complex physiological process and many critical questions regarding the regulation of adipogenesis remain unresolved. Therefore, a deeper understanding of adipogenesis and whether adipogenesis confers a benefit to metabolically healthy individuals is meaningful [Citation5].
Adipogenesis is a highly coordinated process that is accompanied by extensive transcriptional reprogramming and controlled by a series of tightly transcriptional regulations [Citation7]. It is necessary for transcription regulation that transcription factors (TFs) interact with the transcriptional regulatory elements; thus, the open chromatin regions are a necessary condition for transcription regulation [Citation8]. Numerous studies have shown that chromatin accessibility plays an essential role in establishing and maintaining cellular identity [Citation9], but little is known about the systemic change of chromatin accessibility during human adipogenesis. A few studies have investigated the chromatin remodelling during adipogenesis on the murine 3T3-L1 cell line, which provides some reference for us to understand human adipogenesis [Citation7,Citation10,Citation11]. Due to the considerable differences in genomic and epigenomic regulation between human and murine, the contribution of the results from the 3T3-L1 adipogenesis model to understanding the process of human adipogenesis remains controversial [Citation12]. Therefore, it is necessary to systematically investigate the dynamic changes of chromatin accessibility during human adipogenesis.
ATAC-seq is an emerging high-throughput sequencing technology that defines and quantifies chromatin accessibility genome-wide by inserting the sequencing adapters into accessible regions of chromatin by Tn5 transposase [Citation13]. Compared with traditional methods, ATAC-seq has become a more helpful tool for studying chromatin remodelling events in multiple biological processes due to its high sensitivity, high resolution and low starting cell number [Citation14]. Here, we depicted a time series genome‐wide accessible chromatin atlas by the ATAC-seq method during adipogenesis of hASCs and discussed the complex changes of chromatin accessibility during adipogenesis of hASCs in detail. Overall, we provided a data resource of genome‐wide chromatin accessibility for future research of human adipogenesis and hoped to deepen our understanding of the chromatin remodelling process during human adipogenesis.
2. Results and discussion
2.1. Mapping the genome‐wide chromatin accessibility landscape during adipogenesis by ATAC-seq
To obtain the dynamic chromatin accessibility atlas during adipogenesis of hASCs, we applied ATAC-seq technology (). All hASCs were derived from ScienCell Research Laboratories and collected after obtaining written informed consent signed by donors. Our previous work showed that during adipogenesis of hASCs, chromatin remodelling occurred twice around the 8-hour point and two main function phases (commitment phase 0 h-8 h, determination phase 24 h-7d) were identified [Citation15]. Therefore, we selected four time points (0 h, 2 h, 8 h and 24 h) in this study, hoping to reflect the complex chromatin accessibility changes from the lineage commitment phase to the terminal differentiation phase during adipogenesis of hASCs.
Figure 1. Experimental methodology overview and data quality control. (a) Experimental outline of chromatin accessibility landscape construction during hASC adipogenesis. (b) The ATAC-seq signal enrichment around the TSSs for each sample. (c) The correlation of ATAC-seq peak reads between two replicates of each time point. (d) The fragment size distribution of ATAC-seq in each sample.
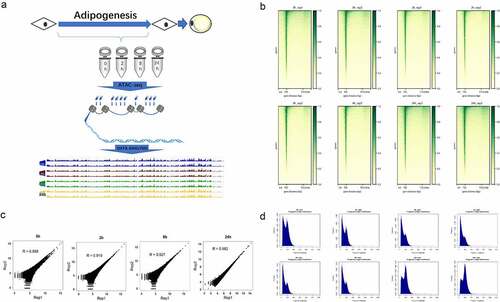
After ATAC-seq data collection, we preliminary evaluated our ATAC-seq data through FastQC and the results showed good data quality. We obtained an average of close to 70 million raw reads for each replicate, which was shown to be sufficient for the subsequent analysis. The observation of strong enrichment of ATAC-seq reads around transcription start sites (TSSs) in all samples () further suggested the successful detection of accessible regions in our result [Citation16]. To further evaluate the reproducibility and robustness of our result, we compared the similarity of open chromatin profiles across samples by Pearson correlation coefficients (). The chromatin accessibility profiles were highly correlated between two replicates (R = 0.88–0.98). Besides, we also investigated the fragment size distributions in each sample. In agreement with typical ATAC-seq profiles [Citation17], the chromatin accessibility fragments show size periodicity corresponding to integer multiples of nucleosomes, and the fragment size distributions between biological replicates were highly correlated (). Overall, all these results above indicated that we obtained high-quality chromatin accessibility data by ATAC-seq and the data was robust and reproducible.
Among assays designed for detecting chromatin accessibility, ATAC-seq since first described in 2013 has gained particular popularity and becoming increasingly common which indicates its value in a wide spectrum of biological questions [Citation18]. ATAC-seq can probe chromatin accessibility states with low cellular input and obtain a higher signal-to-noise ratio in comparison with traditional methods such as DNase, FAIRE or MNase-seq [Citation19]. Despite the advantages, ATAC-seq also has some limitations. One of the limitations is that the classic ATAC-seq method relies on its two barcodes based library construction, which causes a part of the input tagmentation fragments to be lost after PCR amplification [Citation20]. Several single-stranded DNA library preparation methods have already been used to address this issue [Citation21]. A prominent example is SALP, which is overcoming the loss of chromatin accessibility information and achieving library construction simplicity and efficiency by using a novel kind of single-strand adaptor. It is worth noting that SALP is just dependent on two cheap routine enzymes, T4 DNA ligase and Taq polymerase, which greatly increases the usability of the method [Citation22]. In addition, to the applicability limitations of different types of samples and single-cell samples, ATAC-seq-derived technologies generated include fast-ATAC, Omni-ATAC, miniATAC-seq, scATAC-seq (10 × ATAC-seq) and sci-ATAC-seq [Citation23]. ATAC-seq and ATAC-seq-derived technologies wide applications in the future will help us gain a more comprehensive and in-depth understanding of chromatin dynamics and their biological significance.
2.2. The macro-dynamics changes of chromatin accessibility during adipogenesis of hASCs
Next, we globally analysed the dynamic changes of chromatin accessibility during adipogenesis of hASCs. Statistical analysis of accessible chromatin peaks revealed that the number of chromatin accessible peaks gradually increased from 0 h to 8 h and then declined from 8 h to 24 h (). Consistent with this result that our previous work demonstrated, hASCs experienced two chromatin remodelling before and after 8 h point during adipogenesis [Citation15]. Our prior work also showed an obvious phase mode, commitment phase (0 h ~ 8 h) and determination phase (8 h-7d). Thus, we argue that chromatin accessible peaks gradually increased during the commitment phase (0 ~ 8 h) and then declined during the determination phase (after 8 h) at a genome level. Adipogenesis is the process that hASCs lose their developmental plasticity gradually and then take on specialized functions of adipocytes. Compared with hASCs, it seems a smaller number of open chromatin regions were sufficient to maintain adipocyte identity. The same phenomenon was observed in the differentiation of human embryonic stem cells into dopaminergic neurons that open chromatin were regions decreasing [Citation24]. Based on the above results, 8 h may be the critical transition node of adipogenesis chromatin states from the commitment phase to the determination phase.
Figure 2. Overview of chromatin accessibility variation during hASC adipogenesis.
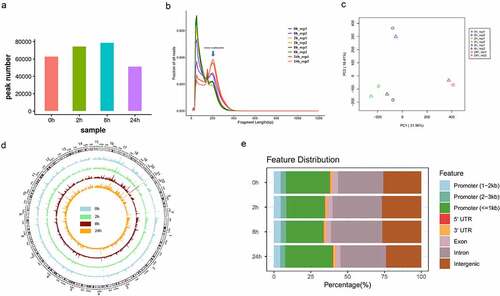
We further merged the fragment size distribution curve between each sample for comparison (). Data showed that the mode of fragment size distribution at 24 h was significantly different from the others and the higher proportion of mono-nucleosome-bound fragment peak means that the chromatin accessibility reduced at 24 h. Principal components analysis (PCA) also exhibited significant differences among different time points (). Moreover, we also visualized genome-wide chromatin accessible peaks among all samples. This circle diagram clearly displayed the radical and global difference of chromatin accessibility between time points (). To annotate the genomic function of accessible chromatin peaks, we used ChIPseeker, a suite of tools for sequencing data analysis. The proportion of intron regions in chromatin accessible regions obviously increased from 0 h to 8 h and reduced from 8 h to 24 h. In contrast, the proportion of promoter regions in chromatin accessible regions reduced from 0 h to 8 h and increased from 8 h to 24 h (). All results above demonstrated that the chromatin accessibility and the proportion of gene function element distribution were changed significantly and dynamically during the early stage of hASC adipogenesis. In addition, the dramatic chromatin accessible change of promoter regions and intron regions suggests the important role of these regions during adipogenesis of hASCs.
2.3. Cluster analysis revealed five distinct chromatin accessibility change modes during adipogenesis of hASCs
To identify the specific dynamic change pattern in the accessible chromatin peaks landscape during adipogenesis of hASCs, we employed TCseq [Citation25]. Within the TCseq framework, we chose C-means Clustering. We identified five specific Clusters with different accessibility change behaviours across the four-point time course (). The variation of peak amplitudes in each cluster reflected transient opening response (Cluster I), late opening response (Cluster II), gradual opening response (Cluster III), gradual closing response (Cluster IV) and late closing response (Cluster V) (). It is noteworthy that Siersbæk et al. mapped extensive chromatin remodelling during early adipogenesis of 3T3L-1 by DNase I Hypersensitive site analysis but obtained an obviously different result as ours. An obvious difference, there were only opening response clusters but no closing response clusters during early adipogenesis (0 h-24 h) in their experiment [Citation11]. This result may reflect the difference in chromatin remodelling between human and mouse adipogenesis models.
Figure 3. Dynamic temporal variation mode of chromatin accessibility during hASC adipogenesis. (a) Five dynamic accessibility behaviour modes of chromatin accessibility data analysis by c-means cluster during adipogenesis. (b) GO analysis of the regions in each cluster by GREAT.
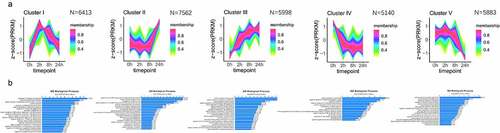
To further identify the characteristics of these clusters, we employed the Gene Ontology (GO) analysis to each cluster by GREAT programme [Citation26] (). In general, in eukaryotic cells, at gene cis-acting elements such as promoters and enhancers, chromatin needs to be in an accessible state for TF binding to activate target gene [Citation27]. However, condensed chromatin always results in gene silencing [Citation8]. Therefore, higher chromatin accessibility means higher transcription activity [Citation28]. As we expected, GO analysis showed that many developments and differentiation-related regions (Cluster II and Cluster III) gradually opened during adipogenesis. Compared to Cluster III, regions related to the terminal differentiation of adipocyte (including signalling pathway of peroxisome proliferator-activated receptor, mitochondrion distribution and cholesterol metabolic [Citation29]) were only enriched in Cluster II. The observation above suggests that the regions related to promoting adipogenic differentiation gradually opened after induced and the region mainly related to terminal differentiation opened after 8 h, which was also consistent with our previous work [Citation15]. Interestingly, many regions related to the regulation of pri-miRNA transcription were also significantly enriched in Cluster II. Many miRNAs have been proved to play regulatory roles in adipogenesis [Citation30]. Our results pointed out that the accessible regions related to the regulation of pri-miRNA may be important in the terminal differentiation of adipogenesis.
Regions in Cluster IV and Cluster V gradually lost accessibility during adipogenesis, and the lower chromatin accessibility means a lower transcription activity. GO analysis showed that many anti-adipogenesis-related regions gradually closed during adipogenesis (Cluster II and Cluster III), as we expected [Citation7]. A typical example was the PKC-related process, which has been widely proven in human and murine [Citation31–33]. The regions related to proliferation, cell differentiation, systems development and cell fate commitment also lost accessibility from 8 h to 24 h and showed that chromatin state trans to terminal differentiation phase after 8 h.29 Interestingly, we found that regions related to negative regulation of the phospholipid metabolic process gradually closed (Cluster IV) and the regions related to positive regulation of organophosphate catabolic process gradually opened (Cluster III). This hinted that ensuring the up-regulation of the phospholipid metabolic process might be important in the early process of adipogenesis.
Different from other clusters, Cluster I was temporarily open. GO analysis showed that the regions in Cluster I were highly enriched in the biological process of cell differentiation regulation. Our result implied that the temporarily opening of the regions in Cluster I might be necessary for adipogenesis of hASCs. For example, the regions related to the regulation of cellular response to platelet-derived growth factor (PDGF) stimulus cytokine secretion were enriched in Cluster I. The PDGF-related process is traditionally recognized as anti-adipogenic. Artemenko et al. found that PDGF directly inhibited murine 3T3‐L1 preadipocyte and human preadipocyte differentiation [Citation34]. Studies also showed that members in PDGFRs were also inhibitors of adipogenesis [Citation35,Citation36]. Interestingly, the stimulus of PDGF also may promote adipogenesis in recent research. PDGF -BB enhances adipogenesis in orbital fibroblasts [Citation37]. Moreover, de novo adipogenesis in Matrigel also demonstrated that PDGF was a potent inducer as important as BFGF in de novo adipogenesis during many candidates [Citation38]. These seemingly contradictory results implied that the short activation of the regions that respond to PDGF stimulus may be necessary for adipogenesis and also supported the potential importance for the temporarily opening of the regions in Cluster I during adipogenesis.
We also found that regions related to the anti-apoptotic process(including negative regulation of extrinsic apoptotic signalling pathway, negative regulation of extrinsic apoptotic signalling pathway in absence of ligand) gradually opened (Cluster III). Apoptosis is an important homoeostatic mechanism controlling adipocytes number, and excessive adipocyte apoptosis appears to be of some concern related to detrimental metabolic effects of fat mass loss that will increase blood lipid concentrations, ectopic lipid storage and other detrimental metabolic effects [Citation39]. Thus, tight control of apoptosis induction is necessary to maintain a healthy AT. The study by Sorisky et al. confirmed that adipocytes acquire a relative resistance to apoptosis as the process of adipogenesis which supports our result [Citation40]. Although several pieces of evidence have shown that the activation extrinsic apoptotic signalling pathway regulates adipogenesis [Citation39], the function of an extrinsic apoptotic signalling pathway in absence of ligand in adipogenesis has not been elucidated. Extrinsic apoptotic in absence of ligand involves a special variety of receptors, called dependence receptors or addiction receptors. Dependence receptors activate apoptotic pathways following the withdrawal of trophic factors and other supportive stimuli [Citation40]. It has been shown that dependence receptors play a major role in organogenesis, but there is no evidence that dependence receptors play a role in adipogenesis. Our result also hinted that the apoptotic process with the participation of dependence receptors might regulate adipogenesis.
It is also worth noting that a large amount regions related to the T cell differentiation and activation were significantly enriched in Cluster I, Cluster II and Cluster III. T cells are the second-largest cell population in AT and are also considered to play an important role in obesity-induced inflammation and metabolic homoeostasis disorder [Citation41]. In the lean state, AT is dominated by anti-inflammatory Th2 and Treg cells, which help to maintain an anti-inflammatory milieu and metabolic homoeostasis. With an excessive nutrient intake and/or reduced energy expenditure, the total number of CD4 + T cells is significantly increased, and the populations of Th2 and Treg cells are decreased, concurrently with increased Th1 and Th17 cells, which led to a state of chronic low-grade inflammation [Citation42]. Hence, strict control of T cell homoeostasis is required to maintain a modest immune response in AT. In our study, pro-inflammation regulation processes (such as positive regulation pro-inflammation T cell differentiation and activation, interleukin-1-mediated signalling pathway [Citation43]) related regions gradually opened (Cluster II and Cluster III). At the same time, anti-inflammation and the immunomodulatoryprocess (such as NK T cell differentiation, interleukin-2 production, transforming growth factor beta production, negative regulation of immune response) related regions gradually opened (Cluster II and Cluster III) [Citation44–46]. The simultaneous opening of anti-inflammatory and pro-inflammatory-related regions suggests that adipogenesis activated the immunoregulatory functions of adipocytes. This might partly explain why new adipogenesis can reverse obesity-associated inflammation [Citation5]. Traditionally, as an endocrine cell, adipocyte can greatly modulate an inflammatory response by secretion of adipokines, cytokines and chemokines [Citation47]. Recent evidence has shown that extensive crosstalk exists between adipocytes and immune cells [Citation42]. Our results support that adipocytes might serve as immune regulatory cells in AT inflammation through modulation of conventional immune regulatory cell types [Citation48]. Furthermore, many regions that were related to the negative regulation of the differentiation and activation of T cell (T-helper cell, CD4-positive T cell and alpha-beta T cell) temporarily open (Cluster I) during the early stage of adipogenesis. Evidence suggests that pro-inflammatory cytokines secreted by T cells inhibit adipogenesis through various pathways [Citation49] which showed that the temporary activation of the regions that negative regulation of T cells differentiation and activation may ensure the smooth adipogenesis process during the early stage of adipogenesis.
The growth of AT requires continuous remodelling of the vascular network which ensures close vascular endothelial cell-adipocyte crosstalk and the dynamic metabolic balance of adipocyte [Citation50]. In our result, many regions related to the angiogenic were significantly enriched in Cluster II, Cluster III and Cluster V. Insufficient vascularization during AT expansion promotes hypoxia causing the release of inflammatory cytokines and chemokines, which may trigger further complications including inflammation, fibrosis and apoptosis, contributing to AT dysfunction [Citation51]. Our result showed that many promotion angiogenesis related regions (Cluster II and Cluster III) gradually opened during adipogenesis, which includes vascular endothelial growth factor and fibroblast growth factor 2 (FGF2) that the most important factor coordinated vessel growth and increased [Citation50]. In addition, many regions related to endothelial cell differentiation gradually lost accessibility during adipogenesis (Cluster V). Evidence that hASCs and pre-adipocytes could direct transdifferentiate into endothelium in the AT [Citation52]; therefore, inhibition of auto-endothelial differentiation is necessary to promote peripheral angiogenesis while ensuring auto-adipogenesis.
2.4. Rich chromatin accessibility variation at PPARG region during adipogenesis of hASCs and abundant TF binding motifs at these variation regions
Adipogenesis is a highly orchestrated process tightly controlled by a complex transcription regulation network. Even though hormones, miRNAs and many other factors can regulate adipogenesis, there is no doubt that TFs are the most important regulator of adipogenesis [Citation7]. TFs need to recognize and bind specific DNA sequences (motif) to control chromatin remodelling and transcription. Open, partially nucleosome-free chromatin regions are much more accessible to be bound by TFs than closed nucleosome-dense regions [Citation53]. Therefore, the accessibility change of the TF binding motifs is important for the regulation of TFs in adipogenesis. We widely scanned the TF binding motifs in the regions of each Cluster using HOMER. Then, we sorted and displayed the motifs of TFs according to the P-value. Many TF binding motifs were located in the variable accessible chromatin regions and almost all the TF binding to these motifs have been reported to play roles in adipogenesis [Citation7] ().
Figure 4. Rich TF binding motifs distribution at chromatin accessibility variation regions of PPARG locus during adipogenesis of hASCs. (a) Enrichment of TF binding motifs for the dynamical variation regions of chromatin during adipogenesis of hASCs. (b) TF binding motifs distribution of chromatin accessibility variation regions of PPARG locus.
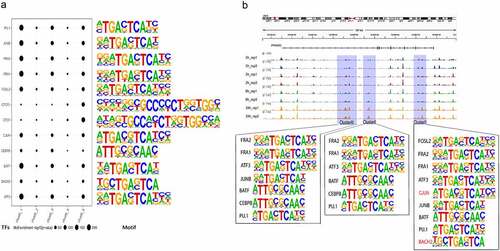
Peroxisome proliferator‐activated receptor γ (PPARG) is widely considered as the most central regulator of adipogenesis that functions have been widely confirmed in in vitro or in vivo investigations [Citation12,Citation54]. Many other TFs regulating adipogenesis also play their roles by directly regulating PPARG [Citation55]. Therefore, we focused on the motif distribution in the various regions of PPARG (). Regions located at PPARG enriched in abundant variable accessible chromatin regions and the change mode of various chromatin accessibility regions at PPARG mainly belong to Cluster II and Cluster III. Abundant TF binding motifs were distributed at these various regions, and many of these TFs had been verified that can play roles in adipogenesis through PPARG [Citation56]. The chromatin accessibility change mode of binding motifs of TFs (including JUNB, FRA1, FRA2, CEBPB, BATF, ATF3 and PU.1) at PPARG belonged to Cluster II and Cluster III. The chromatin accessibility change mode of binding motifs of CJUN and BACH2 at PPARG only belonged to Cluster II. It is worth noting that most of these TF binding motifs were only located in intron regions rather than in exons or promoters of PPARG, which hinted that many TFs might subtly regulate the intron regions of PPARG during the early stage of adipogenesis. Although researchers always used to pay more attention to the TF binding sites in promoter regions. Nevertheless, increasing data show that TF binding sites in the intron also play critical roles in gene regulation [Citation56–59]. The above results indicated that during the early stage of adipogenesis, many nascent accessible chromatin regions gradually appeared in the intron region of PPARG and numerous potential TF binding sites were exposed for further possible regulation.
Besides, TFs in CCAAT-enhancer-binding proteins (CEBPs) family (including CEBPA, CEBPB and CEBPD) also play key roles in adipogenesis [Citation29]. Interestingly, unlike PPARG, there was no significant change in the chromatin accessibility state of CEBPs family. Among them, the regions of CEBPB and CEBPD maintained a high degree of accessibility, but the regions of CEBPA maintained a low degree of accessibility. Maintaining an open state is possibly conducive to the rapid response of CEBPB and CEBPD to the stimulus of adipogenesis [Citation60]. Although CEBPA and PPARG are all playing the most prominent roles in the terminal differentiation phase of adipogenesis [Citation61], the chromatin accessibility variation of PPARG regions is obviously apparent earlier than CEBPA after the stimulus of adipogenesis. This also further reminds the core role of PPARG in the process of human adipogenesis.
In general, we depicted a high-quality chromatin accessibility atlas by ATAC-seq method during adipogenesis of hASCs and systematically illustrated a complex change of chromatin accessibility occurring in the early stage of adipogenesis (0 h-24 h) in this study. We also found that, upon adipogenesis, the chromatin accessibility of regions related to anti-apoptotic, angiogenic and immunoregulatory gradually increased, which is beneficial to maintaining the health of AT and also provides new ideas for the treatment of human pathological obesity. It is worth noting that the chromatin accessibility in many intronic regions of PPARG changed significantly and quickly after adipogenesis induction and these regions were enriched in numerous TF binding motifs. These TF binding motifs were exposed for further regulation in the early stage of adipogenesis and may become novel targets to regulate adipogenesis. Finally, our ATAC-seq data provided a good reference database for future studies on human adipogenesis.
3. Materials and methods
3. 1. Cell culture and differentiation
The hASCs were proliferated in Mesenchymal Stem Cell Growth Media (#HUXMD-90011, Cyagen) and induced differentiation to adipocytes by Adipogenesis Basal Medium (#HUXMD-90031, Cyagen) as described previously [Citation15]. Cells were respectively collected at 0 h, 2 h, 8 h and 24 h after induced adipogenesis. Two biological replicates were conducted for each time point.
3. 2. ATAC-seq sample preparation and data collection
Briefly, we used the Nextera DNA Library Preparation Kit (#FC-121-1031, Illumina) to execute the transposition after cells were harvested and lysed in lysis buffer. The transposed DNA fragments were purified by the MinElute PCR Purification Kit (#28,004, Qiagen). Then, samples were amplified by using 1X NEBNext High-Fidelity PCR Master Mix (#M0541L, New England Biolabs), the subsequent library was purified by the MinElute PCR Purification Kit (#28,004, Qiagen) and subjected to sequencing on Illumina Novaseq 6000 using PE150.
3. 3. Data quality control and preprocessing
Raw data (Fastq files) was processed by FastQC v0.11.8, including the GC content, sequence length distribution, sequence duplication levels, contamination of primers and adapters [Citation18]. The sequencing adaptors and poor-quality reads were detached by Trimmomatic v0.36 with the parameter ‘ILLUMINACLIP:adapter.fa:2:30:10 LEADING:3 TRAILING:3 SLIDINGWINDOW:4:15 MINLEN:36’ [Citation62], clean reads of high quality were obtained and the clean reads were aligned to hg19 reference genome sequences by bwa v0.7.17-r1188 with parameter ‘-v 3’ [Citation63]. Finally, We used MACS2 with parameter ‘macs2 callpeak – nomodel -f BAMPE – keep-dup 1 -q 0.05 -B – SPMR’ [Citation64] for peaks calling (the initial threshold q-value 0.05 as the cut-off value) and the peaks were used in the downstream analyses. The Pearson correlation coefficient (R) between two replicates was calculated by R package and the ATAC-seq signal enriched around the TSSs was handled by Deeptools v 3.5.0 [Citation65].
3. 4. Data analysis
ATAC-seq signal tracks were visualized through Integrative Genomics Viewer (IGV v2.5.0) [Citation66]. The normalized read counts against all merge peaks were used for PCA, and the PCA plot was output by R package. Peaks were annotated by ChIPseeker [Citation67]. The unsupervised Clustering R package, TCseq, was used to investigate temporal patterns of the time course sequencing data, the parameter is algo = ‘cm’, k = 5,standardize = TRUE [Citation25]. GO analysis was performed by GREAT programme [Citation68]. The HOMER’s findMotifsGenome.pl tool was used for motif analysis [Citation68].
3.5 Circos analysis
We displayed the radical and global difference of chromatin accessibility between time points by circos plot with R package circlize(circos.initializeWithIdeogram(species=‘hg19’), circos.trackPlotRegion and circos.trackLines with default parameter).
Acknowledgments
We thank Jiayin Biotechnology Ltd. (Shanghai, China) for the assistance with technical support.
Data Availability Statement
Datasets supporting the conclusions of this article are available in the GEO repository, accession number GSE180903(https://www.ncbi.nlm.nih.gov/geo/query/acc.cgi?acc=GSE180903). All data are available from the authors upon reasonable request.
Disclosure statement
No potential conflict of interest was reported by the author(s).
Additional information
Funding
References
- Gonzalez-Muniesa P, Martinez-Gonzalez MA, Hu FB, et al. Obesity. Nat Rev Dis Primers. 2017;3:17034.
- Sánchez-Muñoz F, El Hafidi M, Buelna-Chontal M, et al. Adipogenesis: a necessary but harmful strategy. Int J Mol Sci. 2019.
- Nyberg ST, Batty GD, Pentti J, et al. Obesity and loss of disease-free years owing to major non-communicable diseases: a multicohort study. The Lancet. 2018;3:e490–e7.
- Hammarstedt A, Gogg S, Hedjazifar S, et al. Impaired adipogenesis and dysfunctional adipose tissue in human hypertrophic obesity. Physiol Rev. 2018;98:1911–1941.
- Ghaben AL, Scherer PE. Adipogenesis and metabolic health. Nat Rev Mol Cell Biol. 2019;20:242–258.
- Naaz A, Holsberger DR, Iwamoto GA, et al. Loss of cyclin‐dependent kinase inhibitors produces adipocyte hyperplasia and obesity. FASEB J Off Publ Fed Am Soc Exp Biol. 2004;18:1925–1927.
- Mota de Sa P, Richard AJ, Hang H, et al. Transcriptional regulation of adipogenesis. Compr Physiol. 2017;7:635–674.
- Sun Y, Miao N, Sun T. Detect accessible chromatin using ATAC-sequencing, from principle to applications. Hereditas. 2019;156:1–9.
- Klemm SL, Shipony Z, Greenleaf WJ. Chromatin accessibility and the regulatory epigenome. Nat Rev Genet. 2019;20:207–220.
- Siersbaek R, Rabiee A, Nielsen R, et al. Transcription factor cooperativity in early adipogenic hotspots and super-enhancers. Cell Rep. 2014;7:1443–1455.
- Siersbæk R, Nielsen R, John S, et al. Extensive chromatin remodelling and establishment of transcription factor ‘hotspots’ during early adipogenesis. The EMBO J. 2011;30:1459–1472.
- Lefterova MI, Haakonsson AK, Lazar MA, et al. PPARγ and the global map of adipogenesis and beyond. Metab. 2014;25:293–302.
- Shashikant T, Ettensohn CA. Genome-wide analysis of chromatin accessibility using ATAC-seq. Methods Cell Biol. 2019;151:219–235.
- Buenrostro JD, Wu B, Chang HY, et al. ATAC‐seq: a method for assaying chromatin accessibility genome‐wide. Curr Protoc Mol Biol. 2015;109:21.9. 1-.9. 9.
- Li S, Xue T, He F, et al. A time-resolved proteomic analysis of transcription factors regulating adipogenesis of human adipose derived stem cells. Biochem Biophys Res Commun. 2019;511:855–861.
- Orchard P, Kyono Y, Hensley J, et al. Quantification, dynamic visualization, and validation of bias in ATAC-seq data with ataqv. Cell Syst. 2020;10:298–306. e4.
- Liu C, Wang M, Wei X, et al. An ATAC-seq atlas of chromatin accessibility in mouse tissues. Sci Data. 2019;6:1–10.
- Yan F, Powell DR, Curtis DJ, et al. From reads to insight: a hitchhiker’s guide to ATAC-seq data analysis. Genome Biol. 2020;21:1–16.
- Chawla A, Nagy C, Turecki G. Chromatin profiling techniques: exploring the chromatin environment and its contributions to complex traits. Int J Mol Sci. 2021;22:7612.
- Tan L, Xing D, Chang C-H, et al. Three-dimensional genome structures of single diploid human cells. Sci (New York, N.Y.). 2018;361:924–928.
- Troll CJ, Kapp J, Rao V, et al. A ligation-based single-stranded library preparation method to analyze cell-free DNA and synthetic oligos. BMC Genomics. 2019;20:1–14.
- Wang J, Dai W, Wu L, et al. SALP, a new single-stranded DNA library preparation method especially useful for the high-throughput characterization of chromatin openness states. Am J Clin Dermatol. 2018;19:1–12.
- Ma S, Zhang Y. Profiling chromatin regulatory landscape: insights into the development of ChIP-seq and ATAC-seq. Mol Biomed. 2020;1:1–13.
- Meléndez-Ramírez C, Cuevas-Diaz Duran R, Barrios-García T, et al. Dynamic landscape of chromatin accessibility and transcriptomic changes during differentiation of human embryonic stem cells into dopaminergic neurons. Sci Rep. 2021;11:1–18.
- Barnett KR, Decato BE, Scott TJ, et al. ATAC-Me captures prolonged DNA methylation of dynamic chromatin accessibility loci during cell fate transitions. Mol Cell. 2020;77:1350–64. e6.
- McLean CY, Bristor D, Hiller M, et al. GREAT improves functional interpretation of cis-regulatory regions. Nat Biotechnol. 2010;28:495–501.
- Pálfy M, Schulze G, Valen E, et al. Chromatin accessibility established by pou5f3, sox19b and nanog primes genes for activity during zebrafish genome activation. PLoS Genet. 2020;16:e1008546.
- Tsompana M, Mj B. Chromatin accessibility: a window into the genome. Epigenet Chromatin. 2014;7:1–16.
- Moseti D, Regassa A, W-k K. Molecular regulation of adipogenesis and potential anti-adipogenic bioactive molecules. Int J Mol Sci. 2016;17:124.
- A Mcgregor R, S Choi M. microRNAs in the regulation of adipogenesis and obesity. Curr Mol Med. 2011;11:304–316.
- Navre M, Ringold GM. A growth factor-repressible gene associated with protein kinase C-mediated inhibition of adipocyte differentiation. J Cell Biol. 1988;107:279–286.
- Zhou Y, Wang D, Li F, et al. Different roles of protein kinase C-βI and-δ in the regulation of adipocyte differentiation. Int J Biochem Cell Biol. 2006;38:2151–2163.
- Lee S, Cho H-Y, Bui HTT, et al. The osteogenic or adipogenic lineage commitment of human mesenchymal stem cells is determined by protein kinase C delta. BMC Cell Biol. 2014;15:1–12.
- Artemenko Y, Gagnon A, Aubin D, et al. Anti‐adipogenic effect of PDGF is reversed by PKC inhibition. J Cell Physiol. 2005;204:646–653.
- Sun C, Sakashita H, Kim J, et al. Mosaic mutant analysis identifies PDGFRα/PDGFRβ as negative regulators of adipogenesis. Stem Cell. 2020;26:707–21. e5.
- Haider N, Dusseault J, Larose L. Nck1 deficiency impairs adipogenesis by activation of PDGFRα in preadipocytes. ISci. 2018;6:22–37.
- Virakul S, Dalm VA, Paridaens D, et al. Platelet-derived growth factor-BB enhances adipogenesis in orbital fibroblasts. Invest Ophthalmol Visual Sci. 2015;56:5457–5464.
- Kawaguchi N, Toriyama K, Nicodemou-Lena E, et al. De novo adipogenesis in mice at the site of injection of basement membrane and basic fibroblast growth factor. Proc Natl Acad Sci USA. 1998;95:1062–1066.
- Herold C, Rennekampff HO, Engeli S. Apoptotic pathways in adipose tissue. Apoptosis Int J Program Cell Death. 2013;18:911–916.
- Sorisky A, Magun R, Gagnon A. Adipose cell apoptosis: death in the energy depot. Int J Obesity Relat Metab Disord J Int Assoc Study Obesity. 2000;24:S3–S7.
- Mraz M, Haluzik M. The role of adipose tissue immune cells in obesity and low-grade inflammation. J Endocrinol. 2014;222:R113–R27.
- Zhou H, F L. Regulation, communication, and functional roles of adipose tissue-resident CD4+ T cells in the control of metabolic homeostasis. Front Immunol. 2018;1961. DOI:10.3389/fimmu.2018.01961
- Dinarello CA. Interleukin-1. Cytokine Growth Factor Rev. 1997;8:253–265.
- Gorelik L, Flavell RA. Transforming growth factor-β in T-cell biology. Nat Rev Immunol. 2002;2:46–53.
- Liao W, Lin J-X, Wang L, et al. Modulation of cytokine receptors by IL-2 broadly regulates differentiation into helper T cell lineages. Nat Immunol. 2011;12:551–559.
- Liu R, Nikolajczyk BS. Tissue immune cells fuel obesity-associated inflammation in adipose tissue and beyond. Front Immunol. 2019;10:1587.
- Nyambuya TM, Dludla PV, Mxinwa V, et al. Obesity-induced inflammation and insulin resistance: a mini-review on T-cells. Metab Open. 2019;3:100015.
- Vielma SA, Klein RL, Levingston CA, et al. Adipocytes as immune regulatory cells. Int Immunopharmacol. 2013;16:224–231.
- Jiang N, Li Y, Shu T, et al. Cytokines and inflammation in adipogenesis: an updated review. Front Med. 2019;13:314–329.
- Ioannidou A, Fisher RM, Hagberg CE. The multifaceted roles of the adipose tissue vasculature. Obesity Rev Off J Int Assoc Stud Obesity. 2021;23:e13403.
- Harvey I, Boudreau A, Stephens JM. Adipose tissue in health and disease. Open Biol. 2020;10:200291.
- Tran K-V, Gealekman O, Frontini A, et al. The vascular endothelium of the adipose tissue gives rise to both white and brown fat cells. Cell Metab. 2012;15:222–229.
- Lambert SA, Jolma A, Campitelli LF, et al. The human transcription factors. Cell. 2018;172:650–665.
- Spiegelman B, Hu E, Kim J, et al. PPARγ and the control of adipogenesis. Biochimie. 1997;79:111–112.
- Lee J-E, Ge K. Transcriptional and epigenetic regulation of PPARγ expression during adipogenesis. Cell Biosci. 2014;4:1–11.
- Rose AB. Introns as gene regulators: a brick on the accelerator. Front Genet. 2019;9:672.
- Haddad-Mashadrizeh A, Hemmat J, Aslamkhan M. Intronic regions of the human coagulation factor VIII gene harboring transcription factor binding sites with a strong bias towards the short-interspersed elements. Heliyon. 2020;6:e04727.
- van Dijk TB, Caldenhoven E, Raaijmakers JA, et al. The role of transcription factor PU. I in the activity of the intronic enhancer of the eosinophil-derived neurotoxin (RNS2) gene. J Am Soc Hematol. 1998;91:2126–2132.
- Cleynen I, Brants JR, Peeters K, et al. HMGA2 regulates transcription of the Imp2 gene via an intronic regulatory element in cooperation with nuclear factor-κB. Mol Cancer Res(MCR). 2007;5:363–372.
- Farmer SR. Transcriptional control of adipocyte formation. Cell Metab. 2006;4:263–273.
- Siersbæk R, Nielsen R, Mandrup S. PPARγ in adipocyte differentiation and metabolism–novel insights from genome-wide studies. FEBS Lett. 2010;584:3242–3249.
- Bolger AM, Lohse M, Usadel B. Trimmomatic: a flexible trimmer for Illumina sequence data. Bioinf (Oxford, England). 2014;30:2114–2120.
- Li H, Durbin R. Fast and accurate short read alignment with Burrows–Wheeler transform. Bioinf (Oxford, England). 2009;25:1754–1760.
- Zhang Y, Liu T, Meyer CA, et al. Model-based analysis of ChIP-Seq (MACS). Genome Biol. 2008;9:1–9.
- Ramírez F, Ryan DP, Grüning B, et al. deepTools2: a next generation web server for deep-sequencing data analysis. Nucleic Acids Res. 2016;44:W160–W5.
- Robinson JT, Thorvaldsdóttir H, Winckler W, et al. Integrative genomics viewer. Nat Biotechnol. 2011;29:24–26.
- Yu G, Wang L-G, Q-y H. ChIPseeker: an R/Bioconductor package for ChIP peak annotation, comparison and visualization. Bioinf (Oxford, England). 2015;31:2382–2383.
- Heinz S, Benner C, Spann N, et al. Simple combinations of lineage-determining transcription factors prime cis-regulatory elements required for macrophage and B cell identities. Mol Cell. 2010;38:576–589.