
 ?Mathematical formulae have been encoded as MathML and are displayed in this HTML version using MathJax in order to improve their display. Uncheck the box to turn MathJax off. This feature requires Javascript. Click on a formula to zoom.
Abstract
The immune microenvironment in follicular lymphoma (FL) plays an important role in controlling disease characteristics. To characterize the T-cell receptor (TCR) repertoire in follicular lymphoma (FL) tissues, we applied a next-generation sequencing platform and deeply sequenced TCR cDNAs of T-cell subset populations present in pretreatment FL biopsy specimens. T regulatory cell (Treg) TCRs in FL tissues revealed a highly oligoclonal expansion compared to those in control lymph nodes. Furthermore, an inverse correlation was observed between the diversity of Treg and CD8+ TCRs in FL specimens. Interestingly, a tumor from an FL patient, who had not received anticancer treatment for more than 10 years, was found to have missense mutations in the peptide-binding domain of both human leukocyte antigen (HLA) class I and II molecules, which might have presented tumor-specific antigens and enhanced host immune responses. Although further verification is required, our data suggest that the T-cell repertoire is skewed and restricted in FL and support the evolving understanding of the microenvironment in this disease.
Introduction
Follicular lymphoma (FL) is the most common indolent non-Hodgkin lymphoma in the Western hemisphere. Approximately 30 000 patients were diagnosed with FL in 2010 (http://seer.cancer.gov/seertools). The hallmark cytogenetic feature of the disease is the t(14;18)(q32:21) chromosomal translocation, resulting in the rearrangement of the bcl-2 gene in proximity to the immunoglobulin heavy-chain promoter. Overexpression of the anti-apoptotic BCL-2 protein in transformed B cells causes their accumulation and ultimately participates in the development of the disease. Although FL is currently considered incurable with standard therapies, the prognosis for most patients is relatively good.Citation1 However, frequent disease relapses are common and are associated with the development of resistance to therapy. In addition, up to one third of patients will experience transformation into a more aggressive disease over time.Citation2 Most patients experience an indolent course, but there is significant heterogeneity in outcomes in FL, and approximately 15% of patients succumb to FL within the first 2 years after diagnosis.Citation2 A number of clinical prognostic scores have been developed, such as The Follicular Lymphoma International Prognostic Index (FLIPI), which accounts for several clinical features of the disease, and accurately stratifies patients into prognostic risk groups over a 5- to 10-year period.Citation3 However, the use of the FLIPI score does not currently dictate treatment decisions for individual patients.
Along with clinical prognostic tools, several groups have focused on identifying microenvironmental features of the disease that may help explain observed clinical heterogeneity in FL. In 2004, a group from the National Cancer Institute carried out gene expression profiling on 181 FL specimens in an attempt to characterize molecular predictors of survival.Citation4 In this seminal work, the authors discovered that the major genetic determinant of FL outcome was linked to the phenotypes of nonmalignant cells in the tumor microenvironment and not the malignant cells themselves. They identified two unique gene expression signatures associated with prognosis, which they termed “immune response 1” and “immune response 2.” The immune response 1 signature was observed in patients with a better prognosis and revealed higher expression levels in genes related to T cells and macrophages, whereas the immune response 2 signature, which was associated with worse prognosis, included genes known to be expressed in macrophages and/or dendritic cells. The presence of macrophage-related genes in both signatures on the surface appears contradictory. However, it is possible that the macrophage signature found in immune response 1 patients may correlate with the presence of macrophages with antitumor functions (i.e., so-called M1 macrophages), and those in the immune response 2 signature may represent macrophages that promote tumor progression (i.e., M2 polarized macrophages). These data suggested that the FL immune microenvironment was important in controlling the behavior of the disease.
In addition to gene expression profiling, a number of clinical and pathological observations have implied a role for the host immune system in regulating FL behavior. First, spontaneous regressions and remissions occur in a small subset of FL patients,Citation5 arguing that active immune surveillance against FL may be effective in controlling the disease in some individuals. Second, long-lasting remissions in some FL patients following tumor-specific anti-idiotype vaccination have been reported in clinical trials, particularly in a subset of patients who mounted a detectable anti-idiotype immune response.Citation6 Third, FL tissues are often highly enriched for T cells and macrophages, and their varied numbers and location within or around the malignant follicles have been correlated with clinical outcomes.Citation7-9 Thus, there is an accumulating body of evidence for clinically significant interplay between FL cells and the surrounding nonmalignant immune cells, although it remains unclear exactly which type of immune microenvironment is clinically favorable.
T cells mediate antitumor immunity in various types of cancer and may also be involved in the immune surveillance of FL, although evidence to support this hypothesis is very limited. T cells, including the CD8+, CD4+, and Treg (CD4+CD25+Foxp3+ cells) subsets, can be identified within and, more commonly, surrounding malignant follicles in FL tissue samples by immunohistochemistry (IHC)Citation8,10, 11; yet, the specificities and the functional relevance of tumor-infiltrating T cells in FL remain unknown. With previously available technologies, it has not been feasible to thoroughly analyze the TCR repertoire present in malignant tissues. However, the advent of next-generation sequencing technologies now allows us to carry out a detailed TCR analysis in cancer tissues.Citation12 Hypothesizing that a sub-fraction of T cells in FL tissues are lymphoma antigen specific and may mediate immune-mediated control of FL progression, we have begun to characterize the TCR repertoire through deep sequencing of TCRα and –β cDNAs of T cells present in pretreatment FL biopsy specimens as well as from control lymph node samples.
Along with immunohistochemical staining for CD4+, CD8+, and Treg cells in FL biopsy specimens, we provide the first report of TCR deep sequencing in FL tissues. Our results demonstrate that strong enrichment of TregTCRs was observed commonly in FL specimens, compared with control lymph nodes. Interestingly, the diversity of TCRs in the Treg population was inversely correlated with that of CD8+ T cells, supporting the antigen-specific immune-regulatory functions of Treg cells and their interplay with CD8+T cells in the FL microenvironment. In addition, we demonstrate that a tumor in 1 FL case, who had not received treatment for more than 10 years, possessed missense mutations at the peptide-binding domains in both HLA class I and II molecules, further supporting the importance of immune surveillance in regulating disease progression, at least in some FL patients.
Results
TCR cDNA Sequencing
Pretreatment lymph node samples from 6 patients diagnosed with FL were analyzed. Three of 6 tumors were histologically classified as grades 1–2 FL and 2 as grade 3a based on the World Health Organization (WHO) 2008 schema. The remaining case revealed variable areas comprised of grades 1–3a FL (Table S1). In all cases, the neoplastic follicles exhibited an immunophenotype typical of FL, with positive staining for the B-cell marker, CD20, with co-expression of the germinal center B-cell markers, CD10, as well as BCL-6 and BCL-2. In order to explore the TCR repertoire in each sample, T cells were separately purified into CD8+, CD4+CD25− and CD4+CD25+ (Treg) subset populations using magnetic separation. cDNAs from each T-cell subset were generated and amplified by PCR as described in the Materials and Methods section, and TCRα and –β cDNAs were sequenced using an IonTorrent PGM platform with a 318v2 chip coupled with a 400-bp sequencing kit as described previously.Citation13 Comprehensive analysis of millions of TCR cDNA sequences was conducted with MiTCR software, an open access tool for T cell receptor sequencing data analysis. The output of TCR sequencing in each T-cell subset is summarized in .
Table 1. Summary of sequencing output of TCR-α and TCR-β
Oligoclonal Enrichment of Treg TCRs in the FL Tumors
For the TCRβ analysis of the Tregsubpopulation, a strong enrichment of clonal TCRβ sequences was observed in all of the 6 samples analyzed, where several TCR-β sequences were extensively enriched. To investigate whether TregTCR enrichment was unique to the FL microenvironment, nonmalignant control lymph node samples (Table S2) were also analyzed. In contrast to the TCR-β sequences of Tregs in FL lymph nodes, those in the control lymph nodes exhibited much less clonal expansion and much higher diversity in sequencing reads. The sum of proportions of the 5 most abundant TCRβ sequences in the Tregrepertoire in FL tissues was 76.24 ± 11.17% (range, 58.4%–89%), compared to 33.15 ± 19.52% (range, 11.07%–48.1%) in control lymph nodes (P = 0.0238) (). These data clearly demonstrate that an oligoclonal TregTCRβ expansion is present in the FL microenvironment.
Figure 1. Clonal diversity of regulatory T cells in FL tissue. (A) All TCRβ sequences were collected to show the individual Tregclonotypic diversity in 6 FL patients compared with 3 controls. Colors present clonal abundance in each subject by percentage of in-frame sequencing counts. The sum of proportions of the 5 most abundant TCRβ sequences is represented by percentage and compared between FL patients and controls using a two-tailed Student's t-test (P = 0.0238); n = clone number by identified TCRβ sequences (in-frame reads). (B) Simpson's Index of Diversity (SID; see text and equation in Materials and Methods) was used to measure Treg TCRβ sequence diversity between FL patients and controls (P = 0.0409).
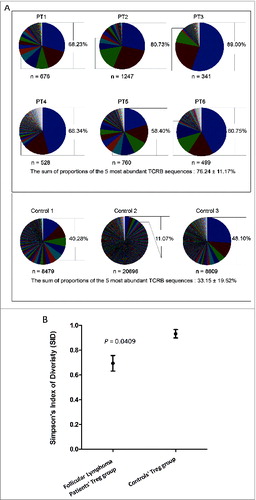
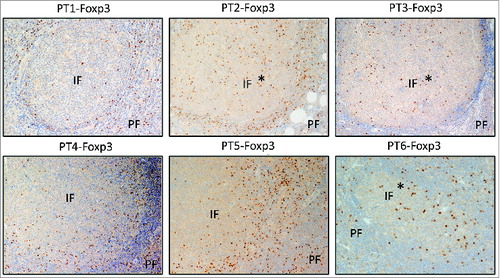
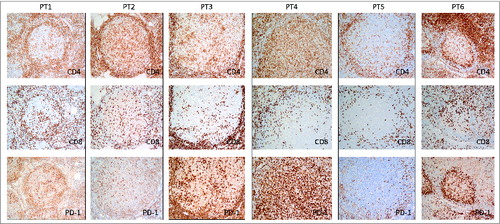
To further analyze the difference between the TregTCRβ repertoire in FL versus control lymph nodes, Simpson's Index of Diversity (SID)—a mathematical parameter to quantify biodiversity in ecological systems—was employed to compare the overall diversity of the Treg TCR repertoire in each sample using its CDR3β profiles as a parameter. SID values range between 0 and 1; a value closer to 0 is indicative of very limited TCR diversity, whereas a value closer to 1 indicates very broad TCR diversity. Compared to controls, TCRβ sequences of the Tregpopulation in FL samples were significantly less diverse (P = 0.0409) (). Along with TCRβ sequencing, an immunohistochemical analysis of Tregs in these 6 FL tissues was also conducted, and demonstrated that Tregs resided both within and around malignant follicles in the 6 cases examined, with some inter-patient variability (). Foxp3+Tregs mostly were in the perifollicular areas, with three cases (patients 2, 3, and 6) exhibiting prominent intrafollicular (denoted with %) localization (). TCRα sequencing of Tregs from FL tissues confirmed the clonal dominancy observed in the TCRβ sequencing analysis. For instance, Patient 4 harbored two abundant Treg-derived TCR sequences of both TCRα and -β that accounted for 39.6% and 26.9% for TCRα as well as 39.7% and 20.3% for TCRβ. Considering their similar frequencies, it is probable that the most abundant TCRα and TCRβ sequences constitute unique TCRs.
Figure 2. Treg localization in FL tissues. Immunohistochemical staining for Foxp3 (dark brown) was done on formalin-fixed, paraffin-embedded lymph nodes of 6 FL patients before treatment. Original magnification ×200. IF, intrafollicular; PE, perifollicular. *denotes 3 cases exhibiting prominent intrafollicular localization.
Correlation Between CD8+ T-Cell Clonal Diversity and Location in FL Tissue
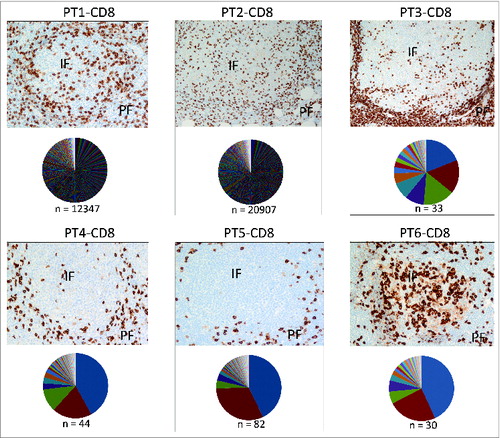
CD8+ T-cell infiltration into tumor tissues has been associated with better prognosis of patients with various types of cancer,Citation14-16 most prominently in the setting of melanoma.Citation17,18 A majority of studies have attempted to correlate numbers of tumor-infiltrating CD8+ T cells with clinical outcome, whereas none have, to our knowledge, analyzed TCR clonotypic diversity in relation to the anatomic location of T cells in FL tissues. In order to investigate whether a correlation between location (perifollicular versus intrafollicular) and the TCR diversity of CD8+ T cells exists in FL tissues, we undertook an immunohistochemical analysis of CD8+ T cells and compared it with CD8+TCRβ sequencing in these 6 FL samples. TCRβ sequencing of FL tissues from patients 1 and 2 revealed a broad diversity of CD8+TCRs, and the CD8+ T cells in these 2 patients were located in both the peri- and intrafollicular areas (). However, in 3 patients (patients 3, 4, and 5), whose tumors revealed a strong clonal TCRβ expansion (), the majority of CD8+ T cells was localized in the perifollicular region. In Patient 6, a unique situation was observed in which a primarily intrafollicular CD8+T-cell distribution pattern was present, but 2 dominant CD8+TCRβ sequences (with frequencies of 44.6% and 25.4%) were identified.
Figure 3. Localization of CD8+T cells and CD8+ TCR repertoire analysis in FL tissues. Immunohistochemical staining for CD8 (top) and TCRβ sequencing results of CD8+T cells (bottom) in pie chart pattern were combined to exhibit the correlation of CD8+ T-cell distribution and clonal diversity in 6 FL individuals. Colors display TCRβ sequences by sequencing counts with hierarchy; n = clone number by identified TCRβ sequences (in-frame reads). The detailed sequencing information of predominant clones in each data set is shown in Table S3. The average percentage of CD8+T cells is 10.47% ± 1.59% in total, with a standard error of 0.0065. Original magnification, ×200 for IHC pictures. IF, intrafollicular; PE, perifollicular.
The distribution of CD8+ T cells in FL tissues was further quantified by calculating the ratio of CD8+cells present in the perifollicular versus the intrafollicular compartments (PF/IF), and interpreted it along with the SID value (). The “high” TCRβ diversity (HD) and “low” TCRβ diversity (LD) groups were defined based on a cut off SID value of 0.77 (the mean SID value of TCRβ diversity in the 6 samples analyzed). In LD tumors (patients 3–5), on the one hand, a higher PF/IF ratio of CD8+ T-cell localization was observed. On the other hand, HD tumors (patients 1 and 2) were associated with a lower PF/IF ratio. In addition, while significantly enriched TCRβ sequences (over 14% of all sequences) could be identified in patients with LD tumors, no similar TCRβ enrichment could be identified in patients 1 and 2 with HD tumors (Table S3). Although further validation is needed, these results suggest that an inverse correlation between CD8+ TCRβ diversity and intrafollicular CD8+ T-cell density may exist.
Figure 4. Correlation between CD8+TCR repertoire diversity and location in FL tissues. (A) The numbers of CD8+ T cells in perifollicular and intrafollicular areas were quantified, and the ratio of PF/IF (IF, intrafollicular; PE, perifollicular) cells was plotted along with the SID parameter. (B) The correlation between IRF4 gene expression and SID was assessed and displayed with a Spearman r of 0.08857 and P-value of 0.0333.
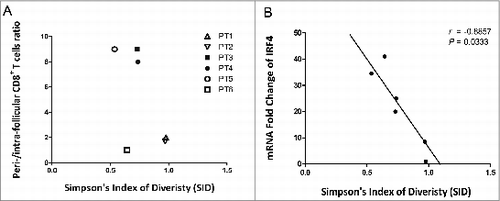
A real-time polymerase chain reaction (PCR) assay for interferon regulatory factor 4 (IRF4), which is important for promoting clonal expansion and maintenance of antigen-specific CD8+ effector T cells,Citation19 revealed significant correlation between the TCRβ diversity of CD8+ T cells in tumors and the expression levels of IRF4 (P = 0.033) (), arguing that expanded CD8+ TCRs may recognize cognate antigens in the FL microenvironment.
Furthermore, we carried out an IHC staining panel for PD-1 along with CD4+ and CD8+ (). PD-1 was found to be highly expressed on intrafollicular T cells. There were strikingly numerous intrafollicular PD-1+ T cells in Patient 4, with variably increased intrafollicular PD-1+ cells in patients 1, 2, 3, and 6, whereas Patient 5 was notable for a distinct paucity of intrafollicular PD-1+T cells due to decreased intrafollicular T cells in both the CD4+ and CD8+ subsets. It is possible that the FL tumor cells selectively allow T cells with “safe” signals, such as PD-1 expression, to enter the tumor nest and support the tumor immune-suppressive microenvironment.
Figure 5. Localization of PD-1+T cells in the lymph nodes of these 6 subjects. Immunohistochemical staining for CD4, CD8, and PD-1 (dark brown) was done on formalin-fixed, paraffin-embedded lymph nodes of 6 FL patients before treatment. Original magnification, ×200 for IHC pictures.
Comparison of CD8+ and Treg TCR Diversity in FL Tissues
To investigate a possible relationship between Tregs and CD8+ T cells in FL tissues, the diversity of the TCRβ sequences of these subsets were compared in each patient sample using SID. Two patterns emerged. For patients 1–4, in whom a higher CD8+ TCR diversity was observed (higher SID values), the Treg TCRβ diversity in these tissues was significantly lower than that observed in the CD8+ TCRβ repertoire (). Conversely, in patients 5 and 6, a lower TCRβ diversity was found among the CD8+ TCR repertoire, whereas here, the Treg TCRβ diversity was broader. When taken together, these results support the hypothesis that the presence of presumably antigen-specific Tregs in FL tissues in the majority of patients prevents the accumulation of CD8+ T cells bearing TCRs specific for FL antigens. The characteristics of Tregand CD8+T-cell subsets in this study are summarized in .
Figure 6. Inverse correlation of TCRβ diversity in CD8+ T cells and Treg cells. TCRβ diversity of T-cell subsets from individual subjects were quantified using SID.
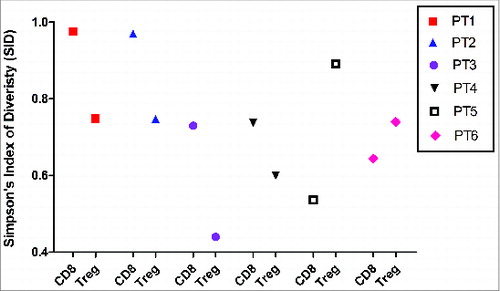
Table 2. Summary of characteristics of Treg and CD8+ T cells in 6 pretreatment FL patients
Public TCRβ Chains Appear to Pair With Private TCRα Chains Across Patients
An attempt was made to identify common TCR-β sequences shared between individual FL specimens. The most common TCRβ sequences consisting of the CDR3β regions CASSPDVDTEKAFF, CASSPDVDTEAFF, or CASITSGAYKNEQFF were highlighted with unique colors in . TCRα sequencing was then carried out to determine whether common TCRα chains were likely to pair with the public TCRβ chains identified based on their relative frequencies. Two public TCRβ chains (TRBV18/TRBJ1-1) with CDR3β sequences (CASSPDVDTEKAFF or CASSPDVDTEAFF) were selected for analysis; the former was found to be enriched in CD4+ and CD8+T cells in patients 4 and 6 and the latter was found in patients 2 and 4. TCRα sequencing in these patients did not indicate the pairing of common TCRα chains with selected public TCRβ chains among patients (). Further, frequently observed TCRβ sequences in Patient 4 (TRBV18/TRBJ1-1) with CDR3β sequences of CASSPDVDTEKAFF or CASSPDVDTEAFF were also chosen for analysis based on their high relative frequencies. Here again, TCRα sequencing suggested that these enriched TCRβ chains likely paired with a number of different TCRα (). The most abundant TregTCRα chains in Patient 4 were TRAV26-1/TRAJ37 and TRAV8-3/TRAJ11; however, in the CD8+ T-cell subpopulation, a single α-chain sequence, TRAV8-3/TRAJ29 was enriched in this patient. We then modeled TRAV with the CDR3α region into a 3-dimensional (3D) structure to exhibit the potential structural difference or similarity in the complementarity-determining regions by selecting individual candidate TCRα chains in each T-cell subset, respectively: TRAV8-3/TRAJ11 with CDR3α of CAVGDHSGYSTLTF (30.50% frequency) for Tregs, TRAV8-3/TRAJ29 with CDR3α of CAVEGNTPLVF (35.68% frequency) in CD8+ T cells, and TRAV22/TRAJ15 with CDR3α of CAVNQAGTALIF (19.03% frequency) in CD4+ T cells (Fig. S1). PyMOL, an open-source visualization tool, was used to display the structures. The blue and green portions represent CDR1α and CDR2α loops and the red loop represents the CDR3α region in the modeled crystal structure. Based on this structural analysis, the paired TCRα chains were obviously different, even if they were heterodimerized with the same TCRβ chain(s). This result suggests that TCRβ chain(s), which are known to mediate recognition of peptide antigens in the context of major histocompatibility complex (MHC) presentation, may be important for recognition of FL antigens; however, the affinity of the α/β TCR for antigen in the context of an MHC class I or II restriction might be regulated by the paired TCRα chain(s). This would be expected to result in different levels of clonal expansion of either CD4+ or CD8+T cells within an individual, or across different individuals, as has been previously demonstrated by Stephen et al.Citation20
Figure 7. Public TCRβ chains and TCRα pairing. (A and B) Two public TCRβ sequences TRBV18/TRBJ1-1 with CDR3β of CASSPDVDTEKAFF and CASSPDVDTEAFF that were observed in patients 2, 4, and 6 (A) as well as every T-cell subset in 1 patient (Patient 4) (B) were selected to be paired with TCRα sequences by frequency. (A) Paired TCRα chains were represented by the sequences of the CDR3α region with percentage. (B) In Patient 4, 2 abundant common TCRβ sequences found among T-cell subsets are presented in pink color, whereas the different paired TCRα candidates are depicted by light green color bars with different patterns in order to exhibit their difference among T-cell subsets.
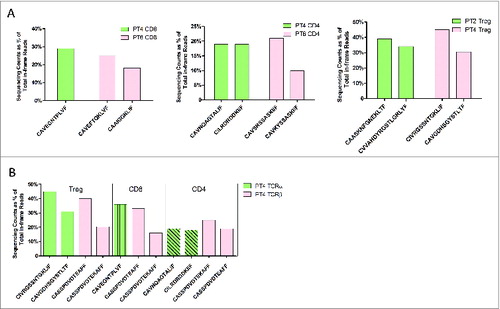
Table 3. Dominant and public TCRβ rearrangements among T-cell subpopulations and cases
A Unique Case – Patient 4
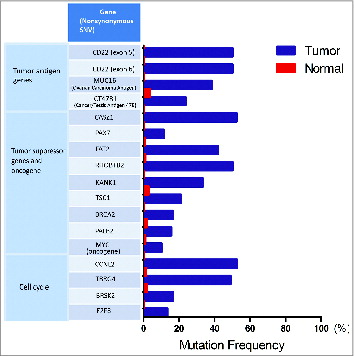
This patient was diagnosed with stage II FL at 61 years of age, and his disease had not progressed in over 10 years, despite his never having received treatment. More surprisingly, several involved lymph nodes spontaneously regressed between 2013 and 2014 (data not shown). In the tumor, we found two abundantly enriched TCRβ sequences among Treg, CD8+, and CD4+ populations, but a similar enrichment of shared TCRα sequences among these T-cell subset populations was not identified. In addition to the CD8+ and Tregcell infiltration in the FL tissue as shown earlier, we also observed a large number of peri- and intrafollicular CD4+T cells (data not shown). The unique TCR sequencing and IHC staining data of this patient prompted us to carry out whole exome sequencing, using genomic DNA (gDNA) extracted from a formalin-fixed paraffin-embedded (FFPE) tissue block and matched control gDNA. As shown in , somatic mutations were identified in genes related to antigen-processing and -presenting pathways; for example, a non-synonymous single-nucleotide variant (SNV) was found in gene UBQLN4 (ubquilin 4), which plays a key role in the either positive or negative regulation of proteasomal protein degradation. In addition, we found non-synonymous somatic mutations possibly associated with the loss of 1 allele in the HLA-DPB1 gene as well as the HLA-C gene. The former occurred in exon 1 of the β-chain of HLA class II molecule and the latter was detected in exon 2 of the HLA class I molecule; interestingly, both of the mutations were located in the peptide-binding domains and considered to affect the peptide-binding affinity (), possibly implying novel antigen presentation with antitumor immunity in this patient. We also listed important tumor suppressor genes, a main oncogene, and some genes related to the cell cycle that gained non-synonymous mutations in this case (), such as FAT2 and MYC. Besides these genes, CD22, a sugar-binding transmembrane protein on the B-cell surface, was detected to acquire mutations in exons 5 and 6 of this gene, respectively, with each having a 50% frequency in the tumor (). This gene was highlighted here because of its specificity on B cells (FL tumor cells) that may be strong candidates of tumor-specific antigen (TSA). Meanwhile, 24 major mutant genes related to the immune system, energy (GTPase, ATPase families), and channel/solute carriers were also detected (data not shown).
Figure 8. Detected mutations in genes involved in antigen processing and presentation pathways. (A) Following whole exome sequencing, a short list of non-synonymous single-nucleotide variants (SNVs) in genes related to antigen processing and presentation identified in FL tissue from Patient 4 are shown with mutational frequency compared to that observed in nonmalignant cells. (B) A schematic diagram indicating the location of non-synonymous SNVs in exon 1 of HLA-DPB1 and exon 2 of HLA-C.
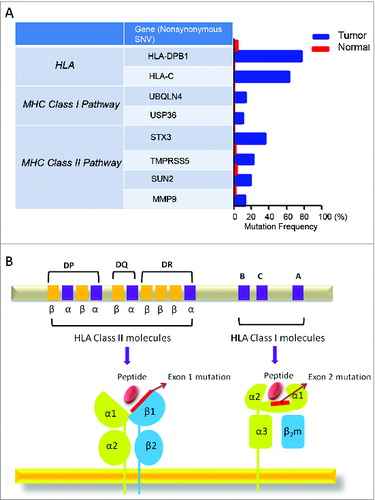
Figure 9. Other interesting mutations detected in Patient 4. A short list of nosynonymous single-nucleotide variants (SNVs) in genes related to tumor antigen, tumor suppressor, oncogene, and cell cycle are displayed with mutational frequency compared to that observed in nonmalignant cells.
Discussion
Regulatory T cells are a naturally immune-suppressive population of CD4+ T cells that, under homeostatic conditions, are critical to maintain peripheral immune tolerance.Citation21-23 Tregs are also potent suppressors of anticancer immunity,Citation24 and their depletion or functional inhibition leads to enhanced T-cell immune responses against cancer antigens in mice and humans.Citation25-28 Tregs have also been shown to accumulate in tumor tissues in almost all cancers studied to date,Citation24,29 where they are attracted by chemokines such as CCL17 and CCL22.Citation26 Typically, increased numbers of tumor-resident Tregs have been linked with poor clinical outcomes in cancer patients.Citation30,31 In contrast, published reports highlighting the impact of Tregs on clinical outcomes in FL have concluded that higher numbers of Tregs in FL tissuesCitation31,32 or a primarily perifollicular Tregdistribution 7are associated with better clinical outcomes. Other studies have not reproduced these results. Another group identified that an intrafollicular Tregpattern, rather than overall Treg numbers, was correlated with inferior survival and a higher risk of disease transformation.Citation11 Based on available results of IHC staining for Treg numbers and localization in the FL microenvironment, it is difficult to make strong conclusions about their prognostic impact. A more thorough analysis of FL-infiltrating Tregs with regard to their specificity and function will be needed before definitive conclusions can be drawn. However, none of these studies have evaluated the specificity of infiltrating Tregs, and the characterization of the Treg TCR repertoire done here has yielded novel information regarding the highly clonal nature of Tregs in FL patients.
Multiple mechanisms through which Tregs suppress conventional CD8+ and CD4+ T cells have been well-characterized in experimental modelsCitation33; however, a major unresolved issue is whether Tregs suppress the host immune response in an antigen-specific or nonspecific manner, as natural antigens recognized by Tregsin human have not been defined. Although preliminary, the data presented here would suggest that, in FL tissues, Tregs are highly clonal. Although it is possible that Tregs might be initially attracted to malignant follicles in a non-clonal manner via chemokines produced by FL B cells, such as CCL22, TCR sequencing data indicate that the expansion and/or survival of Tregsis likely to be antigen dependent once they have arrived in the tumor environment. The functional role of Tregs in the FL microenvironment, however, remains to be elucidated.
Similar to previous reports,Citation34 a perifollicular distribution of CD8+ T cells was present in 4 of 6 samples analyzed by IHC. Interestingly, tumors with a perifollicular CD8+ T-cell distribution tended to have a stronger enrichment of oligoclonal T cells in the CD8 compartment, whereas a more polyclonal CD8+TCR distribution was seen in tumors with a more prominent intrafollicular CD8+ T-cell infiltration. Although speculative, it is possible that CD8+ T cells specific for antigens expressed on FL cells may be actively excluded from the malignant follicles, and has been previously demonstrated in mouse cancer models and in human tumor tissues. On the other hand, polyclonal T cells, which presumably posed no threat, were capable of trafficking into tumor tissue. Meanwhile, 7 enriched CDR3β sequences containing 13–15 amino acid residues in patients 3, 4, 5, and 6 with an oligoclonal CD8+ TCR pattern were selected to generate sequence logos in the Shannon format in order to analyze the similarity of motifs (Fig. S2). However, no obviously enriched motifs were displayed in the CDR3β core region despite some common amino acid usage, possibly indicating that these enriched CD8+ T cells may encounter different tumor antigens in each patient. Furthermore, as shown in , the diversity of the Treg TCR repertoire in FL lymph nodes was correlated inversely with that of the CD8+ TCR repertoire. Although not definitive evidence, these data suggest that antigen-specific Tregs in FL tissues may suppress the expansion of FL-specific CD8+ T cells. This conclusion would be in keeping with the known function of Tregs to suppress conventional tumor antigen-specific T cells.
One of the patients in this study (Patient 4) was particularly interesting. The FL tissue in this case was massively infiltrated by conventional CD4+ T cells and revealed a strong perifollicular CD8+ T-cell infiltration. In contrast, few Tregcells were detected. TCR repertoire analysis, in contrast to other samples, demonstrated an oligoclonal Treg, CD8+, and CD4+TCR pattern. The patient has had FL for over 10 years without treatment, and the disease has undergone spontaneous local regressions, suggestive of ongoing active immune surveillance. This is reminiscent of the “immune equilibrium” state proposed by Schreiber and colleagues in which a constant battle between the tumor and the host immune system is being waged.Citation35 Furthermore, whole exome sequencing of the tumor identified missense mutations in the peptide-binding domains of HLA class I and II molecules. We speculate that such mutations may alter the peptide antigens displayed by malignant B cells, leading to the usage of TCRβ receptors with identical CDR3 regions by different T-cell subsets.
It has become clear over the past 10 years that interactions between immune cells and FL cells can impact the outcome of patients with this disease.Citation36,37 Infiltration of CD4+ and Tregcells has previously been reported in some studies to correlate with improved outcome.Citation31,32 Because FL can spontaneously regress or remit,Citation5 and in some cases vaccination approaches are effective,Citation6 it will be very important in the future to characterize more precisely the immune milieu of individual patients to better define those who may be more likely to respond to immune-based therapies, such as checkpoint blockade therapies with anti-PD-1 or anti-CTLA-4 antibodies, anti-idiotype vaccines, and, possibly in the future, adoptive cell therapy. Simple quantitative measurement of different immune cell subsets in FL has been of limited usefulness in predicting future outcome. The identification of a very limited TCR repertoire among infiltrating T cells in FL in this study is intriguing and opens up a number of future questions and opportunities. For example, baseline analysis of the TCR repertoire may identify those patients who may be more likely to respond to immunotherapy approaches. Furthermore, TCR sequencing combined with exome sequencing of FL samples lead to the identification of targetable antigens for T–cell-based therapeutic strategies.
Methods
Subjects and Lymph Node Samples
Samples were obtained through a protocol approved by the Institutional Review Board of the University of Chicago. The samples were single-cell suspensions derived from diagnostic FL biopsy specimens, which were cryopreserved in liquid nitrogen until the time of analysis. FL grading was determined using the 2008 WHO criteria. The control samples were also single-cell suspensions of nonmalignant lymph node biopsies, cryopreserved similarly.
Isolation of T-Cell Subsets
Single-cell suspension of lymph node samples were thawed. CD4+CD25+ cells (Tregs) and CD4+CD25− cells were isolated using the Dynabeads® Regulatory CD4+/CD25+ T Cell Kit (Life Technologies). For collection of CD8+ cells, the Dynabeads® CD8 Positive Isolation Kit (Life Technologies) was used. To capture the small numbers of Treg cells, the isolation protocol was optimized and 100 000–400 000 CD4+ CD25+Treg cells were isolated from both FL and control groups.
mRNA Extraction and cDNA Synthesis
The RNeasy Mini Kit combined with QIAshredder (QIAGEN) was used to extract purified mRNA from each T-cell subset. mRNA was reverse-transcribed to cDNA with the SMART™ cDNA Library construction Kit (Clontech). During the process, the SMART IV (Switching Mechanism At 5′ end of RNA Transcript) common oligonucleotide adaptor was added to the 5′-end of the transcript in the first-strand synthesis to generate high-yield, full-length, double-stranded cDNA.
TCR Sequencing
One common forward primer based on the SMART IV adaptor and 2 common reverse primers corresponding to the constant (C) regions of each of the TCRα and -β alleles were designed to facilitate PCR amplification of cDNA sequences in a less biased manner. The “Fusion Method” recommended by Life Technologies was used to add specific sequencing adaptors (P1 and A) to both ends of TCR cDNAs. Fusion primers were: TRB P1-forward 5′-CCTCTCTATGGGCAGTCGGTGATTATCAACGCAGAGTGGCCAT3′; TRB A-reverse 5′-CCATCTCATCCCTGCGTGTCTCCGACTCAGTCTGATGGCTCAAACACAG; TRA P1-forward 5′-CCTCTCTATGGGCAGTCGGTGATTATCAACGCAGAGTGGCCAT3′; TRA A-reverse 5′-CCATCTCATCCCTGCGTGTCTCCGACTCAGCAGGGTCAGGGTTCTGGATA3′. After library preparation, TCR cDNA templates were amplified onto the proprietary Ion Sphere Particles by emulsion PCR using Ion PGM Template OT2 400 (Life Technologies) and sequenced using the Ion PGM Sequencing OT2 400 kit (Life Technologies) combined with 318 v2 chip (Life Technologies).
Immunohistochemical Studies
Immunohistochemistry was carried out on deparaffinized tissue sections of lymph nodes using a standard avidin–biotin immunoperoxidase method. A panel of antigens to identify T-cell subsets were developed and included CD3 (clone NCL-565), CD4 (clone SP35), CD8 (C8/144B), and Foxp3 (clone 236A/E7). Staining was done on an automated immunostainer, using Leica Bond III platform and Ventana. Scoring of the T-cell component within the lymphoma tissues was done by examining the peri- and intrafollicular areas by visual inspection. All images are at an original magnification of ×200.
Quantitative Reverse Transcription-PCR
mRNA was extracted from CD8+ T-cell subpopulation and reverse-transcribed to cDNA as described. A real-time PCR Taqman gene expression assay for human IRF4 (hCG20902) gene (Life Technologies) was conducted on ViiA7 instrument (Life Technologies). Each sample was analyzed in duplicate. For each sample, the mean CTvalue for the IRF4 gene was determined and normalized to the value of the human B-2-microglobulin endogenous control. Data were visualized with Prism 5.
Whole Exome Sequencing
Tumor gDNA was extracted from the FFPE block, and matched control gDNA from purified CD4+ intratumor T cells. Sequencing libraries were constructed using the Ion Plus fragment library kit (Life Technologies). A probe hybridization approach from the Ion Targetseq Exome work flow (Life Technologies) was applied to capture the enrichment of the exonic regions. Samples were amplified in template reaction on a OneTouch2 instrument (Life Technologies) to touch the Ion Sphere Particles (ISPs) with optimal amount of exome library input over 7 pmol, and loaded onto a Ion Proton P1 v2 chip. Ion Proton was used to carry out whole exome sequencing with Ion Proton P1 v2 chip sitting (Life Technologies). For bioinformatics analysis, the human reference genome hg19 was used for alignment using TMAP on the Ion Torrent analysis server (Life Technologies). The VarScan2 parameters for SNV were as follows: minimum depth = 10×, minimum variant support depth = 4×, Minimum base quality = 15, somatic P-value threshold = 0.05. Non-silent somatic SNVs were captured following a standard threshold for filtering of somatic variants, which are present at a frequency ≥ 10% in the tumor samples, and <5% in the control DNA.
Simpson's Index of Diversity (1-D)
The diversity was calculated according to Simpson's Index of Diversity (1-D).where ni is the total number of amino acid sequences that belong to type I, a special clone type, and N is the total reads of sequences (in-frame) for each patient.
Statistical Analysis
The t test and P value were calculated with Prism 5 software. The nonparametric Wilcoxon rank-sum test was used to compare 2 groups, and a P-value of less than 0.05 was considered significant. All statistical tests were 2-sided. Spearman's rank correlation coefficients were used to correlate CD8+ TCRβ diversity and IRF4 expression level.
Disclosure of Potential Conflicts of Interest
No potential conflicts of interest were disclosed.
1002728_Supplmentary_Materials.zip
Download Zip (527.1 KB)References
- Swenson WT, Wooldridge JE, Lynch CF, Forman-Hoffman VL, Chrischilles E, Link BK. Improved survival of follicular lymphoma patients in the United States. J Clin Oncol 2005; 23:5019–26; PMID:15983392; http://dx.doi.org/10.1200/JCO.2005.04.503
- Al-Tourah AJ, Gill KK, Chhanabhai M, Hoskins PJ, Klasa RJ, Savage KJ, Sehn LH, Shenkier TN, Gascoyne RD, Connors JM. Population-based analysis of incidence and outcome of transformed non-Hodgkin's lymphoma. J Clin Oncol 2008; 26:5165–9; PMID:18838711; http://dx.doi.org/10.1200/JCO.2008.16.0283
- Solal-Celigny P, Roy P, Colombat P, White J, Armitage JO, Arranz-Saez R, Au WY, Bellei M, Brice P, Caballero D, et al. Follicular Lymphoma International Prognostic Index. Blood 2004; 104:1258–65; PMID:15126323; http://dx.doi.org/10.1182/blood-2003-12-4434
- Dave SS, Wright G, Tan B, Rosenwald A, Gascoyne RD, Chan WC, Fisher RI, Braziel RM, Rimsza LM, Grogan TM, et al. Prediction of survival in follicular lymphoma based on molecular features of tumor-infiltrating immune cells. N Engl J Med 2004; 351:2159–69; PMID:15548776; http://dx.doi.org/10.1056/NEJMoa041869
- Horning SJ, Rosenberg SA. The natural history of initially untreated low-grade non-Hodgkin's lymphomas. N Engl J Med 1984; 311:1471–5; PMID:6548796; http://dx.doi.org/10.1056/NEJM198412063112303
- Levy R, Ganjoo KN, Leonard JP, Vose JM, Flinn IW, Ambinder RF, Connors JM, Berinstein NL, Belch AR, Bartlett NL, et al. Active idiotypic vaccination versus control immunotherapy for follicular lymphoma. J Clin Oncol 2014; 32:1797–803; PMID:24799467; http://dx.doi.org/10.1200/JCO.2012.43.9273
- Lee AM, Clear AJ, Calaminici M, Davies AJ, Jordan S, MacDougall F, Matthews J, Norton AJ, Gribben JG, Lister TA, Goff LK. Number of CD4+ cells and location of forkhead box protein P3-positive cells in diagnostic follicular lymphoma tissue microarrays correlates with outcome. J Clin Oncol 2006; 24:5052–9; published online EpubNov 1 (10.1200/JCO.2006.06.4642); PMID:17033038; http://dx.doi.org/10.1200/JCO.2006.06.4642
- Alvaro T, Lejeune M, Salvado MT, Lopez C, Jaen J, Bosch R, Pons LE. Immunohistochemical patterns of reactive microenvironment are associated with clinicobiologic behavior in follicular lymphoma patients. J Clin Oncol 2006; 24:5350–7; PMID:17135637; http://dx.doi.org/10.1200/JCO.2006.06.4766
- Farinha P, Masoudi H, Skinnider BF, Shumansky K, Spinelli JJ, Gill K, Klasa R, Voss N, Connors JM, Gascoyne RD. Analysis of multiple biomarkers shows that lymphoma-associated macrophage (LAM) content is an independent predictor of survival in follicular lymphoma (FL). Blood 2005; 106:2169–74; PMID:15933054; http://dx.doi.org/10.1182/blood-2005-04-1565
- Glas AM, Knoops L, Delahaye L, Kersten MJ, Kibbelaar RE, Wessels LA, van Laar R, van Krieken JH, Baars JW, Raemaekers J, et al. Gene-expression and immunohistochemical study of specific T-cell subsets and accessory cell types in the transformation and prognosis of follicular lymphoma. J Clin Oncol 2007; 25:390–8; PMID:17200149; http://dx.doi.org/10.1200/JCO.2006.06.1648
- Farinha P, Al-Tourah A, Gill K, Klasa R, Connors JM, Gascoyne RD. The architectural pattern of FOXP3-positive T cells in follicular lymphoma is an independent predictor of survival and histologic transformation. Blood 2010; 115:289–95; PMID:19901260; http://dx.doi.org/10.1182/blood-2009-07-235598
- Gros A, Robbins PF, Yao X, Li YF, Turcotte S, Tran E, Wunderlich JR, Mixon A, Farid S, Dudley ME, et al. PD-1 identifies the patient-specific CD8(+) tumor-reactive repertoire infiltrating human tumors. J Clin Invest 2014; 124:2246–59; PMID:24667641; http://dx.doi.org/10.1172/JCI73639
- Fang H, Yamaguchi R, Liu X, Daigo Y, Yew PY, Tanikawa C, Matsuda K, Imoto S, Miyano S, Nakamura Y. Quantitative T cell repertoire analysis by deep cDNA sequencing of T cell receptor α and β chains using next-generation sequencing (NGS). Oncoimmunology 2014; 3(12): e968467; http://dx.doi.org/10.4161/21624011.2014.968467
- Naito Y, Saito K, Shiiba K, Ohuchi A, Saigenji K, Nagura H, Ohtani H. CD8+ T cells infiltrated within cancer cell nests as a prognostic factor in human colorectal cancer. Cancer Res 1998; 58:3491–4; PMID:9721846
- Pages F, Berger A, Camus M, Sanchez-Cabo F, Costes A, Molidor R, Mlecnik B, Kirilovsky A, Nilsson M, Damotte D, et al. Effector memory T cells, early metastasis, and survival in colorectal cancer. N Engl J Med 2005; 353:2654–66; PMID:16371631; http://dx.doi.org/10.1056/NEJMoa051424
- Sato E, Olson SH, Ahn J, Bundy B, Nishikawa H, Qian F, Jungbluth AA, Frosina D, Gnjatic S, Ambrosone C, et al. Intraepithelial CD8+ tumor-infiltrating lymphocytes and a high CD8+/regulatory T cell ratio are associated with favorable prognosis in ovarian cancer. Proc Nat Acad Sci USA 2005; 102:18538–43; PMID:16344461; http://dx.doi.org/10.1073/pnas.0509182102
- Clemente CG, Mihm MC, Jr., Bufalino R, Zurrida S, Collini P, Cascinelli N. Prognostic value of tumor infiltrating lymphocytes in the vertical growth phase of primary cutaneous melanoma. Cancer 1996; 77:1303–10; PMID:8608507; http://dx.doi.org/10.1002/(SICI)1097-0142(19960401)77:7%3c1303::AID-CNCR12%3e3.0.CO;2-5
- van Houdt IS, Sluijter BJ, Moesbergen LM, Vos WM, de Gruijl TD, Molenkamp BG, van den Eertwegh AJ, Hooijberg E, van Leeuwen PA, Meijer CJ, et al. Favorable outcome in clinically stage II melanoma patients is associated with the presence of activated tumor infiltrating T-lymphocytes and preserved MHC class I antigen expression. Intl J Cancer 2008; 123:609–15; http://dx.doi.org/10.1002/ijc.23543
- Man K, Miasari M, Shi W, Xin A, Henstridge DC, Preston S, Pellegrini M, Belz GT, Smyth GK, Febbraio MA, et al. The transcription factor IRF4 is essential for TCR affinity-mediated metabolic programming and clonal expansion of T cells. Nature Immunol 2013; 14:1155–65; http://dx.doi.org/10.1038/ni.2710
- Turner SJ, Doherty PC, McCluskey J, Rossjohn J. Structural determinants of T-cell receptor bias in immunity. Nature Rev Immunol 2006; 6:883–94; http://dx.doi.org/10.1038/nri1977
- Hori S, Nomura T, Sakaguchi S. Control of regulatory T cell development by the transcription factor Foxp3. Science 2003; 299:1057–61; PMID:12522256; http://dx.doi.org/10.1126/science.1079490
- Fontenot JD, Rasmussen JP, Gavin MA, Rudensky AY. A function for interleukin 2 in Foxp3-expressing regulatory T cells. Nature Immunol 2005; 6:1142–51; http://dx.doi.org/10.1038/ni1263
- Fontenot JD, Rudensky AY. A well adapted regulatory contrivance: regulatory T cell development and the forkhead family transcription factor Foxp3. Nature Immunol 2005; 6:331–7; http://dx.doi.org/10.1038/ni1179
- Zou W. Regulatory T cells, tumour immunity and immunotherapy. Nature Rev Immunol 2006; 6:295–307; http://dx.doi.org/10.1038/nri1806
- Kline J, Brown IE, Zha YY, Blank C, Strickler J, Wouters H, Zhang L, Gajewski TF. Homeostatic proliferation plus regulatory T-cell depletion promotes potent rejection of B16 melanoma. Clinical Can Res 2008; 14:3156–67; http://dx.doi.org/10.1158/1078-0432.CCR-07-4696
- Sutmuller RP, van Duivenvoorde LM, van Elsas A, Schumacher TN, Wildenberg ME, Allison JP, Toes RE, Offringa R, Melief CJ. Synergism of cytotoxic T lymphocyte-associated antigen 4 blockade and depletion of CD25(+) regulatory T cells in antitumor therapy reveals alternative pathways for suppression of autoreactive cytotoxic T lymphocyte responses. J Exp Med 2001; 194:823–32; PMID:11560997; http://dx.doi.org/10.1084/jem.194.6.823
- Dannull J, Su Z, Rizzieri D, Yang BK, Coleman D, Yancey D, Zhang A, Dahm P, Chao N, Gilboa E, et al. Enhancement of vaccine-mediated antitumor immunity in cancer patients after depletion of regulatory T cells. J Clin Invest 2005; 115:3623–33; PMID:16308572; http://dx.doi.org/10.1172/JCI25947
- Onizuka S, Tawara I, Shimizu J, Sakaguchi S, Fujita T, Nakayama E. Tumor rejection by in vivo administration of anti-CD25 (interleukin-2 receptor alpha) monoclonal antibody. Cancer Res 1999; 59:3128–33; PMID:10397255
- Curiel TJ, Coukos G, Zou L, Alvarez X, Cheng P, Mottram P, Evdemon-Hogan M, Conejo-Garcia JR, Zhang L, Burow M, et al. Specific recruitment of regulatory T cells in ovarian carcinoma fosters immune privilege and predicts reduced survival. Nature Med 2004; 10:942–9; PMID:15322536; http://dx.doi.org/10.1038/nm1093
- deLeeuw RJ, Kost SE, Kakal JA, Nelson BH. The prognostic value of FoxP3+ tumor-infiltrating lymphocytes in cancer: a critical review of the literature. Clin Can Res 2012; 18:3022–9; http://dx.doi.org/10.1158/1078-0432.CCR-11-3216
- Carreras J, Lopez-Guillermo A, Fox BC, Colomo L, Martinez A, Roncador G, Montserrat E, Campo E, Banham AH. High numbers of tumor-infiltrating FOXP3-positive regulatory T cells are associated with improved overall survival in follicular lymphoma. Blood 2006; 108:2957–64; PMID:16825494; http://dx.doi.org/10.1182/blood-2006-04-018218
- Tzankov A, Meier C, Hirschmann P, Went P, Pileri SA, Dirnhofer S. Correlation of high numbers of intratumoral FOXP3+ regulatory T cells with improved survival in germinal center-like diffuse large B-cell lymphoma, follicular lymphoma and classical Hodgkin's lymphoma. Haematologica 2008; 93:193–200; PMID:18223287; http://dx.doi.org/10.3324/haematol.11702
- Shevach EM. Mechanisms of foxp3+ T regulatory cell-mediated suppression. Immunity 2009; 30:636–45; PMID:19464986; http://dx.doi.org/10.1016/j.immuni.2009.04.010
- Laurent C, Muller S, Do C, Al-Saati T, Allart S, Larocca LM, Hohaus S, Duchez S, Quillet-Mary A, Laurent G, et al. Distribution, function, and prognostic value of cytotoxic T lymphocytes in follicular lymphoma: a 3-D tissue-imaging study. Blood 2011; 118:5371–9; PMID:21856865; http://dx.doi.org/10.1182/blood-2011-04-345777
- Dunn GP, Old LJ, Schreiber RD. The three Es of cancer immunoediting. Ann Rev Immunol 2004; 22:329–60; http://dx.doi.org/10.1146/annurev.immunol.22.012703.104803
- Kridel R, Sehn LH, Gascoyne RD. Pathogenesis of follicular lymphoma. J Clin Invest 2012; 122:3424–31; PMID:23023713; http://dx.doi.org/10.1172/JCI63186
- Gribben JG. Immune responses and outcome in follicular lymphoma. J Clin Oncol 2014; 32:1757–9; PMID:24799493; http://dx.doi.org/10.1200/JCO.2013.53.8439