
Abstract
Myeloid cells lacking STAT3 promote antitumor responses of NK and T cells but it is unknown if this crosstalk affects development of autochthonous tumors. We deleted STAT3 in murine myeloid cells (STAT3Δm) and examined the effect on the development of autochthonous colorectal cancers (CRCs). Formation of Azoxymethane/Dextransulfate (AOM/DSS)-induced CRCs was strongly suppressed in STAT3Δm mice. Gene expression profiling showed strong activation of T cells in the stroma of STAT3Δm CRCs. Moreover, STAT3Δm host mice were better able to control the growth of transplanted MC38 colorectal tumor cells which are known to be killed in a T cell-dependent manner. These data suggest that myeloid cells lacking STAT3 control formation of CRCs mainly via cross activation of T cells. Interestingly, the few CRCs that formed in STAT3Δm mice displayed enhanced stromalization but appeared normal in size indicating that they have acquired ways to escape enhanced tumor surveillance. We found that CRCs in STAT3Δm mice consistently activate STAT3 signaling which is implicated in immune evasion and might be a target to prevent tumor relapse.
Introduction
CRC represents the third most common form of cancer in humans. CRC develops frequently in the context of inflammatory bowel disease demonstrating a tumor-promoting role of inflammation.Citation1 Moreover, stroma immune cells support growth of CRC via production of cytokines that activate the oncogenic transcription factors NFκB and STAT3.Citation2 However, the stroma also contains immune cells with antitumor activities which force tumors to develop mechanisms of escape and immune suppression.Citation3 One paradigm is the ability of tumors to modulate polarization of TAMs. Th1 cytokines polarize macrophages toward the M1 phenotype which is responsible for innate immune attack of infectious pathogens but also neoplastic cells. Alternative activation by Th2 cytokines polarizes macrophages toward the M2 phenotype which is characterized by low expression of M1 markers (e.g., iNOS) but high expression of M2 markers (e.g., Arginase-1).Citation4 M2 macrophages have reduced antitumorigenic activities but promote angiogenesis and tumor progression.Citation4 Repolarization of M2 macrophages toward the M1 phenotype in tumors represents a promising option for antitumor therapies.Citation5 Another layer of complexity was recently discovered in breast tumors where an additional TAM population, distinguishably from M1 or M2 polarized macrophages, was identified.Citation6
STAT3 phosphorylation at tyrosine residue 705 (pY-STAT3) via Janus kinases (JAKs) is induced by pro- and anti-inflammatory cytokines such as IL-6 and IL-10.Citation7 The oncogenic role of STAT3 in CRC tumor cells has been demonstrated in several studies.Citation8-10 However, STAT3 seems to have a suppressive role in advanced CRCs because ApcMin mice lacking STAT3 in tumor cells developed aggressive intestinal carcinomas that were not observed in ApcMin control animals.Citation11-13 STAT3 activation in tumor cells represents an important immune escape mechanism as cancer cells exploit STAT3-induced expression of VEGF and IL-10 to blunt maturation of stroma DCs. An immune suppressive action is further given by the STAT3-dependent repression of pro-inflammatory cytokines and chemokines including IFNγ, TNFα, IL-6, and CXCL10.Citation14,15
Apart from tumor-cell specific functions, STAT3 is considered to promote tumor formation when being activated in stroma cells of CRCs.Citation13,16,17 Tumor transplantation experiments into mice lacking STAT3 in the hematopoietic system demonstrated that STAT3 activation in immune cells prevents antitumorigenic activities of DCs, Th1 cells, NKs, and neutrophils.Citation18 This led to the concept of inhibiting stroma/hematopoietic STAT3 as potential strategy for cancer immunotherapy.Citation19 Myeloid STAT3 is considered of particular importance for the modulation of Th1-like antitumor responses.Citation20 Consequently, inhibition of STAT3 in myeloid cells and B cells using CpG-STAT3 siRNA enhanced cytotoxic T cell (CTL)-mediated responses in a melanoma transplantation model.Citation21
Here, we demonstrate that ablation of myeloid STAT3 significantly interfered with development of autochthonous AOM/DSS-induced colorectal tumors in mice. This effect was mediated by an enhanced antitumor T cell response. Weighted gene co-expression network analysis (WGCNA) uncovered sustained T cell-mediated immune surveillance in escaped STAT3Δm tumors accompanied by enhanced STAT3 signaling in tumors cells which might promote immune evasion.
Results
Myeloid STAT3 promotes formation of colorectal tumors
We investigated the role of STAT3 in the myeloid stroma cells of autochthonous colorectal tumors developing under inflammatory conditions using mice with conditional inactivation of STAT3 in myeloid cells (STAT3Δm = LysMCre/Cre STAT3flox/flox) and corresponding controls (STAT3wt = LysMCre/Cre STAT3+/+). The LysMCre knock-in alleles were kept homozygous to account for potential Cre or LysM knock-in effects. Successful deletion of STAT3 in myeloid cells was confirmed by Western blot of granulocyte-macrophage precursors, FACS-sorted peritoneal macrophages (Fig. S1A) and qPCR of FACS-sorted splenic macrophages (Fig. S1B). Histopathological analysis and IHC-staining revealed no major changes of cell differentiation or proliferation in colon and small intestine of STAT3Δm mice (Fig. S2A). Despite the observation that deletion of STAT3 in myeloid cells provokes Th1 differentiation and development of colitis,Citation22,23 we could not detect severe colitis in STAT3Δm mice in the C57BL/6 genetic background (Fig. S2B). We only observed a consistently increased mean fluorescence intensity of the activating protein CD69 on CD4+ T cells in the lamina propria of DSS-treated STAT3Δm mice (Fig. S3) indicative for Th1 differentiation.Citation24
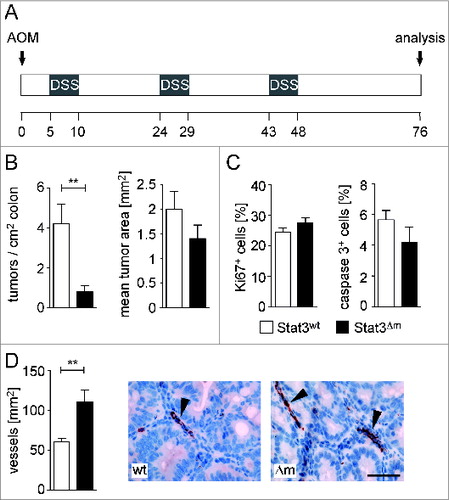
To investigate the impact of myeloid STAT3 in autochthonous tumors, we induced CRC using AOM/DSS (). Tumor multiplicity was strongly reduced in STAT3Δm male mice but tumor size was not affected (). Tumor analysis in female mice gave similar results (data not shown). Tumor parameters such as cell proliferation and cell survival were unaltered in STAT3Δm CRCs () whereas increased numbers of blood vessels were found in the tumor stroma ().
Figure 1. Myeloid STAT3 promotes formation of CRCs. (A) Scheme of the AOM/DSS protocol for induction of CRCs. (B) Tumor multiplicity and mean tumor area of CRCs in male mice (n = 13 for STAT3wt and 16 for STAT3Δm). Bars represent data +/- SEM. (C) Histomorphometric quantitation of IHC stainings for cell proliferation (Ki67) and apoptosis (cleaved caspase 3) in CRCs. Bars represent data +/− SEM of n ≥ 9 tumors in ≥ 3 animals per genotype. (D) Assessment of blood vessel densities in the stroma of CRCs. IHC stainings for vWF-positive blood vessels (arrowheads in images) were used for quantitation. Bars represent data +/− SEM of n ≥ 9 tumors in ≥ 3 animals per genotype. Scale bar indicates 50 μm.
Myeloid STAT3 regulates stromalization of CRCs
Tumor progression requires the reciprocal interaction between tumor and stroma cells. Remarkably, histopathologic and immunohistochemical examination revealed an increased stromalization of STAT3Δm CRCs (). Histomorphometric quantitation of IHC-stained sections (Fig. S4) demonstrated that the relative percentages of most cell types were unaltered in the stroma of STAT3Δm CRCs (). Interestingly, RORγt+ Th17 cells were almost absent (). Among macrophages, we found a reduction of cells expressing the macrophage M2 polarization protein Arginase-1 paralleled by an increase in the number of M1 expressing iNOS-positive cells ().
Figure 2. Enhanced stromalization of STAT3Δm tumors. (A) H&E staining (upper panel; T: tumor; S: stroma; scale bar indicates 100 μm) and double IHC for PDGFR/FSP1 (lower panel; scale bar indicates 50 μm) revealed increased stromal area in STAT3Δm tumors. FSP1+ fibroblasts are indicated by arrowheads. (B) IHC stainings with antibodies for indicated antigens were used for quantitative histomorphometry to define the composition of the tumor stroma. Bars represent data +/− SEM of n ≥ 9 tumors in ≥ 3 animals per genotype. (C) STAT3Δm tumors displayed reduced percentages of Arginase-1+ cells and increased percentages of iNOS+ cells. Bars represent data +/− SEM of n ≥ 9 tumors in ≥ 3 animals per genotype. (D) Histopathological grading of colon tumors revealed no significant change in STAT3Δm mice (l.g.: low grade; h.g.: high grade; n = 97 STAT3wt and 26 STAT3Δm tumors).
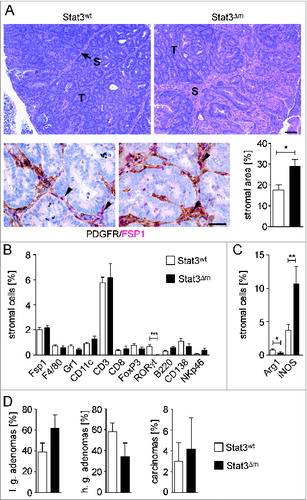
Increased stromalization is frequently associated with enhanced tumor progression and invasiveness. However, no significant alteration in the percentages of low grade tumors, high grade tumors and carcinomas was observed in STAT3Δm mice ().
Myeloid STAT3 is not required for NK cell-mediated immune surveillance of CRCs
Loss of STAT3 in myeloid cells leads to an aberrant activation of NK and T cells.Citation18,25 Thus, we studied whether reduced colorectal tumorigenesis is caused by an improved immune surveillance exerted by NK or T cells. NK cell-dependent cytotoxicity was assessed ex vivo using spleen-derived NK cells and CFSE-stained YAC-1 target cells. No significant differences in killing efficacies of NK cells isolated from STAT3wt or STAT3Δm mice were detected (). Similarly, numbers of NK cells in the spleen and the expression of NK cell maturation markers (CD27, KLRG-1) were unchanged (Fig. S5A) as were the percentages of NKG2D+, NKG2A/C/E+, DNAM-1+, and Ly49C/I+ NK cells (Fig. S5B). The only consistent changes were lower numbers of NK cells expressing the activating receptor Ly49D, which recognizes MHC-I alloantigens () and an enhanced mean fluorescence intensity of the activating receptor NKG2D in STAT3Δm mice (). As NKG2D is an important receptor for the recognition of stress-induced ligands on tumors, we performed transplantation experiments with isogenic C57BL/6-derived BCR/ABLp185 leukemia cells that are sensitive to eradication by NK cells.Citation26 Although BCR/ABLp185-derived tumors were slightly smaller in STAT3Δm host animals, indicative for an improved NK cell-mediated tumor surveillance, the differences did not reach statistical significance ().
Figure 3. Tumor cytotoxicity of NK cells, isolated from spleens of STAT3wt and STAT3Δm mice, and development of CRCs in mice with reduced NK cell numbers. (A) Flow cytometric analysis of specific lysis of CFSE-labeled YAC-1 target cells by splenocytes from STAT3wt and STAT3Δm mice, injected with PBS or poly (I:C) (n = 3 per group). Different effector:target ratios are indicated. (B, C) Flow cytometric analysis of STAT3wt and STAT3Δm splenocytes demonstrating reduced percentage of CD3− NKp46+ gated Ly49D+ NK cells but increased mean fluorescence intensity (MFI) of NKG2D on CD3− NKp46+ gated NK cells in STAT3Δm mice (n ≥ 4 mice per genotype). (D) Tumor weight and tumor images after transplantation of BCR/ABLp185 tumor cells into STAT3wt and STAT3Δm host mice (n = 15 tumors in STAT3wt and 11 tumors in STAT3Δm mice). (E) STAT5ΔNK mice were employed as genetic model for NK ablation. The reduction of NK cell numbers in the intestine was confirmed by FACS analysis of mucosal cell preparations for CD45+ CD3− CD19− NKp46+ NK cells (left graph). Reduction of NK cell numbers did not affect tumor multiplicity and mean tumor area of AOM/DSS-induced CRCs (n = 8 STAT5fl/fl and 11 STAT5ΔNK mice). Bars represent data +/− SEM.
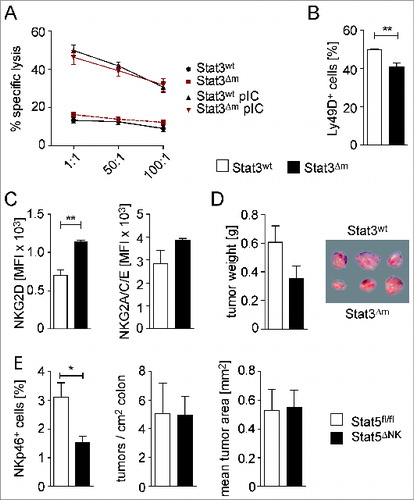
We next investigated the impact of NK cell-mediated immune surveillance on formation of autochthonous CRCs. For that purpose, we treated STAT5wt and STAT5ΔNK mice with AOM/DSS. STAT5ΔNK mice represent a model for genetic ablation of NK cells.Citation27 However, no significant change in AOM/DSS-induced tumor formation was observed in STAT5ΔNK mice despite of the substantial reduction of NKp46+ cell numbers in the gut (). These data suggest that NK cell-mediated killing activities do not significantly contribute to immune surveillance of AOM/DSS-induced CRCs.
Myeloid STAT3 is required for T cell-mediated immune surveillance of CRCs
Apart from NK cells, CTLs and helper T cells are key determinants of tumor immune surveillance. Therefore, we performed in vivo cytotoxicity assays. m-TRP2181-188-immunized STAT3Δm mice displayed a slight but significantly enhanced killing activity of m-TRP2181-188-pulsed CFSE-labeled splenocytes in vivo () indicating enhanced CTL activity. To address whether the enhanced T cell-dependent cytotoxicity extends to CRCs, we transplanted isogenic colorectal MC38 adenocarcinoma cells. Remarkably, MC38 tumor growth, which is controlled by T cells,Citation28 was significantly impaired in STAT3Δm host animals (). Reduced tumor growth was accompanied by higher numbers of CD4+ T cells and slightly increased numbers of CD8+ cytotoxic T lymphocytes in tumor cell preparations (). The number of immature myeloid-derived suppressor cells (MDSCs) was also elevated in tumors of STAT3Δm host mice whereas TAMs were reduced (). No changes of NK cell infiltration were observed (data not shown). Moreover, NKG2D ligand RaeI and MHC-I protein expression levels were similar on MC38 tumor cells that developed in STAT3wt and STAT3Δm mice (data not shown). These data demonstrate enhanced T cell-mediated killing of MC38 colorectal tumors cells in STAT3Δm host mice.
Figure 4. Characterization of cytotoxic T cell activity in STAT3Δm mice. (A) In vivo cytotoxicity assay in STAT3wt and STAT3Δm mice immunized with m-TRP2181-188. CFSElow target cells were used as internal control. CFSEhigh target cells were loaded with an irrelevant peptide or m-TRP2181–188 (relevant peptide). Specific killing was calculated after FACS analysis of CFSE-labeled target cells (n = 4 mice per group). (B) Tumor weight of transplanted MC38 tumor cells into STAT3wt and STAT3Δm mice (n = 12 tumors in STAT3wt and 14 tumors in STAT3Δm mice). (C) FACS analysis of immune cell preparations revealed increased numbers of CD4+ T cells, MDSCs (Gr1hi CD11b+) and reduced numbers of TAMs (Gr1lo CD11b+ CD11clo) in MC38 tumors of STAT3Δm hosts. Bars represent data +/– SEM. (D) Affymetrix RNA expression data of laser-capture microdissected stroma tissue from STAT3wt and STAT3Δm CRCs for genes indicative for T cell activation (left graph) and IL-2 receptors (right graph). (E) Affymetrix RNA expression data of ICR genes measured in the tumor stroma. (F) STAT1 protein expression and activation in the stroma of STAT3Δm CRCs. Images show IHC-stained tissue sections of stroma cells positive for phosphorylated (activated) pY-STAT1 (arrowheads). Scale bar indicates 50 μm. Corresponding IHC stainings were used for histomorphometric quantitation of STAT1- and pY-STAT1-positive cells in the tumor stroma (bar diagrams). Bars represent data +/− SEM of n ≥ 9 tumors in ≥ 3 animals per genotype.
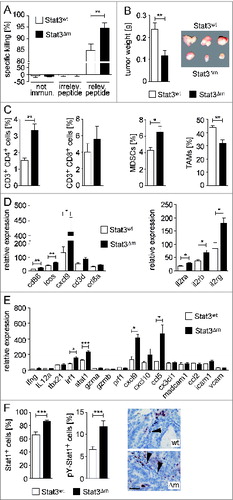
We next investigated if enhanced T cell activity is also evident in the stroma of autochthonous AOM/DSS-induced STAT3Δm CRCs. Tumor and stroma tissue were separated by microdissection and microarray analysis was performed with isolated RNA. Genes indicative for T cell activation were upregulated in the stroma of STAT3Δm CRCs (). In human CRCs, a gene expression profile called Immunologic Constant of Rejection (ICR) signatureCitation29 is indicative for T cell activation and better prognosis of patients. Several genes of the human ICR signature such as stat1 were also found upregulated in murine STAT3Δm CRCs (). STAT1 is a key factor in immune surveillanceCitation30 and it has been shown that deletion of STAT3 shifts gp130-type cytokine signaling from a STAT3 to a STAT1 response.Citation31 Consistently, increased numbers of stroma cells with STAT1 protein expression and STAT1 activation were detected in STAT3Δm CRCs (). Taken together, these data support the concept that CRC growth in STAT3Δm mice is limited by T cell-mediated immune surveillance.
CRCs of STAT3Δm mice escape T cell-mediated killing
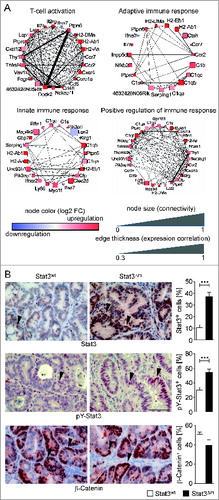
In order to gain further insight into immune-mediated killing and putative tumor cell-autonomous escape mechanisms of CRCs, microarray data from tumor and stroma tissues were analyzed by WGCNA. Modules of high correlation for genes implicated in immune responses and cytokine production were identified with microarray data from stroma tissue (Fig. S6). In line with the increased density of blood vessels observed in the stroma of STAT3Δm tumors () we also identified a module containing genes implicated in angiogenesis (Fig. S6). This module was further stratified into positive and negative regulators of angiogenesis which revealed a bias toward increased expression of positive regulators and decreased expression of negative regulators in the stroma of STAT3Δm tumors (Fig. S7A). Network plots for GO terms in immune modules revealed a clear result with drastic upregulation of corresponding genes in the stroma of STAT3Δm tumors (; Fig. S7B). Upregulation of cytokine/chemokine receptors, MHC-II molecules and complement factors was identified in network plots (; Fig. S7B). Implicated genes suggested a strong enhancement of immune responses related to T cell activation. In summary, these data provide strong evidence for a pronounced T cell dependent immune surveillance occurring in AOM/DSS-induced tumors in the absence of myeloid STAT3.
Figure 5. Weighted Gene Co-expression Network Analysis (WGCNA) of Affymetrix RNA expression data obtained with laser-capture microdissected stroma of STAT3wt and STAT3Δm CRCs. Modules of highly correlated genes were identified for immune response genes. (A) Selected network plots for GO terms in immune modules. Blue node color represents downregulation and red node color represents upregulation of gene expression in the stroma of STAT3Δm tumors. The node size is associated with the gene's co-expression in the entire data set. The edge (line) thickness is linked to the gene's connectivity (co-expression within the module). (B) Enhanced STAT3 expression and activation in STAT3Δm CRCs. IHC stainings for total STAT3, phosphorylated pY-STAT3 and ß-Catenin proteins were used for histomorphometric quantitation of positive tumor cells (arrowheads in images). Bars represent data +/− SEM of n ≥ 9 tumors in ≥ 3 animals per genotype. Scale bar indicates 50 μm.
Cell-autonomous changes of putative immunoediting pathways in STAT3Δm CRCs
Despite maintained T cell activation in the stroma, tumors of STAT3Δm mice did not show a significant reduction in size (). This indicates that established CRCs in STAT3Δm mice must have developed strategies to escape the enhanced tumor surveillance. We thus investigated the microarray expression data of the microdissected tumor cell tissue separately for processes involved in immunoediting. RNA expression of immunosuppressive tumor-derived factors (Fig. S8A) and NKG2D stress-induced ligands (Fig. S8B) were unchanged. Unaltered protein expression of the NKG2D ligand RaeI was confirmed by IHC (data not shown). As STAT3Δm CRCs displayed increased expressing of complement factors in the stroma (; “adaptive immune response”) we investigated expression of mCRPs, which protect tumor cells from complement attack. No differences were observed (Fig. S8C).
We next used the Molecular Signature Database of the Broad Institute to identify differentially regulated signaling pathways in tumor cells. Genes upregulated in STAT3Δm tumor cells (>2-fold) overlapped with genes upregulated in colonic tissue after treatment with IL-22 (a potent inducer of STAT3)Citation32 indicating enhanced STAT3 signaling. Since STAT3 activation is a prominent mechanism involved in immune escape of tumor cells,Citation33 we stained STAT3Δm tumors for STAT3 and activated nuclear pY-STAT3. Consistent with the overlap analysis, elevated levels of STAT3 and activated pY-STAT3 were evident in STAT3Δm tumor cells (). The overlap analysis also suggested increased expression of c-Myc, a STAT3 target gene,Citation34 in STAT3Δm tumor cells which was confirmed by IHC (data not shown). In contrast, no obvious change in nuclear ß-Catenin, the major driver of CRC formation, was observed (). These data suggest that STAT3Δm CRCs activate STAT3 signaling in tumor cells for immune escape.
Discussion
Ablation of hematopoietic STAT3 results in antitumor immune responses in murine models of tumor cell transplantation.Citation14 These models have certain disadvantages since tumor cell lines have been cultured for a long period of time and may not ideally reflect tumor development in vivo. Our knowledge on the role of hematopoietic STAT3 in autochthonous tumors is limited. It is also unclear if and how tumors will adapt to a different microenvironment upon deletion of STAT3 to circumvent and escape the improved immune surveillance. Thus, we deleted STAT3 in myeloid cells in a murine model of autochthonous CRCs. The use of an autochthonous model allowed us to study cellular and molecular consequences of myeloid STAT3 ablation on the tumor stroma as well as on the tumor cells themselves. We found that ablation of myeloid STAT3 interfered with formation of inflammation-associated CRCs. Only few tumors evolved that seemed having adapted to escape the strong immunogenic microenvironment.
Inflammation is a strong promoter for CRC development but inflammatory infiltrates also contain immune cells with antitumor activities.Citation1 Loss of STAT3 in hematopoietic cells provokes inflammation in the gut albeit it remained unclear whether this condition promotes or prevents formation of colitis-associated CRCs.Citation23,35,36 Interestingly, we have not observed severe spontaneous colitis in STAT3Δm mice. STAT3Δm and STAT3wt mice also responded to a comparable extent to DSS treatment regarding the activation status of intestinal inflammatory cells and ulceration score. Several reasons may underlie this discrepancy. It may be caused by the different C57BL/6 genetic background or alternatively may be related to a different intestinal microflora as STAT3Δm associated enterocolitis reacts to ablation of TLR4 signaling.Citation22
The increased angiogenesis observed in STAT3Δm CRCs remains controversial because it has been demonstrated that STAT3 activation in MDSCs and TAMs of transplanted B16 melanomas favors tumor angiogenesis.Citation37 However, the altered stromalization and chemokine/cytokine expression might have pleiotropic effects on angiogenesis pathways in STAT3Δm CRCs. The observed bias toward increased expression of positive regulators and decreased expression of negative regulators in the stroma of STAT3Δm tumors might result in a net increase of angiogenesis that cannot be attributed to a single factor. Interestingly, RORγt+ Th17 cells were almost completely absent in the stroma of STAT3Δm tumors. The role of this cell type in cancer is controversial and promoting as well as suppressive effects on angiogenesis have been reported.Citation38 It has been demonstrated that inflammatory cytokines from local macrophages and dendritic cells can promote a Th17-Th1 “phenotypic drift” that leads to gradual acquisition of Th1-associated gene expression by Th17 cells. This is marked by loss of Th17 cell molecules including RORγt.Citation39 It is possible that the STAT3-deficient myeloid cells promote a Th17-Th1 “phenotypic drift” thereby depleting the RORγt+ Th17 cell population in STAT3Δm tumors.
Upon challenge with transplanted tumor cells, the MC38 studies suggest that enhanced immune surveillance in STAT3Δm mice largely relies on myeloid cross activation of T cells. Most importantly, the stroma gene expression signatures in STAT3Δm tumors are clearly indicative for T cell activation whereas NK cell activities seem to play a minor role. In line with this hypothesis, CRC formation was not promoted in STAT5ΔNK mice which display reduced NK cell numbers and NK cell-dependent tumor surveillanceCitation27 including a significant reduction of Nkp46+ NK cells in the gut. The presence of CD3+, CD8+, and CD45RO+ stroma T cell infiltration and their intratumoral location in CRCs (Immunoscore) represents a better prognostic marker than conventional TNM staging.Citation40 The additional determination of a core gene expression signature called ICR further refines the accuracy of prognosis.Citation29 T cells were the most abundant stroma cell type in AOM/DSS-induced CRCs. Importantly, STAT3Δm tumors displayed upregulation of ICR genes irf1, stat1, cxcl9, and ccl5 indicating that they represent predictive markers in mice and humans.
The concept of immunoediting suggests that tumors – incompletely eradicated by the immune system – remain dormant and eventually escape immune attack (i.e. they become edited).Citation33 CRCs in STAT3Δm mice face sustained stroma T cell activities that might force them to develop additional immune evasion mechanisms. The importance of STAT3 activation in tumor cells for immune evasion is well documentedCitation41,42 and has been demonstrated for various cancers including glioblastomaCitation43,44 and squamous cell carcinoma.Citation45 STAT3 is predominantly activated by IL-6 and IL-11 cytokines in CRCs.Citation46 This cytokine-mediated STAT3 activation is usually transient but cancer cells have developed mechanisms for persistent activation of STAT3 that depends on sphingosine signaling.Citation47,48 CRCs in STAT3Δm mice might represent a subset of survivors with particular high pY-STAT3 levels in tumor cells that selectively escaped sustained T cell activities. pY-STAT3 autoregulates its own expressionCitation49 leading to a positive feed forward loop that might explain the high levels of total STAT3 protein in STAT3Δm tumor cells.
STAT3 inhibitors are in clinical trials for various types of cancersCitation50 and several immunotherapy strategies for CRC are currently tested.Citation51 Our data suggest that application of STAT3 inhibitors interferes with immune evasion of CRC tumor cells which would improve the efficacy of immunotherapy strategies and prevent relapse.
Methods
Mice and in vivo experiments
C57BL/6 STAT3Δm (=LysMCre/Cre STAT3flox/flox) and STAT3wt control (=LysMCre/Cre STAT3+/+) miceCitation52,53 were employed for tumor induction with AOM/DSS. For tumor transplantation studies, 1 × 10⁵ of BCR/ABLp185 or 1 × 10⁶ of MC38 cells were injected subcutaneously. Tumors were weighed and analyzed by flow cytometry 11 d (BCR/ABLp185) and 14 d (MC38) after transplantation. In vivo cytotoxicity of CTL cells was evaluated as previously described (supplemental methods).Citation54 F4/80+ peritoneal macrophages were FACS sorted 4 h after i.p. injection of 4% thioglycerol (Sigma). All mouse experiments were performed in accordance with Austrian and European laws and with the general regulations specified by the Good Science Practices guidelines of the Medical University of Vienna.
In vitro cytotoxicity assay of NK cells
Mice were injected i.p. with PBS or 100 μg poly (I:C) to activate NK cells and spleen cells were isolated after 18 h. Splenocytes were incubated with 5 × 10⁴ CFSE-stained (2.5 μM) YAC-1 target cells at effector-to-target ratios of 100:1, 50:1 and 25:1 in triplicates in 96-well plates. To assess the extent of spontaneously occurring apoptosis, tumor cells were incubated in the absence of NK cells. After 6 h 7-AAD Viability Solution was added and cytotoxicity was quantified by flow cytometry. Cytotoxicity was normalized to quantified NK numbers of splenic single cell suspensions.
Histology and immunohistochemistry (IHC)
Intestines were flushed with PBS and 4% buffered formaldehyde and fixed as Swiss roles in 4% formaldehyde. 4 μm paraffin sections were stained with H&E, alcian blue or IHC using standard procedures (supplemental methods).
Flow cytometric analysis
For staining of macrophages, splenic immune cells and lamina propria lymphocytes, cells were preincubated with PBS containing 0.5% BSA and FCγIII/IIR antibody to block nonspecific binding. The Cell Trace CFSE Cell Proliferation Kit (Invitrogen) and the 7-AAD Viability Solution (eBioscience) was used according to the manufacturer's instruction. Cells were stained with corresponding antibodies (supplemental methods) and analyzed using a FACSCantoTM II flow cytometer (BD Biosciences) or a FACS Fortessa (Beckton Dickinson) and data were calculated with FACSDiva software (BD Biosciences).
Microarray analysis
RNA from microdissected paraffin material was labeled and hybridized to mouse whole genome GeneChip Mouse Gene 2.0ST arrays (Affymetrix) according to manufacturer's instructions. Microarray data were analyzed using Limma package of R with the parameters “mouse,” “tissue type” (tumor and stroma) and “genotype” using a paired approach with “mouse” as pairing variable.Citation55 p values were adjusted according to Benjamini-Hochberg.Citation56 An adjusted p value < 0.05 was considered as significant. Data are available at GEO via accession number GSE60871.
Weighted Gene Co-expression Network Analysis (WGCNA)
The Pearson correlations were calculated for all pairs of genes in the samples. The resulting correlation matrix was transformed into a matrix of connection strengths by raising the absolute value of the correlation coefficients to the power ß. A ß of 6 was used to satisfy the scale free topology criterion.Citation57 The top 25% of genes displaying the highest variability over the entire dataset were selected for module detection. From these genes, modules were determined using the “blockweise” module detection function of the WGCNA package with default values except for the minimal module size and the merge cut height parameters (set to 20 and 0.05, respectively). Biological functions of the single modules were determined using the GO term enrichment analysis function of WGCNA. Only “biological function” ontology was included into the analysis.Citation58 p values of enriched terms were adjusted as above according to Benjamini-Hochberg. An adjusted p value < 0.05 was considered as significant.
Statistics
Significant differences in tumor parameters, IHC stainings and RT-PCR data were calculated with GraphPad Prism 5 software using unpaired t test and Mann–Whitney test. Multiple comparisons were calculated with One-way Anova and Bonferroni post-test. Significant differences between experimental groups were: *p < 0.05, **p < 0.01, or ***p < 0.005.
Disclosure of Potential Conflicts of Interest
No potential conflicts of interest were disclosed.
998529_Supplementary_Materials.zip
Download Zip (500.4 MB)Funding
This work was supported by the Ludwig Boltzmann Gesellschaft (LBG), the Austrian Science Fund (FWF) grant SFB F28 to RE, BS, VS, and MM, the FWF Doktoratskolleg-plus grant “Inflammation and Immunity” to RE, BS, VS, and MM, the FWF grants P25925-B20 and P26908-B20 to RE, the Comprehensive Cancer Center (CCC) Vienna Research Grant to RE, and the Italian Cancer Research Association (AIRC) grant IG13009 to VP.
Related Research Data
References
- Terzic J, Grivennikov S, Karin E, Karin M. Inflammation and colon cancer. Gastroenterology 2010; 138:2101-14 e5; PMID:20420949; http://dx.doi.org/10.1053/j.gastro.2010.01.058
- Fan Y, Mao R, Yang J. NF-kappaB and STAT3 signaling pathways collaboratively link inflammation to cancer. Protein Cell 2013; 4:176-85; PMID:23483479; http://dx.doi.org/10.1007/s13238-013-2084-3
- Quail DF, Joyce JA. Microenvironmental regulation of tumor progression and metastasis. Nat Med 2013; 19:1423-37; PMID:24202395; http://dx.doi.org/10.1038/nm.3394
- Biswas SK, Mantovani A. Macrophage plasticity and interaction with lymphocyte subsets: cancer as a paradigm. Nat Immunol 2010; 11:889-96; PMID:20856220; http://dx.doi.org/10.1038/ni.1937
- Pyonteck SM, Akkari L, Schuhmacher AJ, Bowman RL, Sevenich L, Quail DF, Olson OC, Quick ML, Huse JT, Teijeiro V et al. CSF-1R inhibition alters macrophage polarization and blocks glioma progression. Nat Med 2013; 19:1264-72; PMID:24056773; http://dx.doi.org/10.1038/nm.3337
- Franklin RA, Liao W, Sarkar A, Kim MV, Bivona MR, Liu K, Pamer EG, Li MO. The cellular and molecular origin of tumor-associated macrophages. Science 2014; 344:921-5; PMID:24812208; http://dx.doi.org/10.1126/science.1252510
- Murray PJ. The JAK-STAT signaling pathway: input and output integration. J Immunol 2007; 178:2623-9; PMID:17312100; http://dx.doi.org/10.4049/jimmunol.178.5.2623
- Becker C, Fantini MC, Schramm C, Lehr HA, Wirtz S, Nikolaev A, Burg J, Strand S, Kiesslich R, Huber S et al. TGF-beta suppresses tumor progression in colon cancer by inhibition of IL-6 trans-signaling. Immunity 2004; 21:491-501; PMID:15485627; http://dx.doi.org/10.1016/j.immuni.2004.07.020
- Bollrath J, Phesse TJ, von Burstin VA, Putoczki T, Bennecke M, Bateman T, Nebelsiek T, Lundgren-May T, Canli O, Schwitalla S et al. gp130-mediated Stat3 activation in enterocytes regulates cell survival and cell-cycle progression during colitis-associated tumorigenesis. Cancer Cell 2009; 15:91-102; PMID:19185844; http://dx.doi.org/10.1016/j.ccr.2009.01.002
- Grivennikov S, Karin E, Terzic J, Mucida D, Yu GY, Vallabhapurapu S, Scheller J, Rose-John S, Cheroutre H, Eckmann L et al. IL-6 and Stat3 are required for survival of intestinal epithelial cells and development of colitis-associated cancer. Cancer Cell 2009; 15:103-13; PMID:19185845; http://dx.doi.org/10.1016/j.ccr.2009.01.001
- de Jong PR, Mo JH, Harris AR, Lee J, Raz E. STAT3: an anti-invasive factor in colorectal cancer? Cancers 2014; 6:1394-407; PMID:24995503; http://dx.doi.org/10.3390/cancers6031394
- Lee J, Kim JC, Lee SE, Quinley C, Kim H, Herdman S, Corr M, Raz E. Signal transducer and activator of transcription 3 (STAT3) protein suppresses adenoma-to-carcinoma transition in Apcmin/+ mice via regulation of Snail-1 (SNAI) protein stability. J Biol Chem 2012; 287:18182-9; PMID:22496368; http://dx.doi.org/10.1074/jbc.M111.328831
- Musteanu M, Blaas L, Mair M, Schlederer M, Bilban M, Tauber S, Esterbauer H, Mueller M, Casanova E, Kenner L et al. Stat3 is a negative regulator of intestinal tumor progression in Apc(Min) mice. Gastroenterology 2010; 138:1003-11 e1-5; PMID:19962983; http://dx.doi.org/10.1053/j.gastro.2009.11.049
- Rebe C, Vegran F, Berger H, Ghiringhelli F. STAT3 activation: a key factor in tumor immunoescape. Jak-Stat 2013; 2:e23010; PMID:24058791; http://dx.doi.org/10.4161/jkst.23010
- Yu H, Pardoll D, Jove R. STATs in cancer inflammation and immunity: a leading role for STAT3. Nat Rev Cancer 2009; 9:798-809; PMID:19851315; http://dx.doi.org/10.1038/nrc2734
- Huang S. Regulation of metastases by signal transducer and activator of transcription 3 signaling pathway: clinical implications. Clin Cancer Res 2007; 13:1362-6; PMID:17332277; http://dx.doi.org/10.1158/1078-0432.CCR-06-2313
- Klampfer L. The role of signal transducers and activators of transcription in colon cancer. Front Biosci 2008; 13:2888-99; PMID:17981761; http://dx.doi.org/10.2741/2893
- Kortylewski M, Kujawski M, Wang T, Wei S, Zhang S, Pilon-Thomas S, Niu G, Kay H, Mule J, Kerr WG et al. Inhibiting Stat3 signaling in the hematopoietic system elicits multicomponent antitumor immunity. Nat Med 2005; 11:1314-21; PMID:16288283; http://dx.doi.org/10.1038/nm1325
- Lee H, Pal SK, Reckamp K, Figlin RA, Yu H. STAT3: a target to enhance antitumor immune response. Curr Topics Microbiol Immunol 2011; 344:41-59; PMID:20517723
- Gabrilovich DI, Ostrand-Rosenberg S, Bronte V. Coordinated regulation of myeloid cells by tumours. Nat Rev Immunol 2012; 12:253-68; PMID:22437938; http://dx.doi.org/10.1038/nri3175
- Herrmann A, Kortylewski M, Kujawski M, Zhang C, Reckamp K, Armstrong B, Wang L, Kowolik C, Deng J, Figlin R et al. Targeting Stat3 in the myeloid compartment drastically improves the in vivo antitumor functions of adoptively transferred T cells. Cancer Res 2010; 70:7455-64; PMID:20841481; http://dx.doi.org/10.1158/0008-5472.CAN-10-0736
- Kobayashi M, Kweon MN, Kuwata H, Schreiber RD, Kiyono H, Takeda K, Akira S. Toll-like receptor-dependent production of IL-12p40 causes chronic enterocolitis in myeloid cell-specific Stat3-deficient mice. J Clin Invest 2003; 111:1297-308; PMID:12727921; http://dx.doi.org/10.1172/JCI17085
- Takeda K, Clausen BE, Kaisho T, Tsujimura T, Terada N, Forster I, Akira S. Enhanced Th1 activity and development of chronic enterocolitis in mice devoid of Stat3 in macrophages and neutrophils. Immunity 1999; 10:39-49; PMID:10023769; http://dx.doi.org/10.1016/S1074-7613(00)80005-9
- Dorfman DM, Shahsafaei A. CD69 expression correlates with expression of other markers of Th1 T cell differentiation in peripheral T cell lymphomas. Hum Pathol 2002; 33:330-4; PMID:11979374; http://dx.doi.org/10.1053/hupa.2002.32215
- Cheng F, Wang HW, Cuenca A, Huang M, Ghansah T, Brayer J, Kerr WG, Takeda K, Akira S, Schoenberger SP et al. A critical role for Stat3 signaling in immune tolerance. Immunity 2003; 19:425-36; PMID:14499117; http://dx.doi.org/10.1016/S1074-7613(03)00232-2
- Putz EM, Hoelzl MA, Baeck J, Bago-Horvath Z, Schuster C, Reichholf B, Kern D, Aberger F, Sexl V, Hoelbl-Kovacic A. Loss of STAT3 in Lymphoma relaxes NK cell-mediated tumor surveillance. Cancers 2014; 6:193-210; PMID:24473086; http://dx.doi.org/10.3390/cancers6010193
- Eckelhart E, Warsch W, Zebedin E, Simma O, Stoiber D, Kolbe T, Rulicke T, Mueller M, Casanova E, Sexl V. A novel Ncr1-Cre mouse reveals the essential role of STAT5 for NK-cell survival and development. Blood 2011; 117:1565-73; PMID:21127177; http://dx.doi.org/10.1182/blood-2010-06-291633
- Hilburger Ryan M, Abrams SI. Characterization of CD8+ cytotoxic T lymphocyte/tumor cell interactions reflecting recognition of an endogenously expressed murine wild-type p53 determinant. Cancer Immunol, Immunother: CII 2001; 49:603-12; PMID:11225991; http://dx.doi.org/10.1007/s002620000156
- Galon J, Angell HK, Bedognetti D, Marincola FM. The continuum of cancer immunosurveillance: prognostic, predictive, and mechanistic signatures. Immunity 2013; 39:11-26; PMID:23890060; http://dx.doi.org/10.1016/j.immuni.2013.07.008
- Shankaran V, Ikeda H, Bruce AT, White JM, Swanson PE, Old LJ, Schreiber RD. IFNgamma and lymphocytes prevent primary tumour development and shape tumour immunogenicity. Nature 2001; 410:1107-11; PMID:11323675; http://dx.doi.org/10.1038/35074122
- Regis G, Pensa S, Boselli D, Novelli F, Poli V. Ups and downs: the STAT1:STAT3 seesaw of Interferon and gp130 receptor signalling. Semin Cell Dev Biol 2008; 19:351-9; PMID:18620071; http://dx.doi.org/10.1016/j.semcdb.2008.06.004
- Zheng Y, Valdez PA, Danilenko DM, Hu Y, Sa SM, Gong Q, Abbas AR, Modrusan Z, Ghilardi N, de Sauvage FJ et al. Interleukin-22 mediates early host defense against attaching and effacing bacterial pathogens. Nat Med 2008; 14:282-9; PMID:18264109; http://dx.doi.org/10.1038/nm1720
- Schreiber RD, Old LJ, Smyth MJ. Cancer immunoediting: integrating immunity's roles in cancer suppression and promotion. Science 2011; 331:1565-70; PMID:21436444; http://dx.doi.org/10.1126/science.1203486
- Kiuchi N, Nakajima K, Ichiba M, Fukada T, Narimatsu M, Mizuno K, Hibi M, Hirano T. STAT3 is required for the gp130-mediated full activation of the c-myc gene. J Exp Med 1999; 189:63-73; PMID:9874564; http://dx.doi.org/10.1084/jem.189.1.63
- Alonzi T, Newton IP, Bryce PJ, Di Carlo E, Lattanzio G, Tripodi M, Musiani P, Poli V. Induced somatic inactivation of STAT3 in mice triggers the development of a fulminant form of enterocolitis. Cytokine 2004; 26:45-56; PMID:15050604; http://dx.doi.org/10.1016/j.cyto.2003.12.002
- Melillo JA, Song L, Bhagat G, Blazquez AB, Plumlee CR, Lee C, Berin C, Reizis B, Schindler C. Dendritic cell (DC)-specific targeting reveals Stat3 as a negative regulator of DC function. J Immunol 2010; 184:2638-45; PMID:20124100; http://dx.doi.org/10.4049/jimmunol.0902960
- Kujawski M, Kortylewski M, Lee H, Herrmann A, Kay H, Yu H. Stat3 mediates myeloid cell-dependent tumor angiogenesis in mice. J Clin Invest 2008; 118:3367-77; PMID:18776941; http://dx.doi.org/10.1172/JCI35213
- Bailey SR, Nelson MH, Himes RA, Li Z, Mehrotra S, Paulos CM. Th17 cells in cancer: the ultimate identity crisis. Front Immunol 2014; 5:276; PMID:24987392; http://dx.doi.org/10.3389/fimmu.2014.00276
- Sundrud MS, Trivigno C. Identity crisis of Th17 cells: many forms, many functions, many questions. Semin Immunol 2013; 25:263-72; PMID:24239567; http://dx.doi.org/10.1016/j.smim.2013.10.021
- Angell H, Galon J. From the immune contexture to the Immunoscore: the role of prognostic and predictive immune markers in cancer. Curr Opin Immunol 2013; 25:261-7; PMID:23579076; http://dx.doi.org/10.1016/j.coi.2013.03.004
- Kortylewski M, Yu H. Role of Stat3 in suppressing anti-tumor immunity. Curr Opin Immunol 2008; 20:228-33; PMID:18479894; http://dx.doi.org/10.1016/j.coi.2008.03.010
- Mittal D, Gubin MM, Schreiber RD, Smyth MJ. New insights into cancer immunoediting and its three component phases–elimination, equilibrium and escape. Curr Opin Immunol 2014; 27:16-25; PMID:24531241; http://dx.doi.org/10.1016/j.coi.2014.01.004
- See AP, Han JE, Phallen J, Binder Z, Gallia G, Pan F, Jinasena D, Jackson C, Belcaid Z, Jeong SJ et al. The role of STAT3 activation in modulating the immune microenvironment of GBM. J Neuro-Oncol 2012; 110:359-68; PMID:23096132; http://dx.doi.org/10.1007/s11060-012-0981-6
- Wei J, Barr J, Kong LY, Wang Y, Wu A, Sharma AK, Gumin J, Henry V, Colman H, Priebe W et al. Glioblastoma cancer-initiating cells inhibit T-cell proliferation and effector responses by the signal transducers and activators of transcription 3 pathway. Mol Cancer Ther 2010; 9:67-78; PMID:20053772; http://dx.doi.org/10.1158/1535-7163.MCT-09-0734
- Albesiano E, Davis M, See AP, Han JE, Lim M, Pardoll DM, Kim Y. Immunologic consequences of signal transducers and activators of transcription 3 activation in human squamous cell carcinoma. Cancer Res 2010; 70:6467-76; PMID:20682796; http://dx.doi.org/10.1158/0008-5472.CAN-09-4058
- Ernst M, Putoczki TL. Molecular pathways: IL11 as a tumor-promoting cytokine-translational implications for cancers. Clin Cancer Res 2014; 20:5579-88; PMID:25074610; http://dx.doi.org/10.1158/1078-0432.CCR-13-2492
- Lee H, Deng J, Kujawski M, Yang C, Liu Y, Herrmann A, Kortylewski M, Horne D, Somlo G, Forman S et al. STAT3-induced S1PR1 expression is crucial for persistent STAT3 activation in tumors. Nat Med 2010; 16:1421-8; PMID:21102457; http://dx.doi.org/10.1038/nm.2250
- Liang J, Nagahashi M, Kim EY, Harikumar KB, Yamada A, Huang WC, Hait NC, Allegood JC, Price MM, Avni D et al. Sphingosine-1-phosphate links persistent STAT3 activation, chronic intestinal inflammation, and development of colitis-associated cancer. Cancer Cell 2013; 23:107-20; PMID:23273921; http://dx.doi.org/10.1016/j.ccr.2012.11.013
- Ichiba M, Nakajima K, Yamanaka Y, Kiuchi N, Hirano T. Autoregulation of the Stat3 gene through cooperation with a cAMP-responsive element-binding protein. J Biol Chem 1998; 273:6132-8; PMID:9497331; http://dx.doi.org/10.1074/jbc.273.11.6132
- Debnath B, Xu S, Neamati N. Small molecule inhibitors of signal transducer and activator of transcription 3 (Stat3) protein. J Med Chem 2012; 55:6645-68; PMID:22650325; http://dx.doi.org/10.1021/jm300207s
- Pernot S, Terme M, Voron T, Colussi O, Marcheteau E, Tartour E, Taieb J. Colorectal cancer and immunity: what we know and perspectives. World J Gastroenterol 2014; 20:3738-50; PMID:24833840; http://dx.doi.org/10.3748/wjg.v20.i14.3738
- Alonzi T, Maritano D, Gorgoni B, Rizzuto G, Libert C, Poli V. Essential role of STAT3 in the control of the acute-phase response as revealed by inducible gene inactivation [correction of activation] in the liver. Mol Cell Biol 2001; 21:1621-32
- Clausen BE, Burkhardt C, Reith W, Renkawitz R, Forster I. Conditional gene targeting in macrophages and granulocytes using LysMcre mice. Transgenic Res 1999; 8:265-77; PMID:10621974; http://dx.doi.org/10.1023/A:1008942828960
- Putz EM, Prchal-Murphy M, Simma OA, Forster F, Koenig X, Stockinger H, Piekorz RP, Freissmuth M, Muller M, Sexl V et al. PI3Kdelta is essential for tumor clearance mediated by cytotoxic T lymphocytes. PLoS One 2012; 7:e40852; PMID:22808277; http://dx.doi.org/10.1371/journal.pone.0040852
- Smyth GK, Michaud J, Scott HS. Use of within-array replicate spots for assessing differential expression in microarray experiments. Bioinformatics 2005; 21:2067-75; PMID:15657102; http://dx.doi.org/10.1093/bioinformatics/bti270
- Hochberg Y, Benjamini Y. More powerful procedures for multiple significance testing. Stat Med 1990; 9:811-8; PMID:2218183; http://dx.doi.org/10.1002/sim.4780090710
- Zhang B, Horvath S. A general framework for weighted gene co-expression network analysis. Stat Appl Genet Mol Biol 2005; 4: pp. 1–43; PMID:16646834; http://dx.doi.org/10.2202/1544-6115.1128
- Ashburner M, Ball CA, Blake JA, Botstein D, Butler H, Cherry JM, Davis AP, Dolinski K, Dwight SS, Eppig JT et al. Gene ontology: tool for the unification of biology. The gene ontology consortium. Nat Genet 2000; 25:25-9; PMID:10802651; http://dx.doi.org/10.1038/75556