
Abstract
There is increased production of plasmacytoid dendritic cells (pDCs) in the bone marrow (BM) of multiple myeloma (MM) patients and these favor Th22 cell differentiation. Here, we found that the frequency of interleukin (IL)-22+IL-17−IL-13+ T cells is significantly increased in peripheral blood (PB) and BM of stage III and relapsed/refractory MM patients compared with healthy donors and patients with asymptomatic or stage I/II disease. Th22 cells cloned from the BM of MM patients were CCR6+CXCR4+CCR4+CCR10− and produced IL-22 and IL-13 but not IL-17. Furthermore, polyfunctional Th22-Th2 and Th22-Th1 clones were identified based on the co-expression of additional chemokine receptors and cytokines (CRTh2 or CXCR3 and IL-5 or interferon gamma [IFNγ], respectively). A fraction of MM cell lines and primary tumors aberrantly expressed the IL-22RA1 and IL-22 induced STAT-3 phosphorylation, cell growth, and resistance to drug-induced cell death in MM cells. IL-13 treatment of normal BM mesenchymal stromal cells (MSCs) induced STAT-6 phosphorylation, adhesion molecule upregulation, and increased IL-6 production and significantly favored MM cell growth compared with untreated BM MSCs. Collectively, our data show that increased frequency of IL-22+IL-17−IL-13+ T cells correlates with poor prognosis in MM through IL-22 and IL-13 protumor activity and suggest that interference with IL-22 and IL-13 signaling pathways could be exploited for therapeutic intervention.
Introduction
Multiple myeloma (MM) is a plasma cell neoplastic disorder.Citation1,2 It usually evolves from a monoclonal gammopathy of undetermined clinical significance (MGUS) that progresses to smoldering MM (SMM) and, eventually, to symptomatic MM. Newly diagnosed MM patients generally respond to therapy: however, they eventually relapse and become refractory to treatment.Citation1,3-5 Thus, identification of new targetable factors mediating disease progression is needed.
The primary localization of MM is the BM, where interactions between neoplastic and surrounding cells (i.e., MSCs, immune cells, endothelial cells, osteoblasts, and osteoclasts) are believed to mediate disease development and progression.Citation6,7
The distinctive effector functions of tumor-infiltrating CD4+ T cells shift disease prognosis toward regression or promotion, depending on the different T helper (Th) cell subsets.Citation8,9 Indeed, interferon gamma (IFNγ)-secreting Th1 cells are antitumorCitation8-10 whereas interleukin (IL)–4, IL–5, and IL-13-secreting Th2 and T regulatory (Treg) cells are primarily protumor.Citation8,9,11 More debated is the role of Th17 cells (i.e., cells secreting IL-17 and IL-22) that depends on the tumor model.Citation8,9
CD4+ T cells in MM have not been extensively studied. T cells of newly diagnosed MM patients did not exhibit detectable IFNγ secretion in response to the autologous tumor.Citation12,13 However, they could be reactivated to secrete IFNγ in vitro with either autologous tumor-loaded dendritic cells (DCs)Citation12 or anti-CD3/anti-CD28 antibodies (Abs).Citation13 Th17 cells were found to be increased in the BM compared with the PB of MM patients.Citation14-16 IL-17 supported MM cell proliferation and induced immunosuppression,Citation16 and levels of Th17-related cytokines significantly correlated with the extent of bone disease.Citation15 More recently, long-term survival in MM has been associated with a favorable Treg/Th17 cell ratio.Citation17
Recently, a new subset of CD4+ T cells secreting IL-22 independently of IL-17 has been identified (i.e., Th22).Citation18-21 Th22 cells increase during bacterial infections and accumulate in inflammatory skin disorders.Citation22 Little is known on the role of Th22 cells in tumor immunity: IL–22-secreting CD4+ T cells were found in malignant pleural effusion,Citation23 pancreatic cancer,Citation24 colorectal cancer,Citation25 and in gastric cancer where their presence correlated with a poor prognosis.Citation26
Th22 differentiation requires tumor necrosis factor α (TNFα) and IL-6, and pDCs drive Th22 polarization through secretion of those cytokines.Citation18 Interestingly, pDCs were found to be increased in the BM of MM patients compared with normal donors.Citation27 As naïve T-cell priming may occur in the BMCitation28 and pDCs are present in discrete amounts in the BM of MM patients,Citation27 here we investigated the presence and the role of Th22 cells in MM.
Results
IL-22+IL-17−IL-13+ T cells increase in PB and BM of MM patients with stage III at diagnosis and relapsed/refractory disease
We analyzed PBMCs and BMMCs from patients with MGUS, SMM, and MM at diagnosis or relapsed/refractory disease for ex vivo cytokine (IL-22, IL-17, IL-13, IFNγ, and TNFα) expression by intracellular cytokine staining (ICS) and compared the results with those obtained from healthy donors. Patient characteristics are summarized in and . We found that the percentage of IL–22-secreting T cells significantly increased in the PB of MM patients () and BM of asymptomatic and symptomatic MM patients (), when compared with healthy donors. Next, to exclude Th17 cells, we focused on IL-22+IL-17− gated cells (, R1 gate) and studied the expression of additional cytokines (, R2 (R1) gate), possibly correlated with the Th22 phenotype (i.e., IL-13 and TNFα).Citation19 We found that, in both PB and BM, percentages of IL-22+IL-17−IL-13+ cells were significantly increased in relapsed/refractory patients compared with healthy donors and patients with asymptomatic disease (). Notably, when newly diagnosed patients were stratified according to the International Staging System (ISS),Citation29 the percentage of IL-22+IL-17−IL-13+ T cells in the BM was significantly higher in stage III compared with stage I/II patients (). Furthermore, IL-22+IL-17−IL-13+ T cells were significantly increased in patients with relapsed/refractory MM compared with stage I/II, but not with stage III, disease. No significant difference was observed between stage I/II and asymptomatic disease (). The frequency of IL-22+IL-17−IFNγ+ T cells did not significantly differ between stage I/II and III patients in both PB and BM (data not shown). The vast majority of IL–22-secreting T cells co-expressed TNFα ().
Table 1. Characteristics of the patients
Table 2. Previous therapies of relapsed/refractory patients
Figure 1 (see previous page). IL-22+IL-17−IL-13+ CD3+ T cells are increased in the PB and BM of MM patients with poor prognosis. Tukey plots of cumulative results (A, B, D, and E) and dot-plots of representative data from cytokine-ICS analyses (A [left], B [left], C, and F). (A) Analysis for IL-22 expression was conducted on CD3+ cells (left, representative of PBMCs of patient #356). Percentage of IL-22+ T cells in PB of healthy donors (n = 15), MGUS+SMM (n = 11), MM at diagnosis (n = 20), and relapsed/refractory MM (n = 9). (B) Analysis for IL-22 expression was conducted on CD3+ cells (left, representative of BMMCs of patient #356). Percentage of IL-22+ T cells in the BM of healthy donors (n = 4), MGUS+SMM (n = 9), MM at diagnosis (n = 18), and relapsed/refractory MM (n = 14). (C) Representative ICS of PBMCs and BMMCs of patient #177. Top: IL-22 and IL-17 expression. Bottom: IL-22 and IL-13 expression. Gate of IL-22+IL-17− (R1) cells was used for analysis of IL-22+IL-17−IL-13+ cells (R2). (D) Percentage of IL-22+IL-17−IL-13+ T cells in PB of healthy donors (n = 15), MGUS+SMM (n = 11), MM at diagnosis divided into stage I+II (n = 13) and stage III (n = 7) and relapsed/refractory MM (n = 9). (E) Percentage of IL-22+IL-17-IL-13+ T cells in BM aspirates of healthy donors (n = 4), MGUS+SMM (n = 9), MM at diagnosis divided into stage I+II (n = 11) and stage III (n = 7) and relapsed/refractory MM (n = 14). Responses significantly different by the Mann–Whitney U test are indicated as: *, P < 0.05 and **, 0.001 < P < 0.01. (F) Representative ICS for IL-22 and TNFα expression in PBMCs (left) and BMMCs (right) of patient #177.
![Figure 1 (see previous page). IL-22+IL-17−IL-13+ CD3+ T cells are increased in the PB and BM of MM patients with poor prognosis. Tukey plots of cumulative results (A, B, D, and E) and dot-plots of representative data from cytokine-ICS analyses (A [left], B [left], C, and F). (A) Analysis for IL-22 expression was conducted on CD3+ cells (left, representative of PBMCs of patient #356). Percentage of IL-22+ T cells in PB of healthy donors (n = 15), MGUS+SMM (n = 11), MM at diagnosis (n = 20), and relapsed/refractory MM (n = 9). (B) Analysis for IL-22 expression was conducted on CD3+ cells (left, representative of BMMCs of patient #356). Percentage of IL-22+ T cells in the BM of healthy donors (n = 4), MGUS+SMM (n = 9), MM at diagnosis (n = 18), and relapsed/refractory MM (n = 14). (C) Representative ICS of PBMCs and BMMCs of patient #177. Top: IL-22 and IL-17 expression. Bottom: IL-22 and IL-13 expression. Gate of IL-22+IL-17− (R1) cells was used for analysis of IL-22+IL-17−IL-13+ cells (R2). (D) Percentage of IL-22+IL-17−IL-13+ T cells in PB of healthy donors (n = 15), MGUS+SMM (n = 11), MM at diagnosis divided into stage I+II (n = 13) and stage III (n = 7) and relapsed/refractory MM (n = 9). (E) Percentage of IL-22+IL-17-IL-13+ T cells in BM aspirates of healthy donors (n = 4), MGUS+SMM (n = 9), MM at diagnosis divided into stage I+II (n = 11) and stage III (n = 7) and relapsed/refractory MM (n = 14). Responses significantly different by the Mann–Whitney U test are indicated as: *, P < 0.05 and **, 0.001 < P < 0.01. (F) Representative ICS for IL-22 and TNFα expression in PBMCs (left) and BMMCs (right) of patient #177.](/cms/asset/dd04e769-eaef-40d3-a5b7-39867d418bd3/koni_a_1005460_f0001_c.jpg)
Collectively, increased frequency in PB and BM of IL–22-secreting T cells co-expressing IL-13 but not IL-17 is a feature of MM patients with poor prognosis.
Th22 clones can be propagated from BM and PB of poor prognosis MM patients
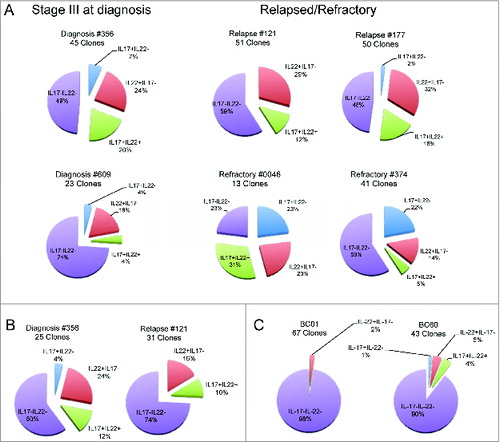
To further deepen our understanding of the characteristics of IL-22+IL-17−IL-13+ T cells, we focused on CD4+ T cells. To this aim, we sorted CD3+CD4+CCR6+ T cells from the BM of 6 MM patients (#356, #609, #121, #177, #0046, and #374), the PB of 2 MM patients (#356 and #121), and 2 healthy donors (BC01 and BC60). CCR6 is a chemokine receptor for CCL20 expressed primarily on Th17, Th22, and subsets of Th1 cells.Citation30 CD4+CCR6+ cells were cloned immediately (#609, #177, #0046, and #374) or after short in vitro expansion (#356, #121, BC01, and BC60) and growing clones were screened based on their IL-22 and/or IL-17 production. Although the clonal efficiency was inferior when cloning was done immediately after sorting compared with the one conducted after in vitro expansion (see legend to ), the percentages of IL-22+IL-17− (Th22) clones obtained from the BM (24.7 ± 2.1%, mean ± SE) () and PB (21 ± 5%) () of the patients were much higher than the ones obtained from the PB of the healthy donors (3.5 ± 1.5%) ().
Figure 2. Distribution of CD4+CCR6+ T-cell clones based on the profile of IL-22 and IL-17 secretion. Cake graphs of percentages of IL-22+IL-17− (red slices), IL-22+IL-17+ (light blue slices), IL-22−IL-17+ (green slices), and IL-22−IL-17− (violet slices) clones obtained from the (A) BM of MM patients (B) and PB of MM patients, and (C) healthy donors. Clonal efficiencies for cloning conducted after in vitro expansion were (A) 48.2% and 55.6% for BM of patients #356 and #121, respectively and (B) 25.4% and 21.1% for PB of the same patients, respectively. (C) Clonal efficiencies for PB of healthy donors were 45.8% and 76.9% for BC01 and BC60, respectively. Clonal efficiencies for cloning conducted immediately after sorting were 4%, 11.9%, 2.3%, and 7.6% for BM of patients #609, #177, #0046, and #374, respectively (A). For patient characteristics, see .
We further characterized Th22-growing clones from the BM of MM patients. All clones expressed CCR6, CXCR4 (BM homing receptor), and, in most cases, CCR4 (expressed on subsets of Th2 cells and skin-homing Th22 cells)Citation18-20 although they did not express CCR10 (reported on circulating and skin-homing Th22 cells)Citation18-20 (). All clones produced IL-22 and, although at different levels, IL-13 but not IL-17 () and TNFα (data not shown). In addition, we found clones co-producing IFNγ (Th22-Th1) () or IL-5 (Th22-Th2) (). In agreement with the secretion data, Th22-Th1 clones expressed CXCR3 () and Th22-Th2 clones expressed CRTh2 (), whereas Th22 clones secreting neither IFNγ nor IL-5 did not co-express either CXCR3 or CRTh2 ().
Figure 3. Chemokine receptor and cytokine profile of Th22 clones from the BM of MM patients. (A) Surface expression of CCR6, CXCR4, CCR4, and CCR10. (Left) Representative histograms: isotype control staining (solid gray), chemokine receptor-specific staining (black line). (Right) RFI (i.e., fold increase in mean fluorescence intensity relative to isotype control) calculated for each clone. (B, D, and F) Cumulative cytokine secretion by clones from different MM patients represented as Whisker plots. (B) Th22 clones (n = 4). (D) Th22-Th1 clones (n = 8). (F) Th22-Th2 clones (n = 10). (C-E-G) (Left and middle) Analysis of CXCR3 and CRTh2 expression in one representative Th22 (C), Th22-Th1 (E), and Th22-Th2 (G) clone, respectively. Dot plots (left and middle upper) and histograms (middle lower) from representative clones are shown. (Right) Cumulative RFI of paired CXCR3 and CRTh2 staining calculated for each clone.
Collectively, Th22 clones with peculiar expression of chemokine receptors and cytokine secretion profiles were isolated from the BM of poor prognosis MM patients.
IL-22RA1 is expressed in a fraction of MM cell lines and primary tumors
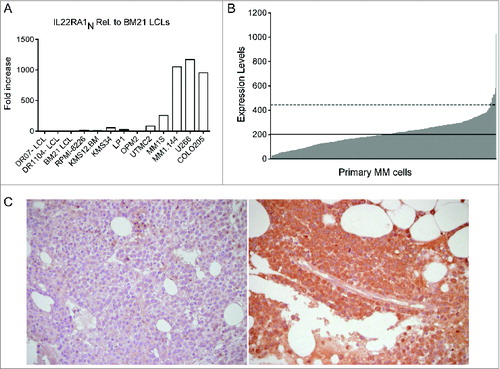
The IL-22 receptor is composed of 2 subunits, IL-22RA1 and IL-10R2.Citation31 Although IL-10R2 is ubiquitously expressed, the IL-22RA1 subunit is restricted to non-haematopoietic cells.Citation22 Aberrant expression of IL-22RA1 was found in lymphoma cells.Citation32,33 Looking for potential targets of IL-22 in the context of BM, we first analyzed MM cell lines and found IL-22RA1 mRNA expression in approximately one third whereas, as expected, the Epstein–Barr virus-transformed B lymphoblastoid cell lines (LCLs) were negative for their expression (). Second, to define the distribution of IL-22RA1 expression in primary MM cells, we interrogated a large dataset of gene expression profiles derived from 414 MM patients at diagnosis.Citation34 Remarkably, the expression pattern across MM patients did not follow a normal distribution (P < 0.0001), but there was a subset presenting robust IL-22RA1 overexpression (). Importantly, as a proof of principle, we confirmed IL-22RA1 protein expression in primary tumors by immunohistochemistry ().
Figure 4. IL-22RA1 is expressed in a fraction of MM cell lines and primary tumors. (A) mRNA expression of IL-22RA1 in MM cell lines. COLO205 cells were positive controls. Epstein–Barr virus-transformed B lymphoblastoid cell lines (LCLs) were negative controls. (B) mRNA expression of IL-22RA1 in primary MM cells of a cohort of 414 newly diagnosed patients described in ref. 34. The expression pattern for the probe set 220056_at is shown. Continued line: median. Dotted line: 2× standard deviation. (C) IL-22RA1 protein expression in BM biopsies from MM patients #121 (negative) (left) and #177 (positive) (right). Images were acquired at a ×40 magnification.
Collectively, these data strongly suggest that IL-22RA1 expression is profoundly dysregulated in a subset of MM patients.
IL-22 promotes STAT-3 phosphorylation, cell growth, and resistance to drug-induced cell death in IL-22RA1+ MM cells
Binding of IL-22 to its receptor induces a cascade of signaling pathways, including STAT-1, STAT-3, and STAT-5 phosphorylation.Citation22,31 Accordingly, IL-22 induced STAT-3, similarly to IL-6, and slightly STAT-1 phosphorylation in IL-22RA1+ but not IL-22RA1− MM cells (). IL–22-induced STAT-3 phosphorylation was specifically inhibited by an anti-IL-22 Ab to 100%, when using the recombinant protein (, left), and to approximately 50%, when using Th22 clone supernatants (, right). STAT-5 phosphorylation was not induced (data not shown).
Figure 5 (see previous page). IL-22 induces MM cell activation, proliferation, and resistance to drug-induced cell death. (A) Representative staining for phosphorylated STAT-1 and STAT-3 (n = 6). MM1S are representative of IL–22RA1-positive cells, KMS34 for low/absent IL-22RA1 expression. IL-6 and IFNγ were positive controls for phosphorylated STAT-3 and STAT-1, respectively; unstimulated cells (gray line) and cytokine-stimulated cells (black line). (B) Cumulative percentage of induction of STAT-3 phosphorylation by recombinant IL-22 (left) and supernatants of Th22 clones (i.e., C37 and 374-19) (right) in the presence of anti-IL-22 or isotype control antibodies (Abs). Recombinant IL-22 was used at 20 ng/mL. IL-22 measured in the supernatants was 20 and 26.5 ng/mL for clone C37 and clone 374-19, respectively. (C and D) 3H-thymidine incorporation of MM cells cultured in the absence (nil) or in the presence of IL-22 (50 ng/mL) or IL-6 (50 ng/mL) in IL–22RA1-positive (C) and -negative (D) cells. Representative data from 1 of 4 independent experiments are depicted for each cell line. (E) Percentages of dying MM cells after (i) 24-h incubation with Dx in the absence (nil) or presence of IL-22 (20 ng/mL) or IL-6 (20 ng/mL) and in the presence of anti-IL-22 or isotype control Abs (2.5 μg/mL); (ii) 48-h incubation with Ln; and (iii) 24-h incubation with Ln followed by 24-h incubation with both drugs in the absence or the presence of IL-22 or IL-6 and in the presence of anti-IL-22 or isotype control Abs (n = 2). (F) WB of phosphorylated (p) p38, p38, pERK1/2, ERK1/2, pAKT, and AKT in MM1S untreated or treated with IL-22 or IL-6, as indicated. (G) pp38 data were quantified by densitometric analysis, normalized using p38, and divided by the value of untreated cells (Arbitrary Units, A.U.). (H) WB analysis of Mcl-1, Bcl-2, Bcl-XL, and cleaved PARP and caspase-3 in MM1S untreated or treated with IL-22 or IL-6 and in the absence or in the presence of Dx, as indicated (n = 2). A.U. were calculated as in (G), using β-tubulin (βTUB) for normalization, and are reported at the bottom of the lanes. IL-6 was used throughout as the positive control. Significant values calculated with the Mann–Whitney U test (C and D) or unpaired, one-tailed Student's t-test (E) are indicated as: *, P < 0.05; **, 0.001 < P < 0.01; and ***, P < 0.001.
STAT-3 phosphorylation activates signaling pathways of cell growth and survival.Citation35 Firstly, we analyzed the effect of IL-22 on MM cell growth: IL-22 treatment increased proliferation of IL-22RA1+ MM cells at levels comparable with IL-6 (). Conversely, IL-22RA1− cells significantly increased proliferation in response to IL-6 but not to IL-22 (). Secondly, we tested whether co-treatment with IL-22 impacted on cell survival when MM cells were treated with dexamethasone (Dx) or lenalidomide (Ln) or a combination of both. As expected, IL-6 induced resistance to Dx-induced cell death () and Ln-induced cell death (Fig. S1). Importantly, the percentage of dying cells was significantly reduced when MM1S cells were co-treated with the drugs (Dx and Ln as single agents or the combination) and IL-22, supporting a role for IL-22 in resistance to drug-induced cell death ( and Fig. S1). The prosurvival effects of IL-22 were inhibited in the presence of an anti-IL-22 Ab ( and Fig. S1).
To investigate the molecular mechanisms responsible for IL-22 effects on MM cells, we analyzed by Western blotting (WB) several known growth and anti-apoptotic factors. We found modest but significant increases of p38 activation in IL–22-treated MM1S cells compared with untreated MM1S cells although we did not observe activation of ERK1/2 and AKT over the basal level (). Different from IL-22, IL-6 mostly induced activation of ERK1/2 (). Next, we analyzed the expression of key anti-apoptotic factors in untreated or Dx-treated MM1S cells (). We found high basal levels of Bcl-2 and Bcl-XL that were not modulated either by IL-22 or Dx. On the contrary, Mcl-1 levels increased when MM1S cells were co-treated with Dx and IL-22. Furthermore, WB analysis of the apoptotic cleavage of caspase-3 and PARP confirmed the protective effect of IL-22 on Dx-induced apoptosis in MM1S cells. The effect of IL-22 was particularly evident in the band corresponding to cleaved caspase-3 that was barely detectable in untreated cells while becoming strongly evident after Dx treatment. IL-6 showed similar results.
Collectively, we showed that the IL-22RA1 aberrantly expressed on MM cells is functional and that treatment of IL-22RA1+ MM cells with IL-22 increases both cell growth through p38 activation and resistance to drug-induced cell death through increased Mcl-1 expression and inhibition of drug-induced caspase-3 activation.
IL-13 promotes BM-MSC activation and function
As IL-13 secretion is a relevant feature of Th22 cells, we investigated its possible role and related cell target(s) in MM. Adherence of MM cells to BM-MSCs, through adhesion molecules, favors tumor cell growth.Citation1,2 IL-13 upregulates VCAM-1 expression on endothelial cellsCitation36 and increases the expression of adhesion molecules and IL-6 secretion in lung fibroblasts,Citation37 suggesting BM-MSCs as a target candidate for IL-13 in MM. We generated and characterized short-term primary BM-MSC cell lines from 3 healthy donors (Fig. S2). As shown in , we found that treatment of BM-MSCs with IL-13 induced STAT-6 phosphorylation () that was completely abolished by an anti-IL-13 Ab in the case of recombinant IL-13 (, left) and significantly reduced (∼80%) when induced by Th22 clone supernatants (, right). IL-13 induced adhesion molecule upregulation () and IL-6 production (, left) that was inhibited in the presence of an anti-IL-13 Ab (, right). Importantly, when IL–13-treated BM-MSCs were co-cultured with MM cells, we found that they significantly increased MM cell growth compared with untreated BM-MSCs ().
Figure 6. IL-13 induces BM-MSC activation and adhesion molecule upregulation, enhances IL-6 production and IL–13-treated BM-MSCs favor MM cell proliferation. (A) Representative staining for phosphorylated STAT-6 (n = 3). TNFα was used as negative control. Unstimulated cells (gray line) and cytokine-stimulated cells (black line). (B) Cumulative percentage of induction of STAT-6 phosphorylation by recombinant IL-13 (left) and the supernatants of Th22 clones (i.e., A15 and 05.08) (right) in the presence of anti-IL-13 or isotype control Abs. Recombinant IL-13 was used at 10 ng/mL. Clone A15 supernatant (IL-13 = 90 ng/mL) was used diluted (1:10) and clone 05.08 supernatant (IL-13 = 15 ng/mL) was used undiluted. (C) Representative VCAM-1 and ICAM-1 expression on untreated (nil) or IL–13-treated BM-MSCs (n = 2). TNFα and IFNγ were positive controls. (D, left) Representative IL-6 secretion by untreated (-IL-13, white bars) or treated (+IL-13, gray bars) BM-MSCs in the absence or in the presence of MM1S cells (n = 3). (D, right) Effect of addition of anti-IL-13 or isotype control Abs on IL-6 secretion by BM-MSCs. (E) Representative MM1S cell proliferation in the presence of untreated (-IL-13, white bars) or IL-13 (+IL-13, gray bars)-treated BM-MSCs (n = 3). IL-13 in (D) and (E) was used at 50 ng/mL. Responses significantly different are indicated as: *, P < 0.05 and ***, P < 0.001 (determined by paired, one-tailed Student's t-test).
Collectively, these results strongly support a role for IL-13 in favoring MM progression through upregulation of adhesion molecules and IL-6 secretion by BM-MSCs that ultimately fosters MM cell growth.
Discussion
In this study, we report that: (1) the frequency of IL-22+IL-17−IL-13+ T cells is increased in both PB and BM of MM patients with poor prognosis, (2) Th22 cells with a cytokine profile similar to those of IL-22+IL-17−IL-13+ T cells can be cloned from the BM and PB of these patients, and (3) IL-22 and IL-13 directly and indirectly, through BM-MSC activation, increase MM cells proliferation and resistance to drug-induced cell death. Collectively, these data strongly support a role for Th22 cells in MM aggressiveness and progression.
Th22 cells were recently identified as a separate Th cell lineageCitation18-21; however, their phenotypic and functional features have not been uniquely defined. Previous reportsCitation18-20,38 have described the features of Th22 clones from PB of healthy donors,Citation18,19 skin biopsies of patients with inflammatory skin diseases,Citation20 and ocular samples from patients with active uveitis.Citation38 Similarly to these clones, we found that Th22 clones from the BM of MM patients were CD4+CCR6+ CCR4+ and produced IL-22 but not IL-17. In addition, they produced IL-13, as Th22 cells isolated from the PB of healthy donors,Citation19 and TNFα, as Th22 cells isolated from inflammatory skin and ocular aqueous humor.Citation19,20,38 However, unlike the Th22 clones described so far, Th22 clones from the BM of MM patients did not express CCR10 but the BM homing receptor CXCR4. The majority of Th22 clones appear polyfunctional: the relative relevance of Th22-Th2 and Th22-Th1 cells in MM progression will need further investigation.
A major finding of our work is the significant correlation between frequency of IL-22+IL-17−IL-13+ T cells in the PB and BM of MM patients and clinical features of poor prognosis. IL-22 represents an effector molecule in innate immunity, tissue damage protection, and repair.Citation22,39,40 IL-22 involvement in cancer is an ultimate clue.Citation41 In agreement with the pattern of the IL-22RA1 expression on epithelial cells and, aberrantly, lymphoma cells, IL-22 signaling through STAT-3 phosphorylation was demonstrated in colon,Citation42 lung,Citation43 hepatocellular,Citation44 and pancreaticCitation45 cancer cells and lymphoma cells.Citation32,33 The signaling pathway downstream of IL–22-induced STAT-3 phosphorylation led to different effector functions depending on the tumor cells: it potentiated the expression of inducible nitric oxide synthase in colon cancer,Citation42 showed anti-apoptotic effects in lungCitation43 and pancreatic cancer cell linesCitation45 and hepatocellular carcinoma,Citation44 stimulated production of vascular endothelial growth factor (VEGF) in pancreatic cancer cell lines,Citation45 increased expression of stemness genes in colorectal cancer,Citation25 and induced cell proliferation in lymphoma cells.Citation32,33
In our study, we found that IL-22 increased MM cell growth and protected them from drug-induced cell death. These data suggest that, in a fraction of MM patients with worse prognosis (i.e., patients with increased frequencies of BM-homing Th22 cells and aberrant IL-22RA1 expression on their tumor), IL-22 may exert an important role in MM aggressiveness/progression through effects ultimately leading to increased tumor burden. Interestingly, increased IL-22 serum levels were recently found in MM patients with active disease.Citation46
Interactions with BM-MSCs enhanced MM cell growth, survival and drug-resistance.Citation1,6,7 TNFα and TGFβ have been reported to upregulate VCAM-1 and ICAM-1 expression and trigger IL-6 secretion in BM-MSCs.Citation47 We add here an important novel contribution of IL-13 in these functions.
Other cytokines produced by Th22 clones are IFNγ and IL-5 secreted by Th22-Th1 and Th22-Th2 clones, respectively. Future studies are needed to specifically address the potential role of these cytokines in MM progression; however, it is worth mentioning that IFNγ was reported to upregulate IL-22RA1 expression in keratinocytesCitation48 and IL-5 to synergize with IL-6 to support MM cell growth.Citation49,50
Multiple myeloma is characterized by a marked clinical and biological heterogeneity and studies have focused on the identification of prognostic factors reflecting heterogeneity in survival.Citation51-53 A major advance in the stratification of MM patients was achieved with the description and validation of the ISS.Citation29 Despite its highly prognostic value in the clinical practice, it is unable to discriminate subsets of patients with especially good or, on the contrary, poor prognosis or to direct individualized therapeutic strategies. In this respect, accumulation of Th22 cells and aberrant IL-22RA1 expression on MM cells could be employed for identification of patients with worse prognosis possibly suitable for individualized treatments targeting the IL-22/IL-22RA1 and/or IL-13/IL-13RA1 axes.
Materials and Methods
Subjects and samples
Patients with MGUS (n = 5), SMM (n = 9), and MM at diagnosis or with relapsed/refractory disease (n = 23 and n = 14, respectively, for a total of 37 MM patients) were recruited at the Hematology Department of our Institution. The Institutional Ethics Committee had approved the study protocol and written informed consent was obtained from all donors. Blood samples of 15 healthy donors from the Institutional Blood Bank and BM aspirates from 4 healthy donors (AllCells, Life Science Division) were used as controls. PB mononuclear cells (PBMCs) and BM mononuclear cells (BMMCs) were isolated by density gradient centrifugation with Ficoll-PaqueTM Plus (GE Healthcare). Cells were frozen in fetal bovine serum (FBS) (Lonza) 10% dimethyl sulfoxide (DMSO), kept in liquid nitrogen vapors and used after viable thawing.
Cells and culture media
MM cell lines MM1S, MM1.144, OPM2, UTMC2, LP1, KMS34, KMS12.BM, RPMI-8226, and U266 were genotyped and controlled for mycoplasma infection. Control cells were LCLs (DR07-LCL, DR1104-LCL, and BM21) and the colon carcinoma cell line COLO205. MM cells and LCLs were cultured in RPMI-1640 (Lonza), COLO205 cells in Dulbecco's Modified Eagle's Medium (DMEM). BM-MSCs were isolated, as detailed elsewhere,Citation54 and cultured in DMEM. Media were supplemented with penicillin (100 U/mL), streptomycin (100 U/mL), glutamine (2 mmol/L), and 10% FBS. T cells were cultured in x-vivo-15 (Lonza), supplemented with antibiotics and 3% human serum type AB (Lonza) (T-cell-medium).
Flow cytometry analysis
The list of Abs used is reported in Table S1. For ICS, cells were stimulated with phorbol-12-myristate-13-acetate (Sigma-Aldrich) (50 ng/mL) and ionomycin (Sigma-Aldrich) (1 μg/mL) for 5 h. After 2 h, brefeldin A (Sigma-Aldrich) (10 μg/mL) was added. ICS was carried out using a kit from BD Biosciences, according to the manufacturer's instructions. For intracellular phosphorylated-protein staining, cells were stimulated with indicated cytokine concentrations for 15 min at 37 °C, fixed for 10 min at 37 °C with Fixation Buffer (BD CytoFix), permeabilized for 30 min on ice with Perm Buffer III (BD Phosflow), and incubated with Abs. All cytokines were purchased from Peprotech, except for TNFα (R&D Systems). In blocking experiments, IL-22 (20 ng/mL) or IL-13 (10 ng/mL) containing medium or Th22 clone supernatants were first incubated for 1 h at 37 °C with 2.5 or 5 μg/mL anti-IL-22 or anti-IL-13, respectively, or control isotype Abs and then used to stimulate MM cells and BM-MSCs, respectively. Cells were analyzed using a FACSCanto flow cytometer (BD Biosciences) and data were analyzed by FlowJo software (Tree Star Inc.).
CD4+CCR6+ T cells sorting, cloning, propagation, and activation for cytokine release assay
Peripheral blood mononuclear cells from 2 healthy donors (BC01 and BC60), PBMCs from 2 MM patients (#356 and #121), and BMMCs from 6 MM patients (#356, #609, #121, #177, #0046 and #374) were stained with APC-conjugated CD3, FITC-conjugated CD4, and PE-conjugated CCR6 mAbs and CD3+CD4+CCR6+ were purified by cytofluorimentric sorting. Sorted cells from BC01 and BC60 and patients #356 and #121 were cultured for 5 days in T-cell-medium supplemented with IL-2 (25 IU/mL; R&D Systems) and anti-CD28 mAb (5 μg/mL), in anti-CD3 mAb-coated U-bottom 96-well plates (1 μg/well anti-CD3 mAb). After 3 weeks, cells were cloned by limiting dilution (0.5 cells/well) in T–cell-medium containing IL-2 (250 IU/mL) and phytohemagglutinin (PHA) (1 μg/mL; Sigma-Aldrich), on a feeder layer of 40–Gy-irradiated allogenic PBMCs. Sorted cells from patients #609, #177, #0046, and #374 were cloned immediately after sorting. Clones were restimulated every 2–3 weeks, as described earlier. To assess Th-specific cytokine release, T-cell clones were stimulated (1–10 × 104 cells) for 72 h in anti-CD3 Ab (0.5 μg/well)-coated plates and their supernatants were tested by ELISA.
Cytokine release assays
ELISA kits from Mabtech (IFNγ, IL−6, IL−13 and IL-5) and R&D Systems (IL-17 and IL-22) were used, according to the manufacturer's instructions.
Proliferation assay and detection of cell death
Multiple myeloma cell lines were cultured in U-bottom 96-well plates (5 × 10⁴ cells/well) in 5% FBS culture medium with or without IL-22 (50 ng/mL) or IL-6 (50 ng/mL). After 72 h, cultures were pulsed for an additional 16 h with [3H]TdR (1 μCi/well, 6.7 Ci/M; Amersham). Cells were collected with a FilterMat Universal Harvester (Packard Instrument) in specific plates (Unifilter GF/C) and the thymidine incorporated was measured in a liquid scintillation counter (TopCount NXT).
In co-culture experiments, MM1S were seeded in flat-bottom 96-well plates (1 × 10⁵ cells/well) on BM-MSCs previously cultured with or without IL-13 (50 ng/mL) for 24 h. After 24-h co-culture, cells were treated as described earlier.
Cell apoptosis/necrosis was measured in MM1S cells treated with Dx (10 μmol/L) for 24 h or Ln (5 nmol/L) for 48 h without or with IL-6 (20 ng/mL) or IL-22 (20 ng/mL) and without or with anti-IL-22 or isotype control Abs (2.5 μg/mL). In some experiments, before Dx, cells were cultured for 24 h with Ln, total cell death (apoptosis+necrosis) was assessed by the PE Annexin V Apoptosis Detection kit I (BD PharMingen), according to the manufacturer's instructions.
RNA extraction, cDNA generation, and real-time PCR analysis
Total RNA was extracted using the RiboPure kit (Ambion), according to the manufacturer's instructions. Here, 0.5-1 μg RNA was retro-transcribed with the High-Capacity cDNA reverse transcription kit (Applied Biosystems), and 50 ng cDNA was used for real-time PCR. Assays on demand specific for human IL-22RA1 (Hs00222035_m1) and human HPRT1 (Hs01003267_m1) were purchased from Applied Biosystems. Real-time PCR was carried out on an ABI7900HT machine (Applied Biosystems) using the SDS2.1 program for the analysis. Fold induction among samples was calculated by the 2−ΔΔCt method. The IL-22RA1 gene values were normalized with HPRT1 values.
Western blot assay
MM1S cells were (1) left untreated or treated for 30 min with IL-22 (200 ng/mL) or IL-6 (100 ng/mL) or (2) left untreated or treated for 24 h with Dx (1 μmol/L) with or without IL-22 (50 ng/mL) or IL-6 (50 ng/mL). Cells were then lysed in RIPA buffer (Cell Signaling Technology) containing 100 mmol/L phenyl methane sulfonyl fluoride (PMSF), 100 mmol/L dithiothreitol (DTT), and protease inhibitor cocktail (Cell Signaling Technology). The list of Abs used is reported in Table S1.
Immunohistochemistry
Bone marrow biopsy samples were fixed, decalcified, and processed as described in Pruneri et al.Citation55 Slides were deparaffinized and hydrated in a series of graded alcohols to water. Sections were incubated with the anti-IL-22RA1 Ab (1:150 dilution) for 1 h at room temperature, followed by detection with a goat-on-rodent HRP-Polymer Kit (Biocare Medical), development of peroxidase activity with DAB quanto chromogen (Thermo Scientific), and hematoxylin counterstaining (Bio-Optica).
Statistical analysis
Statistical significance was determined with the Mann–Whitney U test and the unpaired, one-tailed Student's t-test. Values with P < 0.05 were considered significant. Gene expression profiling data of primary MM cells were obtained from Zhan et al.Citation34 The probe set utilized for IL-22RA1 expression was 220056_at. Data sets were analyzed by D’Agostino & Pearson and Shapiro Wilk normality tests (Prism software, version 5).
Disclosure of Potential Conflicts of Interest
No potential conflicts of interest were disclosed.
Supplemental Materials
Supplemental data for this article can be accessed on the publisher's website.
1005460_Supplementary_Materials.zip
Download Zip (530.3 KB)Acknowledgments
The authors thank all the subjects participating in the study, Matteo Bellone for critical reading of the manuscript, and Francesca Invernizzi and Fabiana Gullotta for technical support.
Funding
This work was supported by the Italian Association for Cancer Research (AIRC, IG-11353 and IG-11340), the International Association for Cancer Research (AICR), and, for preliminary experiments, the Special Program Molecular Clinical Oncology AIRC 5 per mille (9965).
References
- Palumbo A, Anderson K. Multiple myeloma. N Engl J Med 2011; 364:1046-60; PMID:21410373; http://dx.doi.org/10.1056/NEJMra1011442
- Hideshima T, Mitsiades C, Tonon G, Richardson PG, Anderson KC. Understanding multiple myeloma pathogenesis in the bone marrow to identify new therapeutic targets. Nat Rev Cancer 2007; 7:585-98; PMID:17646864; http://dx.doi.org/10.1038/nrc2189
- Dimopoulos MA, San-Miguel JF, Anderson KC. Emerging therapies for the treatment of relapsed or refractory multiple myeloma. Eur J Haematol 2011; 86:1-15; PMID:20942854; http://dx.doi.org/10.1111/j.1600-0609.2010.01542.x
- Borrello I. Can we change the disease biology of multiple myeloma? Leuk Res 2012; 36(Suppl 1):S3-12; PMID:23176722; http://dx.doi.org/10.1016/S0145-2126(12)70003-6
- Rajkumar SV. Treatment of multiple myeloma. Nat Rev Clin Oncol 2011; 8:479-91; PMID:21522124; http://dx.doi.org/10.1038/nrclinonc.2011.63
- Podar K, Chauhan D, Anderson KC. Bone marrow microenvironment and the identification of new targets for myeloma therapy. Leukemia 2009; 23:10-24; PMID:18843284; http://dx.doi.org/10.1038/leu.2008.259
- Noonan K, Borrello I. The immune microenvironment of myeloma. Cancer Microenviron 2011; 4:313-23; PMID:21866321; http://dx.doi.org/10.1007/s12307-011-0086-3
- Fridman WH, Pages F, Sautes-Fridman C, Galon J. The immune contexture in human tumours: impact on clinical outcome. Nat Rev Cancer 2012; 12:298-306; PMID:22419253; http://dx.doi.org/10.1038/nrc3245
- Protti MP, Monte LD, Lullo GD. Tumor antigen-specific CD4(+) T cells in cancer immunity: from antigen identification to tumor prognosis and development of therapeutic strategies. Tissue Antigens 2014; 83:237-46; PMID:24641502; http://dx.doi.org/10.1111/tan.12329
- Galon J, Costes A, Sanchez-Cabo F, Kirilovsky A, Mlecnik B, Lagorce-Pages C, Tosolini M, Camus M, Berger A, Wind P, et al. Type, density, and location of immune cells within human colorectal tumors predict clinical outcome. Science 2006; 313:1960-4; PMID:17008531; http://dx.doi.org/10.1126/science.1129139
- De Monte L, Reni M, Tassi E, Clavenna D, Papa I, Recalde H, Braga M, Di Carlo V, Doglioni C, Protti MP. Intratumor T helper type 2 cell infiltrate correlates with cancer-associated fibroblast thymic stromal lymphopoietin production and reduced survival in pancreatic cancer. J Exp Med 2011; 208:469-78; PMID:21339327; http://dx.doi.org/10.1084/jem.20101876
- Dhodapkar MV, Krasovsky J, Olson K. T cells from the tumor microenvironment of patients with progressive myeloma can generate strong, tumor-specific cytolytic responses to autologous, tumor-loaded dendritic cells. Proc Natl Acad Sci U S A 2002; 99:13009-13; PMID:12235374; http://dx.doi.org/10.1073/pnas.202491499
- Noonan K, Matsui W, Serafini P, Carbley R, Tan G, Khalili J, Bonyhadi M, Levitsky H, Whartenby K, Borrello I. Activated marrow-infiltrating lymphocytes effectively target plasma cells and their clonogenic precursors. Cancer Res 2005; 65:2026-34; PMID:15753403; http://dx.doi.org/10.1158/0008-5472.CAN-04-3337
- Dhodapkar KM, Barbuto S, Matthews P, Kukreja A, Mazumder A, Vesole D, Jagannath S, Dhodapkar MV. Dendritic cells mediate the induction of polyfunctional human IL17-producing cells (Th17-1 cells) enriched in the bone marrow of patients with myeloma. Blood 2008; 112:2878-85; PMID:18669891; http://dx.doi.org/10.1182/blood-2008-03-143222
- Noonan K, Marchionni L, Anderson J, Pardoll D, Roodman GD, Borrello I. A novel role of IL-17-producing lymphocytes in mediating lytic bone disease in multiple myeloma. Blood 2010; 116:3554-63; PMID:20664052; http://dx.doi.org/10.1182/blood-2010-05-283895
- Prabhala RH, Pelluru D, Fulciniti M, Prabhala HK, Nanjappa P, Song W, Pai C, Amin S, Tai YT, Richardson PG, et al. Elevated IL-17 produced by TH17 cells promotes myeloma cell growth and inhibits immune function in multiple myeloma. Blood 2010; 115:5385-92; PMID:20395418; http://dx.doi.org/10.1182/blood-2009-10-246660
- Bryant C, Suen H, Brown R, Yang S, Favaloro J, Aklilu E, Gibson J, Ho PJ, Iland H, Fromm P, et al. Long-term survival in multiple myeloma is associated with a distinct immunological profile, which includes proliferative cytotoxic T-cell clones and a favourable Treg/Th17 balance. Blood Cancer J 2013; 3:e148; PMID:24036947; http://dx.doi.org/10.1038/bcj.2013.34
- Duhen T, Geiger R, Jarrossay D, Lanzavecchia A, Sallusto F. Production of interleukin 22 but not interleukin 17 by a subset of human skin-homing memory T cells. Nat Immunol 2009; 10:857-63; PMID:19578369; http://dx.doi.org/10.1038/ni.1767
- Trifari S, Kaplan CD, Tran EH, Crellin NK, Spits H. Identification of a human helper T cell population that has abundant production of interleukin 22 and is distinct from T(H)-17, T(H)1 and T(H)2 cells. Nat Immunol 2009; 10:864-71; PMID:19578368; http://dx.doi.org/10.1038/ni.1770
- Eyerich S, Eyerich K, Pennino D, Carbone T, Nasorri F, Pallotta S, Cianfarani F, Odorisio T, Traidl-Hoffmann C, Behrendt H, et al. Th22 cells represent a distinct human T cell subset involved in epidermal immunity and remodeling. J Clin Invest 2009; 119:3573-85; PMID:19920355
- Nograles KE, Zaba LC, Shemer A, Fuentes-Duculan J, Cardinale I, Kikuchi T, Ramon M, Bergman R, Krueger JG, Guttman-Yassky E. IL-22-producing "T22" T cells account for upregulated IL-22 in atopic dermatitis despite reduced IL-17-producing TH17 T cells. J Allergy Clin Immunol 2009; 123:1244-52.e2; PMID:19439349; http://dx.doi.org/10.1016/j.jaci.2009.03.041
- Sonnenberg GF, Fouser LA, Artis D. Functional biology of the IL-22-IL-22R pathway in regulating immunity and inflammation at barrier surfaces. Adv Immunol 2010; 107:1-29; PMID:21034969; http://dx.doi.org/10.1016/B978-0-12-381300-8.00001-0
- Ye ZJ, Zhou Q, Yin W, Yuan ML, Yang WB, Xiang F, Zhang JC, Xin JB, Xiong XZ, Shi HZ. Interleukin 22-producing CD4+ T cells in malignant pleural effusion. Cancer Lett 2012; 326:23-32; PMID:22809567; http://dx.doi.org/10.1016/j.canlet.2012.07.013
- Xu X, Tang Y, Guo S, Zhang Y, Tian Y, Ni B, Wang H. Increased intratumoral interleukin 22 levels and frequencies of interleukin 22-producing CD4+ T cells correlate with pancreatic cancer progression. Pancreas 2014; 43:470-7; PMID:24622082; http://dx.doi.org/10.1097/MPA.0000000000000055
- Kryczek I, Lin Y, Nagarsheth N, Peng D, Zhao L, Zhao E, Vatan L, Szeliga W, Dou Y, Owens S, et al. IL-22(+)CD4(+) T cells promote colorectal cancer stemness via STAT3 transcription factor activation and induction of the methyltransferase DOT1L. Immunity 2014; 40:772-84; PMID:24816405; http://dx.doi.org/10.1016/j.immuni.2014.03.010
- Zhuang Y, Peng LS, Zhao YL, Shi Y, Mao XH, Guo G, Chen W, Liu XF, Zhang JY, Liu T, et al. Increased intratumoral IL-22-producing CD4(+) T cells and Th22 cells correlate with gastric cancer progression and predict poor patient survival. Cancer Immunol Immunother 2012; 61:1965-75; PMID:22527243; http://dx.doi.org/10.1007/s00262-012-1241-5
- Chauhan D, Singh AV, Brahmandam M, Carrasco R, Bandi M, Hideshima T, Bianchi G, Podar K, Tai YT, Mitsiades C, et al. Functional interaction of plasmacytoid dendritic cells with multiple myeloma cells: a therapeutic target. Cancer Cell 2009; 16:309-23; PMID:19800576; http://dx.doi.org/10.1016/j.ccr.2009.08.019
- Feuerer M, Beckhove P, Garbi N, Mahnke Y, Limmer A, Hommel M, Hammerling GJ, Kyewski B, Hamann A, Umansky V, et al. Bone marrow as a priming site for T-cell responses to blood-borne antigen. Nat Med 2003; 9:1151-7; PMID:12910264; http://dx.doi.org/10.1038/nm914
- Greipp PR, San Miguel J, Durie BG, Crowley JJ, Barlogie B, Blade J, Boccadoro M, Child JA, Avet-Loiseau H, Kyle RA, et al. International staging system for multiple myeloma. J Clin Oncol 2005; 23:3412-20; PMID:15809451; http://dx.doi.org/10.1200/JCO.2005.04.242
- Annunziato F, Cosmi L, Liotta F, Maggi E, Romagnani S. Defining the human T helper 17 cell phenotype. Trends Immunol 2012; 33:505-12; PMID:22682163; http://dx.doi.org/10.1016/j.it.2012.05.004
- Lejeune D, Dumoutier L, Constantinescu S, Kruijer W, Schuringa JJ, Renauld JC. Interleukin-22 (IL-22) activates the JAK/STAT, ERK, JNK, and p38 MAP kinase pathways in a rat hepatoma cell line. Pathways that are shared with and distinct from IL-10. J Biol Chem 2002; 277:33676-82; PMID:12087100; http://dx.doi.org/10.1074/jbc.M204204200
- Bard JD, Gelebart P, Anand M, Amin HM, Lai R. Aberrant expression of IL-22 receptor 1 and autocrine IL-22 stimulation contribute to tumorigenicity in ALK+ anaplastic large cell lymphoma. Leukemia 2008; 22:1595-603; PMID:18509351; http://dx.doi.org/10.1038/leu.2008.129
- Gelebart P, Zak Z, Dien-Bard J, Anand M, Lai R. Interleukin 22 signaling promotes cell growth in mantle cell lymphoma. Transl Oncol 2011; 4:9-19; PMID:21286373; http://dx.doi.org/10.1593/tlo.10172
- Zhan F, Huang Y, Colla S, Stewart JP, Hanamura I, Gupta S, Epstein J, Yaccoby S, Sawyer J, Burington B, et al. The molecular classification of multiple myeloma. Blood 2006; 108:2020-8; PMID:16728703; http://dx.doi.org/10.1182/blood-2005-11-013458
- Yu H, Pardoll D, Jove R. STATs in cancer inflammation and immunity: a leading role for STAT3. Nat Rev Cancer 2009; 9:798-809; PMID:19851315; http://dx.doi.org/10.1038/nrc2734
- Bochner BS, Klunk DA, Sterbinsky SA, Coffman RL, Schleimer RP. IL-13 selectively induces vascular cell adhesion molecule-1 expression in human endothelial cells. J Immunol 1995; 154:799-803; PMID:7529288
- Doucet C, Brouty-Boye D, Pottin-Clemenceau C, Jasmin C, Canonica GW, Azzarone B. IL-4 and IL-13 specifically increase adhesion molecule and inflammatory cytokine expression in human lung fibroblasts. Int Immunol 1998; 10:1421-33; PMID:9796908; http://dx.doi.org/10.1093/intimm/10.10.1421
- Sugita S, Kawazoe Y, Imai A, Kawaguchi T, Horie S, Keino H, Takahashi M, Mochizuki M. Role of IL-22- and TNF-alpha-producing Th22 cells in uveitis patients with Behcet's disease. J Immunol 2013; 190:5799-808; PMID:23630362; http://dx.doi.org/10.4049/jimmunol.1202677
- Wolk K, Witte E, Witte K, Warszawska K, Sabat R. Biology of interleukin-22. Semin Immunopathol 2010; 32:17-31; PMID:20127093; http://dx.doi.org/10.1007/s00281-009-0188-x
- Sonnenberg GF, Fouser LA, Artis D. Border patrol: regulation of immunity, inflammation and tissue homeostasis at barrier surfaces by IL-22. Nat Immunol 2011; 12:383-90; PMID:21502992; http://dx.doi.org/10.1038/ni.2025
- Lim C, Savan R. The role of the IL-22/IL-22R1 axis in cancer. Cytokine Growth Factor Rev 2014; 25:257-71; PMID:24856143; http://dx.doi.org/10.1016/j.cytogfr.2014.04.005
- Ziesche E, Bachmann M, Kleinert H, Pfeilschifter J, Muhl H. The interleukin-22/STAT3 pathway potentiates expression of inducible nitric-oxide synthase in human colon carcinoma cells. J Biol Chem 2007; 282:16006-15; PMID:17438334; http://dx.doi.org/10.1074/jbc.M611040200
- Zhang W, Chen Y, Wei H, Zheng C, Sun R, Zhang J, Tian Z. Antiapoptotic activity of autocrine interleukin-22 and therapeutic effects of interleukin-22-small interfering RNA on human lung cancer xenografts. Clin Cancer Res 2008; 14:6432-9; PMID:18927282; http://dx.doi.org/10.1158/1078-0432.CCR-07-4401
- Jiang R, Tan Z, Deng L, Chen Y, Xia Y, Gao Y, Wang X, Sun B. Interleukin-22 promotes human hepatocellular carcinoma by activation of STAT3. Hepatology 2011; 54:900-9; PMID:21674558; http://dx.doi.org/10.1002/hep.24486
- Curd LM, Favors SE, Gregg RK. Pro-tumour activity of interleukin-22 in HPAFII human pancreatic cancer cells. Clin Exp Immunol 2012; 168:192-9; PMID:22471280; http://dx.doi.org/10.1111/j.1365-2249.2012.04570.x
- Tsirakis G, Pappa CA, Kolovou A, Kokonozaki M, Neonakis I, Alexandrakis MG. Clinical significance of interleukin-22 in multiple myeloma. Hematology 2015; 20:143-7; PMID:25055724; http://dx.doi.org/10.1179/1607845414Y.0000000182
- Mahindra A, Hideshima T, Anderson KC. Multiple myeloma: biology of the disease. Blood Rev 2010; 24(Suppl 1):S5-11; PMID:21126636; http://dx.doi.org/10.1016/S0268-960X(10)70003-5
- Wolk K, Kunz S, Witte E, Friedrich M, Asadullah K, Sabat R. IL-22 increases the innate immunity of tissues. Immunity 2004; 21:241-54; PMID:15308104; http://dx.doi.org/10.1016/j.immuni.2004.07.007
- Anderson KC, Jones RM, Morimoto C, Leavitt P, Barut BA. Response patterns of purified myeloma cells to hematopoietic growth factors. Blood 1989; 73:1915-24; PMID:2713508
- Klein B, Bataille R. Cytokine network in human multiple myeloma. Hematol Oncol Clin North Am 1992; 6:273-84; PMID:1582974
- Chng WJ, Fonseca R. Risk stratification of patients with newly diagnosed multiple myeloma: optimizing treatment based on pretreatment characteristics. Clin Lymphoma Myeloma 2005; 6:200-7; PMID:16354325; http://dx.doi.org/10.3816/CLM.2005.n.047
- Kyrtsonis MC, Maltezas D, Tzenou T, Koulieris E, Bradwell AR. Staging systems and prognostic factors as a guide to therapeutic decisions in multiple myeloma. Semin Hematol 2009; 46:110-7; PMID:19389494; http://dx.doi.org/10.1053/j.seminhematol.2009.02.004
- Avet-Loiseau H, Durie BG, Cavo M, Attal M, Gutierrez N, Haessler J, Goldschmidt H, Hajek R, Lee JH, Sezer O, et al. Combining fluorescent in situ hybridization data with ISS staging improves risk assessment in myeloma: an International Myeloma Working Group collaborative project. Leukemia 2013; 27:711-7; PMID:23032723; http://dx.doi.org/10.1038/leu.2012.282
- Bernardo ME, Zaffaroni N, Novara F, Cometa AM, Avanzini MA, Moretta A, Montagna D, Maccario R, Villa R, Daidone MG, et al. Human bone marrow derived mesenchymal stem cells do not undergo transformation after long-term in vitro culture and do not exhibit telomere maintenance mechanisms. Cancer Res 2007; 67:9142-9; PMID:17909019; http://dx.doi.org/10.1158/0008-5472.CAN-06-4690
- Pruneri G, Ponzoni M, Ferreri AJ, Freschi M, Tresoldi M, Baldini L, Mattioli M, Agnelli L, Govi S, Mancuso P, et al. The prevalence and clinical implications of c-kit expression in plasma cell myeloma. Histopathology 2006; 48:529-35; PMID:16623778; http://dx.doi.org/10.1111/j.1365-2559.2006.02375.x