
Abstract
Dendritic cells (DCs) essentially contribute to the induction and regulation of innate and adaptive immunity. Based on these important properties, DCs may profoundly influence tumor progression in patients. However, little is known about the role of distinct human DC subsets in primary tumors and their impact on clinical outcome. In the present study, we investigated the characteristics of human 6-sulfo LacNAc (slan) DCs in clear cell renal cell carcinoma (ccRCC). slanDCs have been shown to display various tumor-directed properties and to accumulate in tumor-draining lymph nodes from patients. When evaluating 263 ccRCC and 227 tumor-free tissue samples, we found increased frequencies of slanDCs in ccRCC tissues compared to tumor-free tissues. slanDCs were also detectable in the majority of 24 metastatic lymph nodes and 67 distant metastases from ccRCC patients. Remarkably, a higher density of slanDCs was significantly associated with a reduced progression-free, tumor-specific or overall survival of ccRCC patients. Tumor-infiltrating slanDCs displayed an immature phenotype expressing interleukin-10. ccRCC cells efficiently impaired slanDC-induced T-cell proliferation and programming as well as natural killer (NK) cell activation. In conclusion, these findings indicate that higher slanDC numbers in ccRCC tissues are associated with poor prognosis. The induction of a tolerogenic phenotype in slanDCs leading to an insufficient activation of innate and adaptive antitumor immunity may represent a novel immune escape mechanism of ccRCC. These observations may have implications for the design of therapeutic strategies that harness tumor-directed functional properties of DCs against ccRCC.
Abbreviations:
- ccRCC, clear cell renal cell carcinoma
- CTLs, cytotoxic T cells
- DCs, dendritic cells
- FCS, fetal calf serum
- HLA, human leukocyte antigen
- ILT, immunoglobulin-like transcript
- IFNγ, interferonγ
- IL, interleukin
- LPS, lipopolysaccharide
- NK cells, natural killer cells
- PBMCs, peripheral blood mononuclear cells
- PMA, phorbol myristate acetate
- slan, 6-sulfo LacNAc
- Th1 cells, T helper type I cells
- TMAs, tissue microarrays
- TNF-α, tumor necrosis factor-α
Introduction
Kidney cancer is a frequently occurring tumor type in Europe with an estimated incidence of 115.200 cases and an estimated number of 49.000 deaths in 2012.Citation1,2 Approximately 90% of malignant kidney tumors are renal cell carcinomas (RCC), of which the vast majority display clear cell (cc) histology.Citation1 Whereas patients with localized RCC are often successfully treated with partial or total nephrectomy, effective therapeutic options for patients with metastatic RCC are limited.Citation3 An important feature of RCC is the pronounced infiltration of various immune cell subsets such as NK cells and T lymphocytes.Citation4 Schleypen et al. found that RCC tissues are infiltrated by significant numbers of NK cells and that their frequency as well as the expression of CD16 and cytotoxic effector molecules predict the functional activity.Citation5,6 Moreover, it has been reported that higher densities of NK cells in RCC lung metastases are correlated with longer survival.Citation7 Further studies revealed that an abundance of CD4+ and CD8+ T cells in tissues of primary RCC or lung metastases is associated with shorter survival and that RCC patients with a lower density of CD45RO+ memory T cells have a significantly better prognosis.Citation7–9 However, an increased proliferative activity of intratumoral CD8+ T cells was correlated with longer survival,Citation8 indicating that the functional status rather than the frequency of infiltrating cells may denote a better efficacy of the immune defense against RCC. In contrast to these effector cell subsets, little is known about the characteristics of distinct subsets of human DCs in RCC, their potential role in tumor-directed immunity, and their impact on clinical outcome.
DCs display an extraordinary capacity to induce and regulate T-cell responses.Citation10 In tumor setting, blood circulating DCs can migrate to tumor tissues. Immature DCs are able to efficiently internalize tumor-derived material. DC maturation can be induced by various molecules such as heat shock proteins and high-mobility group box 1 protein as well as proinflammatory cytokines produced by various tumor-infiltrating immune cells. During maturation DCs can migrate from tumor tissues to secondary lymphoid organs, where they induce antigen-specific CD8+ and CD4+ T cells. CD8+ T cells are able to destroy tumor cells, whereas CD4+ T cells can promote the antigen-presenting capacity of DCs and provide help for the stimulation of tumor-reactive CD8+ lymphocytes. Besides their unique capacity to induce and stimulate T-cell responses, DCs efficiently improve the immunomodulatory and cytotoxic potential of NK cells, which also essentially contribute to tumor cell elimination.Citation11,12 Owing to their ability to activate T cells, DCs evolved as promising candidates for vaccination protocols in cancer therapy.Citation13-18
6-sulfo LacNAc (slan) DCs (formerly termed M-DC8+ DCs) represent a particular proinflammatory subset of myeloid human blood DCs.Citation19-21 Previously, we demonstrated that activated slanDCs produce large amounts of tumor necrosis factor (TNF)-α, interleukin (IL)-1β, IL-6, IL-12, and IL-23, and display a marked capability to handle IgG-complexed antigens.Citation20-23 We also found that slanDCs mediate direct cytotoxicity against tumor cells.Citation24,25 Further studies revealed that they efficiently induce neoantigen-specific CD4+ T cells, activate tumor-reactive CD8+ T cells, and promote the polarization of naive CD4+ T lymphocytes into T helper (Th) 1 or Th17/Th1 cells.Citation19-22 In addition, slanDCs have been shown to stimulate interferon (IFN)γ production and cytotoxic activity of NK cells.Citation25,26 Based on these functional properties, slanDCs may contribute to antitumor immunity.
To gain novel insights into the role of slanDCs in ccRCC and their impact on clinical outcome, we determined the frequency of slanDCs in a large cohort of ccRCC tissues and the association between slanDC numbers and important clinicopathological characteristics of patients. We also evaluated the maturation status and cytokine expression profile of ccRCC-infiltrating slanDCs. Finally, we explored whether RCC cells influence the ability of slanDCs to promote T-cell proliferation and programming as well as NK-cell activation.
Results
slanDCs accumulate in tissues of ccRCC patients
Previously, we demonstrated the presence of proinflammatory slanDCs in tissue samples of patients with rheumatoid arthritis, psoriasis, and lupus erythematosus,Citation21,22,27 indicating that this DC subset may contribute to the inflammatory processes underlying these diseases. More recently, it has been demonstrated that slanDCs accumulate in metastatic tumor-draining lymph nodes from carcinoma patients.Citation28,29 Here, we investigated whether slanDCs are detectable in tissues of ccRCC patients. For this purpose, we stained paraffin-embedded tissues from primary tumors and tumor-free tissues from 265 ccRCC patients with different clinicopathological characteristics (). The frequency of slanDCs could be determined in 263 tumor tissues and in 227 tumor-free tissues. slanDCs were found in 144 (63.4%) tumor-free tissues () and 245 (93.2%) ccRCC tissues () at varying frequencies. slanDCs were preferentially located interstitially (), but also in blood vessels (). In addition, we determined the presence of slanDCs in primary tumor tissues from 17 patients with papillary RCC (). slanDCs were detectable in 16 (94.1%) papillary RCC tissues at varying frequencies (). As demonstrated in , significantly higher numbers of slanDCs were detected in primary ccRCC tissues (mean: 3.74 slanDC/mmCitation2, range: 0-19.82 slanDC/mmCitation2) compared to tumor-free tissues (mean: 1.19 slanDC/mmCitation2, range: 0-9.9 slanDC/mmCitation2). In addition, the frequency of slanDCs in primary ccRCC tissues was higher in comparison to papillary RCC tissues (mean: 3.2 slanDC/mmCitation2, range: 0-11.49 slanDC/mmCitation2). In further experiments, the presence of slanDCs in 24 lymph node metastases and 67 distant metastases from 81 ccRCC patients was analyzed. As depicted in , slanDCs were found in 21 (87.5%) lymph node metastases (mean: 2.22 slanDC/mmCitation2, range: 0-10.29 slanDC/mmCitation2) and 57 (85.1%) distant metastases (mean: 2.98 slanDC/mmCitation2, range: 0-26.18 slanDC/mmCitation2). These results provide for the first time evidence that slanDCs accumulate in primary ccRCC tissues and are also present in metastatic lymph nodes as well as distant metastases from ccRCC patients.
Figure 1. slanDCs accumulate in ccRCC tissues. (A–F) Immunohistochemical stainings were performed to detect slanDCs in primary tumor and tumor-free tissues of ccRCC patients. As representative examples, the presence of slanDCs in a histologically confirmed tumor-free (A, B) and tumor tissue (C, D) is shown. Original magnification was x100 (A, C) or x200 (B, D). (E, F) slanDCs were located interstitially (E) or in blood vessels (F). Original magnification was x400. (G, H) The presence of slanDCs in a histologically confirmed tumor tissue of a patient with papillary RCC is demonstrated. Original magnification was x100 (G) or x200 (H). (I, J) Positively stained slanDCs were counted and their number per square millimeter was determined. (I) Box plots show the number of slanDCs in histologically confirmed primary tumor tissues of ccRCC patients (n = 263) in comparison to tumor-free tissues (n = 227) or primary tumor tissues of patients with papillary RCC (n = 17). (J) Box plots show the number of slanDCs in histologically confirmed lymph node metastases (n = 24) and distant metastases (n = 67). Boxes within the plots represent the 25–75th percentiles. Median values are depicted as solid bold lines. The whiskers represent 1.5 times of the interquartile range (IQR). Circles indicate values more extreme than 1.5 times of the IQR, whereas asterisks illustrate values more than 3 times of the IQR. Statistical significance of differences was calculated by the Mann–Whitney U-test. P values < 0.05 indicate a statistically significant difference.
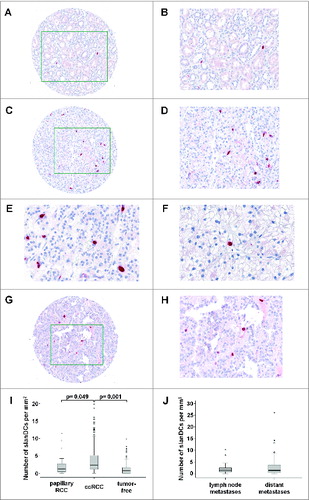
Table 1. Clinicopathological characteristics of ccRCC patients
Table 2. Clinicopathological characteristics of patients with papillary RCC
Increased numbers of slanDCs in ccRCC tissues are associated with poor prognosis
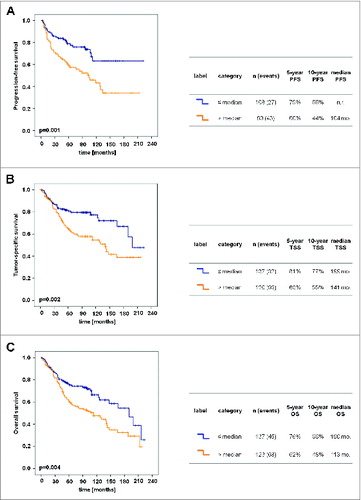
In further studies, we investigated whether the frequency of slanDCs in primary tumor tissues is associated with relevant clinicopathological characteristics of ccRCC patients. We found that a higher density of slanDCs in ccRCC tissues is significantly associated with a higher Fuhrman grading and stage of the primary tumor () as well as with the presence of lymph node metastases at time of nephrectomy (). Furthermore, a significantly higher slanDC frequency was detected in primary tumors of ccRCC patients with distant metastases at time of nephrectomy (M1) or an appearance of metastases during follow-up time compared to patients without distant metastases at time of nephrectomy (M0) and during a follow-up time of ≥60 mo (). We also determined a potential association between the slanDC frequency in tumor tissues and progression-free, tumor-specific, and overall survival of ccRCC patients. Remarkably, a higher density of slanDCs was significantly associated with a reduced progression-free survival of ccRCC patients (). The 10-year progression-free survival of patients with high slanDC numbers was 44% compared to 66% of patients with low slanDC counts. A higher slanDC frequency was also significantly associated with a reduced tumor-specific survival of ccRCC patients (). The 10-year tumor-specific survival of patients with high slanDC numbers was 55% compared to 77% of patients with low slanDCs counts. Furthermore, a higher number of slanDCs was significantly linked to a reduced overall survival of ccRCC patients (). The 10-year overall survival for high slanDC frequencies was 48% compared to 66% for low slanDC values.
Figure 2. Associations between the frequency of slanDCs in tumor tissues and clinicopathological characteristics of ccRCC patients. (A–D) Box plots show the associations between the number of slanDCs in primary ccRCC tissues and tumor grading (A), tumor stage (B) or lymph node status (C) at time of nephrectomy. (D) slanDC numbers in primary ccRCC tissues of patients without distant metastases at time of nephrectomy and during a follow-up time of ≥60 mo (not metastasized, n = 79) compared to patients with distant metastases at time of nephrectomy (M1) or an appearance of metastases during follow-up time (metastasized, n = 121). Boxes within the plots represent the 25–75th percentiles. Median values are depicted as solid bold lines. The whiskers represent 1.5 times of the interquartile range (IQR). Circles indicate values more extreme than 1.5 times of the IQR, whereas asterisks illustrate values more than 3 times of the IQR. Statistical significance of differences was calculated by the Mann–Whitney U-test. P values <0.05 indicate a statistically significant difference.
Figure 3. Increased numbers of slanDCs in ccRCC tissues are associated with poor prognosis. Kaplan–Meier curves demonstrate the association between the number of slanDCs in primary ccRCC tissues and progression-free survival (A), tumor-specific survival (B) or overall survival (C) of ccRCC patients. The table next to each Kaplan–Meier curve comprises the number of patients in each category, the 5- and 10-year survival rates, and the median survival time. Statistical comparison between groups of patients was conducted by log-rank test. P values <0.05 indicate a statistically significant difference. mo.: months; n.r.: not reached; PFS: progression-free survival; TSS: tumor-specific survival; OS: overall survival.
ccRCC-infiltrating slanDCs display a tolerogenic phenotype
To unravel potential underlying mechanisms for the association between a higher density of ccRCC-infiltrating slanDCs and poor prognosis of patients, we determined maturation status and cytokine expression profile of slanDCs in ccRCC tissues. Therefore, cell suspensions containing slanDCs were prepared from 10 fresh ccRCC tissues. As shown in , CD45+CD11c+ slan+ DCs within the obtained cell suspension were used for evaluating the expression of various surface molecules and cytokines. To determine the maturation status of ccRCC-infiltrating slanDCs, we explored the expression of human leukocyte antigen (HLA)-DR, the costimulatory molecules CD40, CD80, and CD86, the maturation marker CD83, and the chemokine receptor CCR7. As shown in , slanDCs only expressed HLA-DR and low densities of CD86, whereas CD40, CD80, CD83, and CCR7 could not be detected on almost all slanDCs. These results indicate that ccRCC-infiltrating slanDCs display an immature phenotype. In addition, most slanDCs express the inhibitory molecules immunoglobulin-like transcript (ILT)3 and ILT4 (), which were shown to be upregulated on the surface of tolerogenic DCs.Citation30 Recently, we demonstrated that in vitro-activated slanDCs secrete large amounts of various proinflammatory cytokines such as TNF-α, IL-12 and IL-23.Citation20-23 We also found that TNF-α- or IL-23-expressing slanDCs are present in tissues of patients with psoriasis and lupus erythematosus.Citation22,27 Following these findings, we investigated the cytokine expression profile of ccRCC-infiltrating slanDCs. Notably, the proinflammatory cytokines TNF-α and IL-12 were not detected in slanDCs (). Moreover, a proportion of ccRCC-infiltrating slanDCs showed expression of the anti-inflammatory cytokine IL-10 (). These results provide evidence that ccRCC tissues contain immature slanDCs expressing ILT3, ILT4, and IL-10. This tolerogenic phenotype of slanDCs may contribute to the observed association between a higher density of ccRCC-infiltrating slanDCs and poor prognosis of patients.
Figure 4. ccRCC-infiltrating slanDCs display a tolerogenic phenotype. (A) Cell suspensions were prepared from fresh ccRCC tissues. Within these cell suspensions, slanDCs were defined as CD45+CD11c+ slan+ cells. (B) The expression of various surface molecules and cytokines by slanDCs was determined by flow cytometry. The results of one representative ccRCC tissue out of 10 performed with similar results are depicted. Values represent the percentage of cells staining positive for each molecule (filled) compared to unstained cells (empty).
RCC cells efficiently inhibit slanDC-induced proliferation of CD4+ and CD8+ T cells
Following the observed phenotype of ccRCC-infiltrating slanDCs, we explored whether ccRCC cells modulate important functional properties of this DC subset. Therefore, slanDCs were isolated from the blood of four healthy donors and were co-incubated with the commercially available ccRCC cell lines ACHN and Caki-1 as well as the primary MZ1257RC and MZ2877RC cell lines, which were established from ccRCC patients.Citation31 Then, slanDCs were separated from adherent tumor cells by resuspension. Subsequently, slanDCs were incubated with allogeneic CD4+ or CD8+ T cells. As demonstrated in , slanDCs efficiently induced the proliferation of CD4+ or CD8+ T cells. Notably, the ability of slanDCs to promote CD4+ T cell proliferation was markedly inhibited by ACHN, Caki-1, MZ1257RC, and MZ2877RC cells (). In addition, ACHN and Caki-1 cells impaired slanDC-induced CD8+ T-cell proliferation (). To investigate whether the presence of contaminating ccRCC cells in the separated slanDC population contributes to these results by directly inhibiting T-cell proliferation, ccRCC cells were co-incubated with T cells in the presence of stimulating anti-CD3/CD28 antibodies and IL-2. We observed that this amount of contaminating ccRCC cells does not influence the proliferation of activated T cells (Fig. S1 and S2). To explore whether cell surface or soluble molecules expressed by ccRCC cells induce functional impairment of slanDCs, transwell experiments were performed. As depicted in , the inhibitory effect of ccRCC cells on the ability of slanDCs to stimulate CD4+ T-cell proliferation was abrogated by the separating membrane. These results reveal that the ccRCC-mediated inhibition of this functional property of slanDCs is dependent on cell-to-cell contact. Following these findings, we evaluated whether the co-inhibitory molecules B7-DC, B7-H1, B7-H3, and B7-H4, which are implicated in profound immunosuppressive effects exhibited by tumors,Citation32,33 may play a role in the functional inhibition of slanDCs. Therefore, the surface expression of B7-DC, B7-H1, B7-H3, and B7-H4 on ACHN, Caki-1, MZ1257RC, and MZ2877RC cells was determined. All ccRCC cells expressed the co-inhibitory molecules B7-H1 and B7-H3 in contrast to B7-DC and B7-H4 (Fig. S3). In further experiments, we co-incubated slanDCs with ACHN, Caki-1, MZ1257RC or MZ2877RC cells in the presence or absence of neutralizing anti-B7-H1 and anti-B7-H3 antibodies. Then, slanDCs were harvested and co-cultured with allogeneic CD4+ T cells. As shown in Supplemental Fig. 4, ccRCC cell-mediated inhibition of the capacity of slanDCs to stimulate T-cell proliferation was not abrogated by the neutralizing antibodies, indicating that the co-inhibitory molecules B7-H1 and B7-H3 do not essentially contribute to this effect.
Figure 5. RCC cells impair slanDC-induced proliferation of CD4+ and CD8+ T cells. (A, B) slanDCs were maintained in the presence of ACHN, Caki-1, MZ1257RC or MZ2877RC cells. After 6 h, slanDCs were separated from adherent tumor cells and co-cultured with allogeneic eFluor® 670-labeled CD4+ T cells (A) or CD8+ T cells (B). After 8 d, T cells were harvested, stained with FITC-conjugated anti-CD4+ antibodies or FITC-conjugated anti-CD8+ antibodies, and analyzed by flow cytometry. The results of one representative donor out of four performed with similar results are depicted. Values represent the percentage of proliferating cells stained with eFluor® 670 (filled) compared to unstimulated T cells (empty).
Figure 6. RCC cells inhibit slanDC-induced T-cell proliferation by cell-to-cell contact. slanDCs and ccRCC cells were maintained in the presence or absence of a separating porous membrane. Then, slanDCs were collected and co-cultured with allogeneic eFluor® 670-labeled CD4+ T cells. Subsequently, T cells were harvested and analyzed by flow cytometry. The results of one representative donor out of four performed with similar results are depicted. Values represent the percentage of proliferating cells stained with eFluor® 670 (filled) compared to unstimulated T cells (empty).
RCC cells efficiently impair slanDC-induced programming into Th1 cells
Lipopolysaccharide (LPS)-stimulated slanDCs efficiently direct the differentiation of naive CD45RA+ CD4+ T lymphocytes into INFγ-producing proinflammatory Th1 cells.Citation21 Following this finding, we evaluated the impact of ccRCC cells on slanDC-induced programming into Th1 cells. slanDCs were isolated from the blood of four healthy donors and were maintained in the presence of ACHN, Caki-1, MZ1257RC or MZ2877RC cells. Thereafter, slanDCs were separated from adherent tumor cells by resuspension. Then, slanDCs were co-cultured with naive CD45RA+ CD4+ T cells in the presence of LPS. As depicted in , all ccRCC cell lines markedly impaired the capability of slanDCs to induce the differentiation of naive T cells into IFNγ-expressing Th1 cells. To investigate whether contaminating ccRCC cells in the separated slanDC population contribute to this effect, ccRCC cells were incubated with naive T cells in the presence of stimulating anti-CD3/CD28 antibodies and IL-12. Differentiation of naive CD4+ T cells into Th1 cells was not modulated by the contaminating ccRCC cells (Fig. S5). These results provide evidence that ccRCC cells are able to markedly impair slanDC-mediated T-cell proliferation and programming.
Figure 7. ccRCC cells impair slanDC-mediated differentiation of naive CD4+ T cells into Th1 cells. ccRCC cell-pretreated slanDCs were co-cultured with naive CD4+ T cells in the presence of LPS. Thereafter, the percentage of IFNγ- and IL-4-producing CD4+ T cells was determined by flow cytometry. The results of one representative donor out of four performed with similar results are depicted.
RCC cells markedly inhibit slanDC-mediated NK-cell activation
Previously, we demonstrated that slanDCs promote immunomodulatory properties of NK cells.Citation25,26 To analyze the impact of ccRCC cells on this functional property, slanDCs were isolated from the blood of three healthy donors and were maintained in the presence of the ACHN, Caki-1 or MZ1257RC cells. Then, slanDCs were separated from adherent tumor cells by resuspension and incubated with NK cells. As demonstrated in , all ccRCC cell lines significantly impaired the capacity of slanDCs to augment IFNγ secretion by NK cells. To determine whether contaminating ccRCC cells in the separated slanDC population contribute to this observation, ccRCC cells were co-cultured with NK cells in the presence of IL-2 and IL-12. As shown in Supplemental Fig. 6, ACHN, Caki-1 or MZ1257RC cells did not alter IFNγ secretion by activated NK cells. In contrast, MZ2877RC cells significantly impaired NK-cell IFNγ release. Therefore, we excluded MZ2877RC cells from this experiment. Taken together, these findings provide evidence that ccRCC cells can efficiently inhibit slanDC-mediated stimulation of innate and adaptive immunity.
Figure 8. ccRCC cells impair slanDC-mediated activation of NK cells. ccRCC cell-pretreated slanDCs were co-incubated with NK cells in the presence of LPS. Subsequently, supernatants were collected and IFNγ concentration was determined by ELISA. The results of three different donors are presented as mean ± s.e. of triplicate determinations. Statistical significance was calculated by the Student´s t-test. Asterisks indicate a statistically significant difference (P < 0.05).
Discussion
DCs are characterized by an extraordinary capacity to induce and regulate innate and adaptive immune responses. Due to these properties, DCs play an important role in antitumor immunity. In the context of RCC, DCs were found to be one component of the natural immune cell infiltrate in tissues of RCC patients. Thus, it has been demonstrated that RCC tissues contain putative DCs expressing HLA class II molecules, the adhesion molecule CD54, the costimulatory molecule CD86, and the maturation marker CD83.Citation34 Whereas these DCs displayed a low capacity to internalize soluble antigens, they were able to stimulate T-cell proliferation. Further data revealed that only a small proportion of RCC-infiltrating HLA-DR+ lineage-specific marker− DCs represents activated CMRF-44-expressing DCs.Citation35 In addition, it has been reported that significant numbers of immature CD1a+ DCs were preferentially located within the tumor.Citation36 In contrast, most mature CD83+ DCs were detected in the peritumoral region in association with T cells.Citation35,36 More recently, Figel et al. showed that CD209+ DCs, mostly co-expressing the macrophage markers CD14 and CD163, are numerous in tissues of RCC patients.Citation37 A higher density of this so-called enriched-in-renal-carcinoma DCs (ercDCs) is often found in advanced tumor stages, suggesting that this DC subset may have an adverse effect on tumor growth control.Citation37 Whereas all these studies are based on the detection of general marker molecules for DCs, little is known about the presence of distinct human DC subsets in RCC tissues.
Previously, we reported that slanDCs, representing a myeloid human blood DC subset, produce various proinflammatory cytokines, display cytotoxic activity, and efficiently stimulate NK cells and T lymphocytes.Citation19-22,24-26 More recently, Vermi et al. demonstrated that slanDCs are numerous in metastatic tumor-draining lymph nodes from cancer patients.Citation28,29 In contrast, slanDCs were very rare or undetectable in non-metastatic tumor-draining lymph nodes from cancer patients. slanDCs were preferentially located on the perimeter of tumor nests in close proximity to tumor cells within most metastatic tumor-draining lymph nodes. Further data provided evidence that the accumulation of slanDCs in metastatic tumor-draining lymph nodes represents an early event that is coupled to nodal cancer cell colonization.Citation28,29 Following these findings, indicating that slanDCs may play an important role in antitumor immunity, we explored the presence of this distinct human DC subset in RCC tissues. We found that slanDCs are detectable in the vast majority of primary tissues, metastatic lymph nodes, and distant metastases from ccRCC patients, demonstrating that slanDCs represent an immune contexture component in ccRCC. In addition, a significant increase of slanDC number was observed in primary ccRCC tissues compared to tumor-free tissues.
Recent studies decipher the major role of innate and adaptive immune cell subsets as elements of the tumor microenvironment in regulating tumor growth.Citation38-41 It has been documented that high densities of CD45RO+ memory T cells with cytotoxic or Th1 orientation are associated with good prognosis in various tumor types.Citation40-43 In contrast, tumor-associated macrophages have been shown to promote tumor initiation, progression, and metastasis.Citation44 To get novel insights into the role of slanDCs in the immunosurveillance of ccRCC, we investigated a potential correlation of slanDC frequency in primary tumor tissues with important clinicopathological characteristics of RCC patients. Interestingly, a higher density of slanDCs in ccRCC tissues was significantly associated with a higher grading and stage of the primary tumor. In addition, a significantly higher slanDC number was detected in primary tissues of ccRCC patients with lymph node as well as of patients with distant metastases at time of nephrectomy or during the follow-up time. Moreover, a higher frequency of slanDCs was significantly associated with a reduced progression-free, tumor-specific or overall survival of ccRCC patients. These data further substantiate a recent study, indicating that a higher frequency of DCs expressing the maturation marker LAMP in lung metastases of RCC is associated with a shorter overall survival of patients.Citation7
Accumulating evidence suggests that DCs recruited to the tumor microenvironment undergo changes that endow them with regulatory functions promoting tumor growth.Citation45-47 Following these findings, we explored the maturation status and cytokine expression profile of freshly prepared ccRCC-infiltrating slanDCs. These slanDCs were characterized by the surface expression of HLA-DR, ILT3, and ILT4. Notably, a proportion of slanDCs produced the anti-inflammatory cytokine IL-10. In contrast, CD40, CD80, CD83, and CCR7 as well as the proinflammatory cytokines TNF-α and IL-12 could not be detected. These data revealed that ccRCC-infiltrating slanDCs display an immature phenotype distinguishing them from the previously described ercDCs, which express CD80 and CD40.Citation37 Moreover, slanDCs may induce immune tolerance or immunosuppression through IL-10. We also explored the impact of various ccRCC cell lines including primary tumor cells on important immunostimulatory properties of slanDCs. We found that ccRCC cells efficiently impair the capacity of slanDCs to stimulate CD4+ and CD8+ T-cell proliferation, to polarize naive T cells into Th1 cells, and to activate NK cells. Cell-to-cell contact was required for ccRCC cells to induce slanDC-mediated inhibition of CD4+ T-cell proliferation. In contrast, tumor-induced alterations of ercDCs were mediated by soluble factors such as IL-6, IL-8, and vascular endothelial growth factor.Citation37 These results are consistent with previous reports, demonstrating that various tumor types can impair differentiation, maturation, and immunostimulatory functional properties of DCs.Citation48-50
In summary, we demonstrated for the first time that slanDCs, which are characterized by pronounced tumor-directed capabilities, accumulate in primary ccRCC tissues and are also detectable in the majority of metastatic lymph nodes and distant metastases from ccRCC patients. A higher density of slanDCs was significantly associated with poor prognosis of ccRCC patients. Further studies revealed that ccRCC-infiltrating slanDCs display an immature phenotype expressing ILT3, ILT4, and IL-10. Moreover, ccRCC cells efficiently impaired slanDC-induced T-cell proliferation and programming as well as NK-cell activation. These findings provide evidence for a novel immune escape mechanism of ccRCC, which is based on the induction of a tolerogenic phenotype in slanDCs leading to an insufficient activation of innate and adaptive antitumor immunity. Tolerogenic slanDCs may represent a component of an immunosuppressive network in ccRCC that promotes tumor growth and is associated with poor prognosis of patients. These observations may also have implications for the design of therapeutic strategies that harness tumor-directed functional properties of DCs against ccRCC.
Materials and Methods
Tissue specimens
Tissue microarrays (TMAs) for immunohistochemical analyses were constructed using formalin-fixed and paraffin-embedded tissue specimens of primary tumors and tumor-free tissues of 265 ccRCC patients who had been treated by partial or total nephrectomy between 1993 and 2008 at the Department of Urology, University Hospital of Dresden. The frequency of slanDCs could be determined in 263 tumor tissues and in 227 tumor-free tissues. Furthermore, we analyzed tissue samples of 24 lymph node metastases and 67 distant metastases from 81 ccRCC patients. In this context, tissue samples of one metastatic site from 65 patients and of two or more metastatic sites from 16 patients were investigated.
In addition, we evaluated the number of slanDCs in primary tumor tissues from 17 patients with papillary RCC. All tumors were reevaluated and staged according to the 2010 UICC classification and graded according to the Fuhrman grading system.Citation51,52 This study was approved by the institutional review board of the Medical Faculty of the TU Dresden. Patients gave their written informed consent. The demographic and clinicopathological data of the patients are summarized in .
Immunohistochemistry
TMA sections were deparaffinized in xylene (3 × 10 min, VWR International) and hydrated by graded washes of ethanol (Berkel AHK) to water (B. Braun). TMA sections were boiled in citrate buffer (Zytomed Systems) at pH 6 for antigen retrieval. Thereafter, TMAs were incubated with the monoclonal mouse anti-slan antibody DD2 (1:10, Institute of Immunology, Medical Faculty, TU Dresden, Dresden, Germany) overnight at 4°C followed by incubation with a biotin-labeled anti-mouse IgM antibody (Dako) for 30 min. slanDCs were visualized by the EnVisionTM detection system (alkaline phosphatase) according to the manufacturer´s instructions (Dako). All tissue sections were counterstained with Mayer´s hematoxylin (Merck). For quantification of slanDCs in tissues, positively stained cells were counted in 1-5 cores of each ccRCC tissue (2 to 5 cores of 248 samples, 94.3%) and 1-3 cores of each tumor-free tissue (2 or 3 cores of 191 samples, 84.1%) using an Olympus BX41 microscope (Olympus) and, if possible, the mean value was determined. The mean number of slanDCs per core (area: 0.28 mm2) was converted to square millimeter.
Phenotypic characterization of ccRCC-infiltrating slanDCs
Tumor-infiltrating cells were isolated from fresh ccRCC tissues by mechanical and enzymatic tissue dissociation. Tissue samples were obtained from ccRCC patients who underwent partial or total nephrectomy at the Department of Urology, University Hospital of Dresden. This study was approved by the institutional review board of the Medical Faculty of the TU Dresden. Patients gave their written informed consent. Fresh histopathologically confirmed ccRCC tissues were dissected into small pieces and maintained in Hanks´ balanced salt solution (HBSS) with calcium and magnesium (Gibco Life Technologies). Tumor-infiltrating cells were obtained by using a digestion buffer (RPMI 1640 containing 0.1% BSA, 100 mg/mL penicillin and streptomycin, 10 mM Hepes; all from Biochrom) containing 0.5 mg/mL collagenase type IA and 0.19 mg/mL DNAse I (both from Sigma-Aldrich) or a digestion buffer (HBSS without calcium or magnesium) containing 5 mM EDTA (Merck). Furthermore, a filter (pore diameter: 70 µm; Greiner BioOne) was used.
Freshly prepared tumor-infiltrating cells were used for phenotypic characterization of slanDCs by flow cytometry. For this, 0.5 − 1 × 10⁶ cells per sample were stained with DD2 hybridoma supernatant for 30 min at 4°C, followed by PE- or FITC-conjugated goat F(ab´)2 anti-mouse IgM antibodies for 30 min at 4°C. After washing, cells were stained with various labeled antibodies summarized in .
Table 3. Antibodies used for immunofluorescence staining
Immunomagnetic isolation of slanDCs, NK cells, CD4+ T cells, and CD8+ T cells
The study was approved by the local institutional review board of the Medical Faculty of the TU Dresden. Blood samples were obtained with written informed consent from healthy donors. Immunomagnetic isolation of slanDCs from peripheral blood mononuclear cells (PBMCs) of healthy donors was performed as described previously.Citation21 Briefly, PBMCs were prepared by Ficoll-Hypaque (Biochrom) density centrifugation and incubated for 15 min at 4°C with M-DC8 hybridoma supernatant containing 10 µg/mL of antibody. After washing with PBS, 1 × 10⁸ cells were resuspended in 100 µL PBS and labeled with 12 µL of rat anti-mouse IgM coupled to paramagnetic microbeads (Miltenyi Biotec) for another 15 min at 4°C. After washing, cells were sorted on 2 columns via the autoMACS device (Miltenyi Biotec).
CD4+ T cells, CD45RA+ CD4+ T cells, CD8+ T cells, and CD56+ CD3− NK cells were isolated from PBMCs by negative depletion using immunomagnetic separation according to the manufacturer´s instructions (Miltenyi Biotec). The purity of all isolated cell populations was >90% as assessed by flow cytometry.
Complete medium used for functional assays consisted of RPMI 1640 supplemented with 2 mM L-glutamine, 1 mM sodium pyruvate, 1% nonessential amino acids, 100 µg/mL penicillin, 100 µg/mL streptomycin (all from Biochrom), and 10% human serum (CC pro).
Cell lines
The ccRCC cell lines ACHN and Caki-1 were obtained from American Type Culture Collection and cultured according to the provider's instructions. These ccRCC cell lines were authenticated by DNA profiling and passaged for fewer than 6 mo after resuscitation. The primary ccRCC cell lines MZ1257RC and MZ2877RCCitation31 were cultivated in DMEM (4.5 g/L glucose, Gibco Life Technologies) supplemented with 10% fetal calf serum (FCS), 1% nonessential amino acids, 100 µg/mL penicillin, and 100 µg/mL streptomycin (all from Biochrom). These ccRCC cell lines were authenticated by DNA profiling.
Flow cytometric analysis
Immunofluorescence staining of surface molecules on slanDCs, NK cells, CD4+ T cells, CD8+ T cells, and the four ccRCC cell lines was performed using the antibodies summarized in . The antibodies were used according to the provider's instructions. For indirect immunofluorescence staining, cells were incubated with the relevant antibodies for 30 min at 4°C. After washing, FITC- or PE-conjugated isotype-specific anti-mouse antibodies were added for 30 min at 4°C. After the staining procedure, cells were washed twice and evaluated by flow cytometry, which was performed on a FACSCalibur flow cytometer (BD Biosciences).
For intracytoplasmic staining of cytokines in ccRCC-infiltrating slanDCs, cells were fixed with freshly prepared ice-cold 4% paraformaldehyde for 15 min and permeabilized with 0.1% saponin (both from Merck) in PBS containing 1% FCS. Then, slanDCs were stained for 15 min using PE-conjugated anti-TNF-α, PE-conjugated anti-IL-12 or PE-conjugated anti-IL-10 antibodies, washed twice and analyzed by flow cytometry, which was performed on a MacsQuant device (Miltenyi Biotec). For intracytoplasmic staining of IFNγ and IL-4, CD4+ T lymphocytes were stimulated with 10 ng/mL phorbol myristate acetate (PMA) and 1 µg/mL ionomycin in the presence of 1 µg/mL brefeldin A (all from Sigma-Aldrich). After 4 h, cells were harvested, fixed with freshly prepared ice-cold 4% paraformaldehyde for 15 min, and permeabilized with 0.1% saponin in PBS containing 1% FCS for 3 min at 4°C. Subsequently, cells were stained for 15 min using a FITC-conjugated anti-IFNγ and a PE-conjugated anti-IL-4 antibody, washed twice and analyzed by flow cytometry, which was performed on a FACSCalibur flow cytometer.
T-cell proliferation
ccRCC cells (3 × 10⁵/well) were plated in 24-well plates (Greiner BioOne) and maintained for 2 h to allow adhesion. Then, slanDCs (1 × 10⁶/well) were added. After 6 h of cultivation, slanDCs were separated from adherent RCC cells by careful resuspension. The purity of the obtained slanDCs was ≥85%. In some experiments, co-cultivation was performed in the presence or absence of 10 µg/mL neutralizing anti-B7-H1 and anti-B7-H3 antibodies. In further studies, transwell experiments were performed in 24-well plates. slanDCs (1 × 10⁶ cells/well) were plated in the lower wells and RCC cells (3 × 10⁵ cells/well) were added to the upper wells. Cell-to-cell contact between slanDCs and ccRCC cells was inhibited by a separating porous membrane (pore size: 0.45 µm; Millipore Cooperation). After 6 h, slanDCs were collected. CD4+ or CD8+ T cells were stained with the Cell Proliferation Dye eFluor® 670 according to the manufacturer's instructions (eBioscience). Thereafter, slanDCs (1 × 10⁴ cells/well) were cultured with allogeneic eFluor® 670-labeled CD4+ T cells (1 × 10⁵ cells/well) in round-bottomed 96-well plates (TPP). Alternatively, 2 × 10⁴ cells/well slanDCs were cultured with allogeneic eFluor® 670-labeled CD8+ T cells (1 × 10⁵ cells/well). As control, we investigated whether the highest number of contaminating ccRCC cells in the separated slanDC population contributes to these results by directly inhibiting T-cell proliferation. Therefore, ccRCC cells (1.5 × 10³ or 3 × 10³ cells/well) were co-cultured with allogeneic eFluor® 670-labeled CD4+ or CD8+ T cells (1 × 10⁵ cells/well) in the presence of stimulating anti-CD3/CD28 antibodies (Gibco Life Technologies) and 100 U/mL IL-2 (R&D Systems). After 8 d, T cells were harvested, stained with FITC-conjugated anti-CD4 antibodies (Miltenyi Biotec) or FITC-conjugated anti-CD8 antibodies (Beckman Coulter) respectively and analyzed by flow cytometry.
T-cell programming
To explore the capacity of RCC cell lines to influence slanDC-mediated T-cell differentiation, RCC cells (3 × 10⁵/well) were plated in 24-well plates and maintained for 2 h to allow adhesion. Subsequently, slanDCs (1 × 10⁶/well) were added for 6 h. Thereafter, slanDCs were separated from adherent RCC cells. The purity of the obtained slanDCs was ≥85%. Then, 1 × 10⁴ slanDCs/well were co-cultured with allogeneic naive CD45RA+ CD4+ T cells (1 × 10⁵ cells/well) in the presence of 1 µg/mL LPS (Sigma-Aldrich). As control, we investigated whether the highest number of contaminating ccRCC cells in the separated slanDC population influences the outcome of these experiments. Therefore, ccRCC cells (1.5 × 10³ cells/well) were co-incubated with allogeneic naive CD4+ T cells (1 × 10⁵ cells/well) in the presence of anti-CD3/CD28 antibodies and 0.2 ng/mL IL-12 (R&D Systems). After 8 d, T cells were harvested, stimulated with PMA and ionomycin for 4 h, and analyzed for intracellular IFNγ and IL-4 expression by flow cytometry.
IFNγ production by NK cells
To evaluate IFNγ secretion of NK cells, RCC cells (3 × 10⁵/well) were plated in 24-well plates and maintained for 2 h to allow adhesion. Subsequently, slanDCs (1 × 10⁶/well) were added for 6 h. Then, slanDCs were separated from adherent RCC cells. The purity of the obtained slanDCs was ≥85%. Then, 2 × 10⁴ slanDCs/well were co-cultured with autologous NK cells (5 × 10⁴ cells/well) and LPS (1 µg/mL) for additional 42 h. As control, we determined whether the highest number of contaminating ccRCC cells in the separated slanDC population influences the outcome of these experiments. For this, ccRCC cells (3 × 10³cells/well) were co-incubated with NK cells (5 × 10⁴ cells/well) in the presence of 500 U/mL IL-2 and 5 ng/mL IL-12. Subsequently, supernatants were collected and IFNγ production was quantified by ELISA according to the manufacturer´s instructions (BD Biosciences).
Statistical analysis
Statistical analysis was performed with the IBM SPSS Statistics 19.0 software (IBM). The Mann-Whitney U-test was used for two group comparisons. Progression-free survival was defined as the time period from nephrectomy to diagnosis of metastases or local recurrence (exclusion of M1 tumors) and tumor-specific survival from nephrectomy to death as a consequence of ccRCC. Overall survival was defined as the time period from nephrectomy to death regardless of the cause of death or last follow-up. Survival curves were generated using the Kaplan-Meier method. The differences between the corresponding curves were calculated by the log-rank test. For in vitro-experiments, the Student's t-test was performed to evaluate the significance of differences between results. For all tests, p values <0.05 were considered as statistically significant.
Disclosure of Potential Conflicts of Interest
No potential conflicts of interest were disclosed.
Supplemental Material
Supplemental data for this article can be accessed on the publisher's website.
1008342_Supplementary_Materials.zip
Download Zip (2 MB)Acknowledgments
We thank Bärbel Löbel, Karin Günther, Dr. Stefano Squillacciotti, Kristin Kalman, and Sandra Liebscher for excellent technical assistance. Furthermore, we are grateful to Carmen Weber (Regional Clinical Cancer Registry, Dresden, Germany) for retrieving follow-up data of patients.
Funding
This study was supported by a grant from the Medical Faculty, TU Dresden to Rebekka Wehner.
References
- Ljungberg B, Campbell SC, Cho HY, Jacqmin D, Lee JE, Weikert S, Kiemeney LA. The epidemiology of renal cell carcinoma. Eur Urol 2011; 60:615-21; PMID:21741761; http://dx.doi.org/10.1016/j.eururo.2011.06.049
- Ferlay J, Steliarova-Foucher E, Lortet-Tieulent J, Rosso S, Coebergh JW, Comber H, Forman D, Bray F. Cancer incidence and mortality patterns in Europe: estimates for 40 countries in 2012. Eur J Cancer 2013; 49:1374-403; PMID: 23485231; http://dx.doi.org/10.1016/j.ejca.2012.12.027
- Ljungberg B, Cowan NC, Hanbury DC, Hora M, Kuczyk MA, Merseburger AS, Patard JJ, Mulders PF, Sinescu IC. EAU guidelines on renal cell carcinoma: the 2010 update. Eur Urol 2010; 58:398-406; PMID:20633979; http://dx.doi.org/10.1016/j.eururo.2010.06.032
- Geiger C, Nössner E, Frankenberger B, Falk CS, Pohla H, Schendel DJ. Harnessing innate and adaptive immunity for adoptive cell therapy of renal cell carcinoma. J Mol Med 2009; 87:595-612; PMID:19271159; http://dx.doi.org/10.1007/s00109-009-0455-2
- Schleypen JS, Von Geldern M, Weiss EH, Kotzias N, Rohrmann K, Schendel DJ, Falk CS, Pohla H. Renal cell carcinoma-infiltrating natural killer cells express different repertoires of activating and inhibitory receptors and are inhibited by specific HLA class I allotypes. Int J Cancer 2003; 106:905-12; PMID:12918068; http://dx.doi.org/10.1002/ijc.11321
- Schleypen JS, Baur N, Kammerer R, Nelson PJ, Rohrmann K, Gröne EF, Hohenfellner M, Haferkamp A, Pohla H, Schendel DJ, et al. Cytotoxic markers and frequency predict functional capacity of natural killer cells infiltrating renal cell carcinoma. Clin Cancer Res 2006; 12:718-25; PMID:16467081; http://dx.doi.org/10.1158/1078-0432.CCR-05-0857
- Remark R, Alifano M, Cremer I, Lupo A, Dieu-Nosjean MC, Riquet M, Crozet L, Ouakrim H, Goc J, Cazes A, et al. Characteristics and clinical impacts of the immune environments in colorectal and renal cell carcinoma lung metastases: influence of tumor origin. Clin Cancer Res 2013; 19:4079-91; PMID:23785047; http://dx.doi.org/10.1158/1078-0432.CCR-12-3847
- Nakano O, Sato M, Naito Y, Suzuki K, Orikasa S, Aizawa M, Suzuki Y, Shintaku I, Nagura H, Ohtani H. Proliferative activity of intratumoral CD8+ T lymphocytes as a prognostic factor in human renal cell carcinoma: Clinicopathologic demonstration of antitumor immunity. Cancer Res 2001; 61:5132-6; PMID:11431351
- Hotta K, Sho M, Fujimoto K, Shimada K, Yamato I, Anai S, Konishi N, Hirao Y, Nonomura K, Nakajima Y. Prognostic significance of CD45RO+ memory T cells in renal cell carcinoma. Br J Cancer 2011; 105:1191-6; PMID:21934683; http://dx.doi.org/10.1038/bjc.2011.368
- Steinman RM, Banchereau J. Taking dendritic cells into medicine. Nature 2007; 449: 419-26; PMID:17898760; http://dx.doi.org/10.1038/nature06175
- Moretta A. The dialogue between human natural killer cells and dendritic cells. Curr Opin Immunol 2005; 17:306-11; PMID:15886122; http://dx.doi.org/10.1016/j.coi.2005.03.004
- Wehner R, Dietze K, Bachmann M, Schmitz M. The bidirectional crosstalk between human dendritic cells and natural killer cells. J Innate Immun 2011; 3:258-63; PMID:21411969; http://dx.doi.org/10.1159/000323923
- Palucka K, Banchereau J. Cancer immunotherapy via dendritic cells. Nat Rev Cancer 2012; 12:265-77; PMID:22437871; http://dx.doi.org/10.1038/nrc3258
- Mayordomo JI, Zorina T, Storkus WJ, Zitvogel L, Celluzzi C, Falo LD, Melief CJ, Ildstad ST, Kast WM, Deleo AB, et al. Bone marrow-derived dendritic cells pulsed with synthetic tumor peptides elicit protective and therapeutic antitumour immunity. Nat Med 1995; 1:1297-302; PMID:7489412; http://dx.doi.org/10.1038/nm1295-1297
- Nair SK, Heiser A, Boczkowski D, Majumdar A, Naoe M, Lebkowski JS, Vieweg J, Gilboa E. Induction of cytotoxic T cell responses and tumor immunity against unrelated tumors using telomerase reverse transcriptase RNA transfected dendritic cells. Nat Med 2000; 6:1011-7; PMID:10973321; http://dx.doi.org/10.1038/79519
- Nestle FO, Alijagic S, Gilliet M, Sun Y, Grabbe S, Dummer R, Burg G, Schadendorf D. Vaccination of melanoma patients with peptide- or tumor lysate-pulsed dendritic cells. Nat Med 1998; 4:328-32; PMID:9500607; http://dx.doi.org/10.1038/nm0398-328
- Wierecky J, Müller MR, Wirths S, Halder-Oehler E, Dörfel D, Schmidt SM, Häntschel M, Brugger W, Schröder S, Horger MS, et al. Immunologic and clinical responses after vaccinations with peptide-pulsed dendritic cells in metastatic renal cancer patients. Cancer Res 2006; 66:5910-8; PMID:16740731; http://dx.doi.org/10.1158/0008-5472.CAN-05-3905
- Kantoff PW, Higano CS, Shore ND, Berger ER, Small EJ, Penson DF, Redfern CH, Ferrari AC, Dreicer R, Sims RB, et al. Sipuleucel-T immunotherapy for castration-resistent prostate cancer. N Engl J Med 2010; 363:411-22; PMID:20818862; http://dx.doi.org/10.1056/NEJMoa1001294
- Schäkel K, Mayer E, Federle C, Schmitz M, Riethmüller G, Rieber EP. A novel dendritic cell population in human blood: one-step immunomagnetic isolation by a specific mAb (M-DC8) and in vitro priming of cytotoxic T lymphocytes. Eur J Immunol 1998; 28:4084-93; PMID:9862344; http://dx.doi.org/10.1002/(SICI)1521-4141(199812)28:12%3c4084::AID-IMMU4084%3e3.0.CO;2-4
- Schäkel K, Kannagi R, Kniep B, Goto Y, Mitsuoka C, Zwirner J, Soruri A, von Kietzell M, Rieber EP. 6-Sulfo LacNAc, a novel carbohydrate modification of PSGL-1, defines an inflammatory type of human dendritic cells. Immunity 2002; 17:289-301; PMID:12354382; http://dx.doi.org/10.1016/S1074-7613(02)00393-X
- Schäkel K, von Kietzell M, Hänsel A, Ebling A, Schulze L, Haase M, Semmler C, Sarfati M, Barclay AN, Randolph GJ, et al. Human 6-sulfo LacNAc-expressing dendritic cells are principal producers of early interleukin-12 and are controlled by erythrocytes. Immunity 2006; 24:767-77; PMID:16782032; http://dx.doi.org/10.1016/j.immuni.2006.03.020
- Hänsel A, Günther C, Ingwersen J, Starke J, Schmitz M, Bachmann M, Meurer M, Rieber EP, Schäkel K. Human slan (6-sulfo LacNAc) dendritic cells are inflammatory dermal dendritic cells in psoriasis and drive strong Th17/Th1 T-cell responses. J Allergy Clin Immunol 2011; 127:787-94; PMID:21377044; http://dx.doi.org/10.1016/j.jaci.2010.12.009
- Döbel T, Kunze A, Babatz J, Tränkner K, Ludwig A, Schmitz M, Enk AH, Schäkel K. FcgRIII equips immature 6-sulfo LacNAc-expressing dendritic cells (slanDCs) with a unique capacity to handle IgG-complexed antigens. Blood 2013; 121:3609-18; PMID:23460612; http://dx.doi.org/10.1182/blood-2012-08-447045
- Schmitz M, Zhao S, Schäkel K, Bornhäuser M, Ockert D, Rieber EP. Native human blood dendritic cells as potent effectors in antibody-dependent cellular cytotoxicity. Blood 2002; 100:1502-4; PMID:12149240; http://dx.doi.org/10.1182/blood-2001-12-0304
- Schmitz M, Zhao S, Deuse Y, Schäkel K, Wehner R, Wöhner H, Hölig K, Wienforth F, Kiessling A, Bornhäuser M, et al. Tumoricidal potential of native blood dendritic cells: direct tumor cell killing and activation of NK cell-mediated cytotoxicity. J Immunol 2005; 174:4127-34; PMID:15778372; http://dx.doi.org/10.4049/jimmunol.174.7.4127
- Wehner R, Löbel B, Bornhäuser M, Schäkel K, Cartellieri M, Bachmann M, Rieber EP, Schmitz M. Reciprocal activating interaction between 6-sulfo LacNAc(+) dendritic cells and NK cells. Int J Cancer 2009; 124:358-66; PMID:18942710; http://dx.doi.org/10.1002/ijc.23962
- Hänsel A, Günther C, Baran W, Bidier M, Lorenz HM, Schmitz M, Bachmann M, Döbel T, Enk AH, Schäkel K. Human 6-sulfo LacNAc (slan) dendritic cells have molecular and functional features of an important pro-inflammatory cell type in lupus erythematosus. J Autoimmun 2013; 40:1-8; PMID:22890025; http://dx.doi.org/10.1016/j.jaut.2012.07.005
- Vermi W, Micheletti A, Lonardi S, Costantini C, Calzetti F, Nascimbeni R, Bugatti M, Codazzi M, Pinter PC, Schäkel K, et al. slanDCs selectively accumulate in carcinoma-draining lymph nodes and marginate metastatic cells. Nat Commun 2014; 5:3029; PMID:24398631; http://dx.doi.org/10.1038/ncomms4029
- Vermi W, Lonardi S, Bugatti M, Calzetti F, Micheletti A, Cassatella MA. slanDCs in carcinoma-draining lymph nodes. Oncoimmunology 2014; 3:e28246; PMID:24843832
- Manavalan JS, Rossi PC, Vlad G, Piazza F, Yarilina A, Cortesini R, Mancini D, Suciu-Foca N. High expression of ILT3 and ILT4 is a general feature of tolerogenic dendritic cells. Transpl Immunol 2003; 11:245-58; PMID:12967778; http://dx.doi.org/10.1016/S0966-3274(03)00058-3
- Seliger B, Fedorushchenko A, Brenner W, Ackermann A, Atkins D, Hanash S, Lichtenfels R. Ubiquitin COOH-terminal hydrolase 1: a biomarker of renal cell carcinoma associated with enhanced tumor cell proliferation and migration. Clin Cancer Res 2007; 13:27-37; PMID:17200335; http://dx.doi.org/10.1158/1078-0432.CCR-06-0824
- Zou W, Chen L. Inhibitory B7-family molecules in the tumour microenvironment. Nat Rev Immunol 2008; 8:467-77; PMID:18500231; http://dx.doi.org/10.1038/nri2326
- Seliger B, Quandt D. The expression, function, and clinical relevance of B7 family members in cancer. Cancer Immunol Immunother 2012; 61:1327-41; PMID:22695874; http://dx.doi.org/10.1007/s00262-012-1293-6
- Thurnher M, Radmayr C, Ramoner R, Ebner S, Böck G, Klocker H, Romani N, Bartsch G. Human renal-cell carcinoma tissue contains dendritic cells. Int J Cancer 1996; 68:1-7; PMID:8895531; http://dx.doi.org/10.1002/(SICI)1097-0215(19960927)68:1%3c1::AID-IJC1%3e3.0.CO;2-V
- Troy AJ, Summers KL, Davidson PJ, Atkinson CH, Hart DN. Minimal recruitment and activation of dendritic cells within renal cell carcinoma. Clin Cancer Res 1998; 4:585-93; PMID:9533525
- Middel P, Brauneck S, Meyer W, Radzun HJ. Chemokine-mediated distribution of dendritic cell subsets in renal cell carcinoma. BMC Cancer 2010; 10:578; PMID:20969772; http://dx.doi.org/10.1186/1471-2407-10-578
- Figel AM, Brech D, Prinz PU, Lettenmeyer UK, Eckl J, Turqueti-Neves A, Mysliwietz J, Anz D, Rieth N, Muenchmeier N, et al. Human renal cell carcinoma induces a dendritic cell subset that uses T-cell crosstalk for tumor-permissive milieu alterations. Am J Pathol 2011; 179:436-51; PMID:21703422; http://dx.doi.org/10.1016/j.ajpath.2011.03.011
- Mantovani A, Allavena P, Sica A, Balkwill F. Cancer-related inflammation. Nature 2008; 454:436-44; PMID:18650914; http://dx.doi.org/10.1038/nature07205
- Disis ML. Immune regulation of Cancer. J Clin Oncol 2010; 28:4531-8; PMID:20516428; http://dx.doi.org/10.1200/JCO.2009.27.2146
- Fridman WH, Pagès F, Sautès-Fridman C, Galon J. The immune contexture in human tumours: impact on clinical outcome. Nat Rev Cancer 2012; 12:298-306; PMID:22419253; http://dx.doi.org/10.1038/nrc3245
- Giraldo NA, Becht E, Remark R, Damotte D, Sautès-Fridman C, Fridman WH. The immune contexture of primary and metastatic human tumours. Curr Opin Immunol 2014; 27:8-15; PMID:24487185; http://dx.doi.org/10.1016/j.coi.2014.01.001
- Galon J, Costes A, Sanchez-Cabo F, Kirilovsky A, Mlecnik B, Lagorce-Pagès C, Tosolini M, Camus M, Berger A, Wind P, et al. Type, density, and location of immune cells within human colorectal tumors predict clinical outcome. Science 2006; 313:1960-4; PMID:17008531; http://dx.doi.org/10.1126/science.1129139
- Pagès F, Kirilovsky A, Mlecnik B, Asslaber M, Tosolini M, Bindea G, Lagorce C, Wind P, Marliot F, Bruneval P, et al. In situ cytotoxic and memory T cells predict outcome in patients with early-stage colorectal cancer. J Clin Oncol 2009; 27:5944-51; PMID:19858404; http://dx.doi.org/10.1200/JCO.2008.19.6147
- Qian BZ, Pollard JW. Macrophage diversity enhances tumor progression and metastasis. Cell 2010; 141:39-51; PMID:20371344; http://dx.doi.org/10.1016/j.cell.2010.03.014
- Vicari AP, Caux C, Trinchieri G. Tumour escape from immune surveillance through dendritic cell inactivation. Semin Cancer Biol 2002; 12:33-42; PMID:11926410; http://dx.doi.org/10.1006/scbi.2001.0400
- Zou W. Immunosuppressive networks in the tumour environment and their therapeutic relevance. Nat Rev Cancer 2005; 5:263-74; PMID:15776005; http://dx.doi.org/10.1038/nrc1586
- Ma Y, Aymeric L, Locher C, Kroemer G, Zitvogel L. The dendritic cell-tumor cross talk in cancer. Curr Opin Immunol 2011; 23:146-52; PMID:20970973; http://dx.doi.org/10.1016/j.coi.2010.09.008
- Gabrilovich DI, Chen HL, Girgis KR, Cunningham HT, Meny GM, Nadaf S, Kavanaugh D, Carbone DP. Production of vascular endothelial growth factor by human tumors inhibits the functional maturation of dendritic cells. Nat Med 1996; 2:1096-103; PMID:8837607; http://dx.doi.org/10.1038/nm1096-1096
- Menetrier-Caux C, Montmain G, Dieu MC, Bain C, Favrot MC, Caux C, Blay JY. Inhibition of differentiation of dendritic cells from CD34(+) progenitors by tumor cells: role of interleukin-6 and macrophage colony-stimulating factor. Blood 1998; 92:4778-91; PMID:9845545
- Zou W, Machelon V, Coulomb-L'Hermin A, Borvak J, Nome F, Isaeva T, Wei S, Krzysiek R, Durand-Gasselin I, Gordon A, et al. Stromal-derived factor-1 in human tumors recruits and alters function of plamacytoid precursor dendritic cells. Nat Med 2001; 7:1339-46; PMID:11726975; http://dx.doi.org/10.1038/nm1201-1339
- Fuhrman SA, Lasky LC, Limas C. Prognostic significance of morphologic parameters in renal cell carcinoma. Am J Surg Pathol 1982; 6:655-63; PMID:7180965; http://dx.doi.org/10.1097/00000478-198210000-00007
- Sobin LH, Gospodarowicz MK, Wittekind C, eds. Classification of malignant tumors. Oxford, UK: Wiley-Blackwell; 2009.