
Abstract
In human tumors of distinct origin including renal cell carcinoma (RCC), the non-classical human leukocyte antigen G (HLA-G) is frequently expressed, thereby inhibiting the cytotoxic activity of T and natural killer (NK) cells. Recent studies demonstrated a strong post-transcriptional gene regulation of the HLA-G by miR-152, −148A, −148B and −133A. Standard methods were applied to characterize the expression and function of HLA-G, HLA-G-regulatory microRNAs (miRs) and the immune cell infiltration in 453 RCC lesions using a tissue microarray and five RCC cell lines linking these results to clinical parameters. Direct interactions with HLA-G regulatory miRs and the HLA-G 3′ untranslated region (UTR) were detected and the affinities of these different miRs to the HLA-G 3′-UTR compared. qPCR analyses and immunohistochemical staining revealed an inverse expression of miR-148A and −133A with the HLA-G protein in situ and in vitro. Stable miR overexpression caused a downregulation of HLA-G protein enhancing the NK and LAK cell-mediated cytotoxicity in in vitro CD107a activation assays revealing a HLA-G-dependent cytotoxic activity of immune effector cells. A significant higher frequency of CD3+/CD8+ T cell lymphocytes, but no differences in the activation markers CD69, CD25 or in the presence of CD56+, FoxP3+ and CD4+ immune cells were detected in HLA-G+ compared to HLA-G− RCC lesions. This could be associated with higher WHO grade, but not with a disease-specific survival. These data suggest a miR-mediated control of HLA-G expression in RCC, which is associated with a distinct pattern of immune cell infiltration.
Abbreviations:
- ACTB, β-actin
- APM, antigen processing machinery
- β2-m, β-2-microglobulin
- β-gal, β-galactosidase
- B7-H1, B7 homolog 1
- CDS, coding sequence; Cr, chromium
- COPZ2, coatomer protein complex, subunit zeta 2
- DAC, 5′-aza-2′-desoxycytidine, GAPDH, glyceraldehyde-3-phosphate dehydrogenase
- HLA-G, human leukocyte antigen G
- HRP, horseradish peroxidase
- IHC, immunohistochemistry
- IL, interleukin
- ILT, immunoglobulin-like transcript
- IFNγ, interferon gamma
- LAK, lymphokine-activated killer cell
- luc, luciferase
- mAb, monoclonal antibody
- MDSC, myeloid-derived suppressor cells
- MFI, mean-specific fluorescence intensity
- miR, microRNA
- miTRAP, miRNA trapping by RNA in vitro affinity purification
- n.d., not determined
- NK, natural killer cell
- n.o.s., not otherwise specified; ntc., non-template control
- sHLA-G, soluble HLA-G
- SNP, single nucleotide polymorphism
- RCC, renal cell carcinoma
- TGF-β, transforming growth factor β
- TIL, tumor infiltrating lymphocyte
- TMA, tissue microarray
- Treg, regulatory T cell
- UTR, untranslated region
- WB, Western blot analysis
- WT, wild type
Introduction
Although the non-classical HLA-G exerts some similarities to the classical HLA class Ia molecules, it differs from those in regard to its limited allelic variability, the existence of seven isoforms generated by alternative splicing and its restricted physiologic expression to mainly immune-privileged tissues, e.g. cytotrophoblasts, but also organs sustaining erythropoiesis.Citation1,2 HLA-G can counteract immune cell activation by its interaction with inhibitory lymphocyte receptors like the immunoglobulin-like transcript (ILT)2, ILT4 and the killer immunoglobulin-like receptor KIR2DL4 on NK, T, B, dendritic cells (DC) and neutrophils.Citation3-6 In addition, HLA-G induces apoptosis of activated CD8+ T cells and suppresses CD4+ T cell proliferation in response to allogenic stimulation.Citation7-9
HLA-G expression is controlled at the epigenetic, transcriptional, post-transcriptional as well as post-translational level.Citation10 DNA methylation and hypoacetylation of the histones H3 and H4 represent a regulatory process of HLA-G expression.Citation11 Despite its low polymorphism when compared to classical HLA class I antigens, there exists a high frequency of nucleotide variability in the promoter as well as in the 3′ untranslated region (3′-UTR) of HLA-G. Furthermore, the 3′-UTR of HLA-G has been suggested as a target for several miRs. miRs represent a class of non-coding RNA molecules with approximately 22 nucleotides in length and regulate sequence-specific gene expression by binding preferentially to the 3′-UTR of mRNAs leading to translational inhibition and/or degradation of the target mRNA.Citation12-14
Under pathophysiologic conditions, constitutive HLA-G expression could be frequently found in both haematopoietic and solid tumors including RCC,Citation15 which could be correlated in some tumor entities with an unfavorable prognosis and a poor clinical outcome of patients. In addition, high levels of soluble HLA-G have been detected in sera and ascites of tumor patients, which correlated with an advanced disease status and high tumor load and thus might represent a marker for tumor prognosis.Citation16-18 The discordant HLA-G mRNA and protein expression in tumors suggest a post-transcriptional gene regulation of HLA-G. Indeed, members of the miR-148 family and miR-133A have been recently identified to target the 3′-UTR of HLA-G.Citation13,14,19-21 Their biologic activity seemed to be sufficient to control HLA-G expression levels under physiologic conditions thereby increasing NK cell-mediated killing in vitro.
Despite miR-148 family members might exert tumor suppressive activity,Citation22-31 there exists no information about the clinical relevance of these miRs and their correlation to HLA-G expression in RCC. To characterize the underlying mechanisms of the post-transcriptional control of HLA-G in tumors, a set of human RCC cell lines and lesions was analyzed for their HLA-G transcript, protein and miR expression pattern. A direct interaction between HLA-G-specific miRs and the HLA-G 3′-UTR was confirmed by an miR-enrichment assay termed miTRAP.Citation34 The functional consequences of HLA-G-specific miRs were established by generation of stable miR transfectants followed by determination of HLA-G expression levels and immune recognition. Furthermore, the clinical relevance of HLA-G and HLA-G-specific miRs and their association with the immune cell infiltration of RCC lesions was investigated by immunohistochemical analysis of tissue microarrays (TMA) and correlated to the clinicopathologic parameters of the patients.
Results
Expression pattern of candidate miRs controlling HLA-G in RCC cell lines
Although the miR-148 family members miR-148A/B and miR-152 as well as the miR-133A have been suggested to target the 3′-UTR of HLA-G and affect NK cell-mediated cytotoxicity,Citation14,21,32,33 the role of these miRs in tumors including RCC has not yet been investigated. Therefore, the expression profiles of the four miRs were first analyzed in RCC cell lines and correlated to the HLA-G expression levels. As representatively shown in for some selected model systems, RCC cell lines expressed heterogeneous HLA-G transcript levels as well as different splicing patterns when compared to JEG-3 cells, which serve as positive control. Despite HLA-G transcript was detectable in two (MZ2733RC and MZ2905RC) of five RCC cell lines, the corresponding protein was only detectable in RCC cell line MZ2733RC ().
Figure 1. Expression of HLA-G and HLA-G-specific miRs in human tumor cell lines. (A) Detection and quantification of HLA-G mRNA. The HLA-G-specific PCR products and different splice variants could be detected in JEG-3, MZ2733RC and MZ2905RC according to Real and co-authors.Citation52 (B) Detection of HLA-G protein by Western blot analysis. Western blot analysis of selected cell lines were performed as described in Materials and Methods using the anti-HLA-G mAb MEM-G/4. Staining with the β-actin mAb served as loading control. The cell lines JEG-3 and MZ2733RC revealed HLA-G protein expression. (C) Heterogeneous expression of selected miRs in RCC cell lines. An inverse expression pattern of the HLA-G-specific miR candidates miR-152 and miR-148A and HLA-G protein was detected in the HLA-G+ cell lines JEG-3 and MZ2733RC. The HLA-G non-relevant miR-141 did not show an inverse expression pattern. (D) miR-148 family members were enriched and miR-133A only marginal enriched using the miTRAP assay as recently described.Citation34 The results are expressed in absolute copy number and as mean values of three. The HLA-G non-relevant miR-141 (present in the input control) could not be enriched.
In addition, a heterogeneous expression pattern of a HLA-G-specific miR panel was detected in the RCC cell lines analyzed (): The HLA-G mRNA+/protein− MZ2905RC cells showed the highest miR-152 expression, while the HLA-G mRNA+/protein+ JEG-3 cells displayed an approximately 1.000-fold lower miR-152 expression level when compared to the RCC cell lines. Interestingly, the HLA-G mRNA+/protein+ RCC cell line MZ2733RC exhibited a 100-fold reduced expression of miR-148A compared to all other analyzed cell lines, whereas miR-148B was only marginally expressed in the cell systems. However, the miR-133A showed no difference in their expression in the analyzed cell lines. The HLA-G non-relevant miR-141 and miR-541 serving as internal controls were also quantified. While miR141 was moderately expressed in all cell systems, miR-541 was not detectable. Noteworthy, HLA-G protein and miR152 and miR-148A expression levels in the JEG-3 and in the 2 RCC cell lines (MZ2733RC and MZ2905RC) were inversely correlated. The direct interaction between the reported HLA-G regulatory miRs with the 3′-UTR of HLA-G was investigated by their specific enrichment from a cell lysate of the HLA-G mRNA+/protein− RCC cell line MZ2905RC using the miTRAP technique.Citation34 Employing the in vitro transcribed HLA-G 3′-UTR as a bait, an enrichment of all members of the miR-148 family as well as of miR-133A was found, whereas the HLA-G non-relevant miR-141 was present in the Input could not be enriched (). The affinity of the miRs relevant for the HLA-G 3′-UTR can be defined as follows: miR-152 > miR-148A > miR-148B > miR-133A. Therefore, a quotient (enrichment factor) of specifically enriched miRs applying the HLA-G 3′-UTR as bait and unspecific enriched miRs using a mock sequence of four MS2 loops as bait was calculated.
To compare the affinity of HLA-G regulatory miRs to the HLA-G 3′-UTR, the miTRAP experiment has a preference to experiments of overexpressing miRs by plasmids or transiently transfection of precursor-miR-constructs, which is based on the fact that a correct processing of the miR constructs is required for their biological function and this processing is affected by the sequence of the miR flanking regions. These miR specific effects could negatively influence the results of such reporter gene experiments as comparison of the affinity of different miRs to one target.
The miR-152 showed by far the highest affinity for the HLA-G 3′-UTR and was therefore overexpressed in HLA-G+ cells to investigate the immune modulatory potential of HLA-G in vitro.
Effects of HLA-G-specific miRs on the immune response
As reported in Manaster et al., 2012Citation14 the JEG-3 cells are an inappropriate model system to investigate a HLA-G-dependent cytotoxicity of immune effector cells. In order to determine the influence of the miR-152-mediated silencing of HLA-G on the immune effector cell-mediated cytotoxicity, a murine model system based on NIH/3T3 cells transfected with HLA-G (CDS and 3'-UTR) and/or respective miR expression vector was generated (). The use of these cell systems was possible since the endogenously expressed miR-152 of murine and human origin exert sequence homology (www.mirbase.org). NIH/3T3 cells lack the expression of putative other inhibitory molecules for human immune effector cells. Stable HLA-G transfectants of NIH/3T3 cells displayed higher HLA-G protein expression levels when compared to HLA-G+ JEG-3 cells (). The co-expression of miR-152 in HLA-G+ NIH/3T3 cells resulted in a downregulation of HLAG-specific mRNA, which was accompanied by a total loss of HLA-G protein in these cells. The expression of human HLA-G protects the murine cells from the lysis by human NK and LAK cells (). Nevertheless, the miR-152-mediated downregulation of HLA-G in the transfectants at least partially restored their sensitivity to LAK and NK cell-mediated lysis, demonstrating the immune modulatory effect of HLA-G in vitro.
Figure 2. Association of miR-152-mediated regulation of HLA-G expression with altered NK and LAK cell cytotoxicity (A) Characterization of the murine NIH/3T3 transfection system expressing human HLA-G (CDS and 3'-UTR) and miR-152 by Western Blot. (B & C) CD107a degranulation assay applying human NK cells (B) and LAK cells (C) as immune effector cells and a murine NIH/3T3-based transfection system expressing human HLA-G and miR-152 as target cells. The NIH/3T3 transfectants are lysed HLA-G dependent by the immune effector cells (E:T ratio is 10:1).
Inverse expression of HLA-G and HLA-G regulatory miRs in RCC lesions and their clinical relevance
The frequency of HLA-G expression was assessed in RCC lesions using a TMA consisting of 453 RCC lesions and matched normal kidney epithelium. 216 of 433 (49.9%) RCC samples showed a membranous, 165 of 433 (38.1%) a cytoplasmic expression of HLA-G, but the staining intensity strongly varied (). Indeed, cytoplasmic HLA-G staining is associated to WHO grade (p = 0.014). Grade 3 tumors more frequently demonstrate strong cytoplasmic HLA-G staining than those of lower grade (). To further assess whether the inverse correlation between the expression levels of HLA-G and its regulatory miRs detected in vitro also exists in situ 36 selected HLA-G+ and 36 HLA-G− RCC lesions were monitored for miR-133A, miR-148A, miR-148B and miR-152 expression. The expression levels of miR-133A and miR-148A, but not of miR-152 were significantly (for miR-133A almost significantly) decreased in HLA-G+ RCC lesions when compared to HLAG− RCC lesions (). Referring to the data obtained from the RCC cell lines, the miR-148B was only barely detectable in HLA-G− and HLA-G+ RCC lesions (data not shown).
Figure 3. Inverse correlation of HLA-G and HLA-G relevant miR expression in RCC tumor lesions. (A) Representative immunohistochemical staining for a HLA-G− RCC lesion (sample II5, WHO grade: G2). (B) Representative immunohistochemical staining for a HLA-G+ RCC lesion (sample II39, WHO grade: G2). (C, D, E) Quantification of the expression of miR-148A (C), miR-152 (D) and miR-133A (E) by qPCR in 36 HLAG− and 36 HLA-G+ RCC lesions (listed in ), respectively. The absolute copy number determination is visualized as Box–Whisker plot. Statistical analyses were performed as described in Materials and Methods.
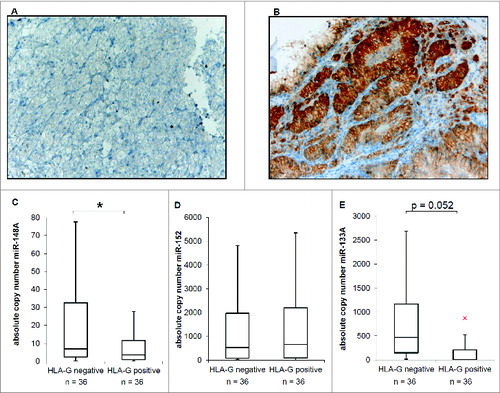
Table 1. Characteristics of the 72 RCC lesions (36 HLA-G− and 36 HLA-G+) analyzed for miR-148A, miR-152 and miR-133A
Table 3. Correlation of HLA-G expression with WHO grade
Many recent studies demonstrated the tumor suppressive function of the miR133A and the miRs of the miR-148 family.Citation22,24,28,29,31,46,54,57,58 This inverse correlation of lowered miR-133A and miR-148A expression levels and higher HLA-G staining intensity was for both miRs. High HLA-G protein levels and the reduced miR-133A/miR-148A expression can be linked to each other and to the WHO grade.
Correlation of the immune cell infiltration with HLA-G expression in RCC
The infiltration of immune effector cells in RCC lesions was determined in the 72 selected RCC lesions (Table 1) using antibodies directed against CD3, CD4, CD8, CD56, FoxP3 and the activation markers CD69 and CD25. As shown in and respectively in Supplemental Figure 1, the 36 HLA-G+ RCC lesions had a statistically significant higher frequency of CD3+ and CD8+ T cells (p < 0.001), but not of CD4+ or CD56+ cells. While the NK, NKT and CD4+ T cell infiltration did not vary, a significant difference in CD3+ (p < 0.001) and CD8+ cytotoxic T cells (CTL; p < 0.001) between HLA-G+ and HLA-G− RCC lesions was detected. The frequency of CD4+ () and FoxP3+ (data not shown) T cells was low and independent of HLA-G expression.
Figure 4. Immunohistochemical staining of tumor-infiltrating lymphocytes in RCC lesions (TMAs). (A) : Representative immunohistochemical staining of CD3+ and CD8+ TILs on a HLA-G− and HLA-G+ RCC lesion revealing statistical significant higher numbers of CD3+ and CD8+ T lymphocytes in HLA-G+ tumors. (B) Mean numbers of CD3+, CD8+, CD4+, CD56+ and CD69+ cells per field of view in 36 HLA-G− and 36 HLA-G+ RCC lesions (listed in ) visualized as Box–Whiskers-Blots. Only CD3+ (p < 0,001) and CD8+ (p < 0,001) TILs showed significant differences in the presence in the HLA-G+ and HLA-G− cohorts.
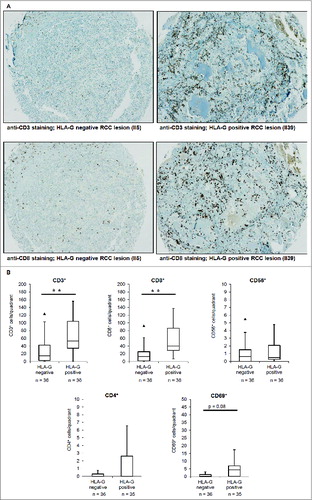
The activity of the CD3+ and CD8+ CTL was determined by staining of CD69 and CD25 activation markers. A higher, but not statistically significant number of CD69+ cells (p = 0.08) was found in HLA-G+ tumors (). In contrast, CD25+ T cells were barely detectable in all RCC lesions independent of HLA-G status. The increased frequency of CD3+ and CD8+ T cells in HLA-G+ tumors did correlate with HLA-G expression (staining intensity) and therefore also with a higher WHO grading and further strengthens the immune modulatory potential of HLA-G.
Correlation between the presence of tumor-infiltrating lymphocytes and the disease-specific survival of RCC patients
To address whether HLA-G expression (staining intensity) and/or the frequency of tumor-infiltrating lymphocytes (TILs) of RCC lesions contribute to survival of RCC patients, the immunohistochemistry (IHC) data of HLA-G, CD3, CD8, CD4, CD56, CD69, CD25 and FoxP3 were tested for correlations with disease-specific survival ().
Figure 5. Correlation between the presence or absence of TILs and the HLA-G expression with disease-specific survival of the patients visualized as Kaplan–Meier-Plots. Kaplan–Meier-Plots of disease-specific survival in relation to HLA-G expression and tumor-infiltrating lymphocytes. The presence of CD4+ cells was associated (but not significant; p = 0.097) with better disease-specific survival. The markers HLA-G, CD3, CD8, CD56, CD4, FOXP3, CD 69 and CD 25 showed no significant correlation to disease-specific survival.
HLA-G expression had almost no effect (p = 0.67) on the disease-specific survival of RCC patients. Neither HLA-G expression, CD69, CD56, CD3, CD4, CD8, CD25 nor FOXP3 expression demonstrated significant correlations to disease-specific survival of RCC patients. Only the presence of CD4+ cells appear to contribute to a better disease-specific survival, but which was not statistically significant (p = 0.097; ).
Discussion
HLA-G expression has been demonstrated in RCC cells at a high frequency, thereby protecting tumor cells from immune cell-mediated cytotoxicity.Citation35 However, RCC and other tumor cells often show a discordant expression of HLA-G mRNA and proteinCitation19 suggesting a post transcriptional gene regulation of HLA-G by e.g. HLA-G-specific miRs. This concept was further supported by the recent identification of miR-148A, miR-148B, miR-152 and miR-133A directly targeting the 3′-UTR of HLA-G.Citation14,21,33,36 Since these miRs are reported to control HLA-G expression, the current study explored the nature of these interactions by analyzing the binding characteristics of these miRs to HLA-G mRNA, their tissue-specific expression pattern and functional consequences. In addition, HLA-G protein levels were correlated with the HLA-G-specific miRs, immune cell infiltration and WHO grade.
The direct interaction between the miR-148 family members and the HLA-G 3′-UTR was confirmed in RCC cells using the miTRAP technology demonstrating a strong enrichment of miR-152 and to a lesser extent of miR-148A when compared to controls, which might be due to their lower constitutive expression levels in the RCC cell line used for cell lysate (MZ2905RC). Surprisingly, miR-133A was very weak enriched. Indeed, Wang et al., 2012Citation21 report that miR-133A does not affect HLA-G mRNA but reduces HLA-G protein level if overexpressed in JEG-3 cells.
Since JEG-3 cells have been demonstrated as a not valuable model for analyzing the HLAG-dependent cytotoxicity of immune effector cells. Murine NIH/3T3 cells overexpressing HLA-G (CDS & 3'-UTR) were generated. Since HLA-G could be detected as β2-m-free dimers or even trimers on the cell surfaceCitation37,38 the lack of human β2-m for human MHC class I molecules is not interfering with cytotoxicity. Transfection of HLA-G expressing NIH/3T3 cells with miR-152 strongly down regulates HLA-G expression, which is in line with reports describing the expression and processing of human miRs in murine NIH/3T3 cells.Citation39,40 While HLA-G expressing NIH/3T3 cells were completely resistant to NK or LAK cell-mediated cytotoxicity, miR-152 overexpression caused a partial restoration of LAK cell activity suggesting that miR-152 could alter the HLA-G-induced tolerogenic phenotype. In addition, immunohistochemical staining of a TMA of RCC lesions with an anti-HLA-G monoclonal antibody (mAb) demonstrated a high frequency of HLA-G+ tumor lesions, which was associated with an increased WHO grade, but not with disease-specific survival of RCC patients. This was accompanied by a significantly reduced expression of miR-148A and almost significantly reduced (p = 0.052) miR-133A, but not of miR-152 in HLA-G+ tumor lesions suggesting a prognostic potential of these two miRs. Furthermore, differences in the immune cell infiltration between HLA-G+ and HLA-G− RCC lesions exist, which were only significant for CD3+ and CD8+ cells, but had no impact on patients outcome and might be due to the HLA-G-induced tolerogenic phenotype of HLA-G+ RCC. Indeed, Liu and coworkers (2014) report that increased T cell infiltration in primary RCC tumors can be associated with worse clinical outcome. Maybe our data can explain such observations, due to the correlation of HLA-G expression and higher grading of the RCC tumors on the one hand and on the other one the downregulated tumor suppressive miRs miR-148A and miR-133A and the higher infiltration of mostly inactive CD3+/CD8+ T cells.
However, HLA-G+ RCC lesions exert a very limited infiltration by regulatory T cells (Tregs) as determined by the number of CD25+ and FoxP3+ cells. The presence of CD3−CD4+ cells could be correlated to a better disease-specific survival, but not significantly (p = 0.097). Thus, CD4+ cells in the RCC lesions might represent granulocytes, macrophages or DCs. Further studies should investigate the influence of CD3−CD4+ immune cells in RCC tumor lesions. In this context, it is noteworthy that HLA-G+ gastric tumors were shown to be associated with a significant poorer patients' survival, which is accompanied by an increased number of Tregs.Citation41
The miR-148A gene is located on the short arm of chromosome 7 (7p15.2), the miR-133A on the long arm of chromosome 18 (18q11.2) and a second miR-133A gene is located at the long arm of chromosome 20 (20q13; www.mirbase.org), but so far there exists no common chromosomal defect of the region 7p15.2 in RCCs but for 18q a loss of heterozygosity in RCC is reported by Hirata and coworkers, 2005.Citation53
Instead, RCCs often show polysomy for chromosome 7Citation42-44 or duplication of the region 20q.Citation56 Interestingly, it was recently published that the miRs of the miR-148 family could be silenced upon hypermethylation.Citation45 Thus, the underlying mechanisms of miR-148A downregulation in RCC have still to be investigated in more detail. Since lack of HLA-G expression in tumors is often epigenetically controlled, one might consider an inverse methylation status of HLA-G and HLA-G-specific miRs.
However, the members of the miR-148 family and miR-133A might serve as potential diagnostic markers and provide a novel treatment strategy for tumors, which is in line with its reported tumor suppressor activity.Citation27-29,31,46 Further studies are required to support the tumor suppressive function of the miR-148A family and miR-133A in vivo by inhibiting the tumor immune escape mediated by HLA-G.
Methods
DNA isolation
DNA was isolated from different human cell lines using the QIAamp DNA Mini Kit (Qiagen, Cat. no. 51304) according to the manufacturers' protocol.
RNA and miR isolation, semi-quantitative and quantitative PCR
Total RNA from cell lines was isolated with the TRIzol Reagent (Invitrogen, Cat. no. 15596–026) according to the manufacturers' instructions. The RNA was treated with DNase I (NEB, Cat. no. M0303S). For RNA isolation from paraffin-embedded tissue sections, total RNA was extracted using the MasterPure Complete DNA and RNA Purification Kit (Epicentre Biotechnologies, Cat. no. MC85200) according the manufacturers' protocol.
RNA was reverse transcribed into cDNA using the RevertAidTM H Minus First Strand cDNA synthesis kit (Fermentas, Cat. no. K1631). For miR-specific cDNA synthesis, a miR-specific stem-loop primer altered was used,Citation47,48 while for reverse transcription of mRNA oligo dT primers (Fermentas) or the HLA-G-specific reverse primer (5′- TGAGACAGAGACGGAGACAT-3′) were employed. For semi-quantitative RT-PCR, the Taq DNA polymerase kit (Invitrogen, Cat. no. 10342–020) and for qPCR the Platinum SYBR Green qPCR SuperMiX-UDG (Invitrogen, Cat. no. 11733–038) were applied.
The reactions were run as triplicates of biologic replicates. For qPCR of miRs, the absolute copy numbers were determined against an external miR-specific TOPO-TA plasmid standard (Invitrogen, Cat. no. K4510–22). The miR-specific TOPO-TA plasmids were generated by cloning the respective stem-loop PCR product into this plasmid. All oligonucleotides used for mRNA and miR expression profiling are listed in the .
Table 4. Summary of the primer sequences and annealing temeratures
Tissue microarray and immunohistochemistry
TMA were generated as previously describedCitation49 and consisted of 453 formalin-fixed, paraffin-embedded RCC tissues along with corresponding normal kidney tissue not adjacent to the tumor. The study was approved by the Ethical Committee of the University of Erlangen-Nuremberg (Germany) and conducted according to the principles expressed in the Declaration of Helsinki. The specimens were collected between 1998 and 2011. All specimens were reevaluated by two experienced pathologists (A. Hartmann, V. Spath) including the classification of the RCC subtype and the WHO grade according to the 2004 World Health Organization (WHO) classification.Citation50 A summary of patient and tumor characteristics can be found in .
Table 2. Patients' and tumor characteristics
IHC of 5 μm sections cut from the TMA tissue blocks was performed using the HLAG-specific mAb “4H84” (Abcam, Cat. no. ab52455) at a 1:50 dilution generated with the Antibody Diluent (Dako, Cat. no. S080981–2). In parallel, immune cell infiltrates were monitored using antibodies directed against CD3 (mAb SP7, Thermo Scientific, Cat. no. MA1–90582), CD4 (mAb 1F6, Leica, Cat. no. CD4–1F6-L-CE), CD8 (mAb C8/144B, Dako, Cat. no. IS62330–2), CD56 (mAb MRQ-42, Cell Marque Corporation, Cat. no. 156R-97), CD25 (mAb 4C9, Cell Marque Corporation, Cat. no. 125M-17), CD69 (mAb CH11, Leica, Cat. no. NCL−CD69) and FoxP3 (mAb 236A/E7, Abcam, Cat. no. ab20034), respectively. For visualization, the EnvisionTM detection system (Dako) including a horseradish peroxidase (HRP)-linked anti-mouse secondary antibody and the 3,3′-diaminobenzidine (DAB+) substrate chromogen (Dako) was employed.
Immune cell infiltrates were quantified as mean of the absolute number of positive cells in four high-power fields (magnification x400). HLA-G expression was quantified using an immunoreactive score (IRS) by multiplying the percentage of positive tumor cells by the respective staining intensity (0: negative, 1: weak, 2: moderate, 3: strong staining). The digit in the brackets means the percentage of positively stained cells on the compound.
Cell lines and tissue culture
The HLA-G negative human embryonal kidney cell line HEK293T, the HLA-G positive choriocarcinoma cell line JEG-3, the murine fibroblast cell line NIH/3T3 (all purchased from the American Type Culture Collection (ATCC® CRL-3216™ and ATCC® HTB-36™, ATCC, Manasas, USA)) and a set of five established RCC cell lines derived from patients with RCC (MZ1257RC, MZ1790RC, MZ1795RC, MZ2733RC and MZ2905RC) have been applied. With the exception of JEG-3 cells, which were maintained in RPMI 1640 (Invitrogen), cell lines were cultured in Dulbecco';s modified Eagles medium (DMEM) (Invitrogen) supplemented with 10% (V/V) fetal bovine serum (FCS) (PAA), 2 mM L-glutamine (Lonza) and 1% penicillin/streptomycin (V/V; PAA).
Purified lymphokine-activated killer (LAK) and NK cells derived from peripheral blood samples of healthy volunteers were generated as previously described.Citation15 The identity and purity of NK (96.6%) and LAK cells (92.3%) were confirmed by flow cytometry. The purified NK and LAK cells were cultured in X-vivo 15 medium (Lonza) supplemented with 1% sodium pyruvate, 2 mM L-glutamine and 1% penicillin/streptomycin (V/V) and IL-2 (Millipore).
Protein extraction and western blot analysis
Protein extraction and Western blot analyses were performed as recently described.Citation51 HLA-G protein was detected by using the HLA-G-specific mAb MEM-G/4 (Exbio, Cat. no. Eleven–394-C100), while glyceraldehyde-3-phosphate dehydrogenase (GAPDH) detection with the GAPDH antibody (Cell Signaling, Cat. no. 2118) served as loading control. For detection, HRP-conjugated secondary antibodies (DAKO) and the LumiLight Western blotting substrate (Roche Diagnostics, Cat. no. 12015200001) were applied. The staining was recorded with a CCD camera system (Fuji BAS 3000, Fuji).
Flow cytometry and CD107a activation assays
For flow cytometric analyses, the following mAbs were employed: the fluorescein isothiocyanate (FITC)-labeled mouse anti-human HLA-G MEM-G/9 (Exbio, Cat. no. 1F-292-C100), anti-CD3 (Beckman-Coulter, Cat. no. IM1281U), anti-CD107a (BD PharMingen, Cat. no. 555800) and anti-CD56 (BD PharMingen, Cat. no. 345811) as well as the phycoerythrin (PE)-labeled anti-human-MIC-A/B (Beckman-Coulter) and anti-CD16 (Beckman-Coulter, Cat. no. IM1238U), anti-CD56 (Beckman-Coulter, Cat. no. IM2073U), anti-CD3 (Beckman-Coulter, Cat. no. IM1282U) along with the corresponding isotype controls (Beckman–Coulter). The antibodies were used at concentrations recommended by the manufacturers'; protocol. One × 10Citation5 NK cells or 2 × 10⁵ LAK cells were stained with the respective antibodies and subjected to flow cytometry as recently described using a FACSCAN unit (BD Biosciences) and the FACS Diva analysis software (BD).
For the CD107a activation assay, the purified effector cells (NK cells and LAK cells) were co-cultured with target cells in 96 well plates (round bottom) at an E:T ratio of 10:1. After a brief centrifugation step, the cells were incubated for 4 h and subsequently stained with mAbs directed against CD107a (FITC) and CD56 (PE) for NK cells or against CD107a (FITC) and CD3 (PE) for LAK cells before the cells were analyzed by flow cytometry.
Generation of HLA-G and miR expression vectors and cell transfection
For generation of the HLA-G expression vector cDNA from JEG-3 cells, which is homozygous for the HLA-G allele G*010103, was used as a template. Subsequently, a fusion PCR was performed for the first PCR product using the forward primer 5′-AAAGGATCCCCAAGGATGGTGGTCATGG-3′ and the reverse primer 5′-TTGCCACTCAGTCCCACACAG-3′ and for the generation of the second PCR product the forward primer 5′-TTGCTGGCCTGGTTGTCCTT-3′ and the reverse primer 5′-AAAACGCGTAAAGTTCTCATGTCTTCCATTT-3′. Both overlapping PCR products were purified with agarose gels and used as templates for a fusion PCR with the first forward primer and second reverse primer. The resulting PCR product was cloned into the pMIR-REPORT vector (Ambion, Cat. no. AM5795) using BamHI and MluI (Fermentas, Cat. no. ER0051, Cat. no. ER0561) replacing the luciferase (luc).
The miR genes were cloned with their flanking regions into the pmR-m-cherry vector (Clontech, Cat. no. 632542) using the restriction enzymes XhoI and EcoRI (Fermentas, Cat. no. ER0691, Cat. no. ER0271) as reported by Jasinski-Bergner and co-authors.Citation55
NIH/3T3 cells were stably transfected with the miR and/or the HLA-G expression vectors using the Effectene Transfection Reagent (Qiagen, Cat. no. 301425) according to the manufacturers' protocol.
miR enrichment assay (miTRAP)
To enrich HLA-G-specific miRs, the recently published miTRAP method was employed.Citation34 Briefly, the complete 3′-UTR of HLA-G was cloned upstream of four MS2 loops, in vitro transcribed with Riboprobe (Promega, Cat. no. P1440) and used for the enrichment of HLA-G-specific miRs from cell lysates of the RCC cell line MZ2905RC (HLA-G mRNA+/ protein−). By application of different amounts of fusion protein consisting of the MS2 loop and maltose binding protein domain, 500 pmol of the in vitro-transcribed RNAs (HLA-G 3′-UTR and as a mock control a sequence encoding only the four MS2 loops) were loaded onto amylose beads (NEB, Cat. no. E8021S). After washing and blocking steps with yeast tRNA (Promega) and BSA (NEB, Cat. no. B9000S), the beads were incubated with the cell lysate (for 30 min), then washed with wash buffer before the elution was carried out with maltose solution followed by RNA extraction with TRIzol Reagent (Invitrogen). A specific (500 μl) volume of the cell lysate was used for RNA extraction and used as an input control. The miR enrichment in the eluate was validated by qPCR.
Statistical analyses
Microsoft Excel 2010 (Microsoft Corporation) was used for calculating mean, standard derivation or t-test. For the t-test, two sample-assuming unequal variances have been selected. The data were significant with a p value < 0.05 and marked with a star (or if lower than 0.005 with two stars).
Mean and median of patient's characteristic data were calculated using IBM SPSS Statistics 21 (IBM Corporation). For testing the significance of associations between staining results, WHO grade and miR expression, two-sided chi-square or Spearman Rho test was applied (SPSS). Associations of staining results, miR expression and disease-specific survival were calculated by log rank test (SPSS). Differences were regarded as significant at p < 0.05.
Disclosure of Potential Conflicts of Interest
No potential conflicts of interest were disclosed.
Supplemental Material
Supplemental data for this article can be accessed on the publisher's website.
1008805_Supplementary_Materials.zip
Download Zip (9.8 MB)Acknowledgments
We would like to thank Sylvi Magdeburg and Nicole Ott for excellent secretarial help and Corinna Fahldieck, Rudolf Jung and Verena Popp for excellent technical assistance.
Funding
This work was sponsored by the Deutsche Forschungsgemeinschaft projects DFG 585–9–2 and 11–2, the DFG GRK 1591, the German Israelian Foundation (I-1187–69.11/2012), the German Cancer Aid (111105 and 107967) as well as the intramural Roux program of the Martin Luther University Halle-Wittenberg.
References
- Hviid TV. HLA-G in human reproduction: aspects of genetics, function and pregnancy complications. Hum Reprod Update 2006; 12:209-32; PMID:16280356; http://dx.doi.org/10.1093/humupd/dmi048
- Menier C, Rabreau M, Challier JC, Le Discorde M, Carosella ED, Rouas-Freiss N. Erythroblasts secrete the nonclassical HLA-G molecule from primitive to definitive hematopoiesis. Blood 2004; 104:3153-60; PMID:15284117; http://dx.doi.org/10.1182/blood-2004-03-0809
- Colonna M, Navarro F, Bellon T, Llano M, Garcia P, Samaridis J, Angman L, Cella M, López-Botet M. A common inhibitory receptor for major histocompatibility complex class I molecules on human lymphoid and myelomonocytic cells. J Exp Med 1997; 186:1809-18; PMID:9382880; http://dx.doi.org/10.1084/jem.186.11.1809
- Colonna M, Samaridis J, Cella M, Angman L, Allen RL, O'Callaghan CA, Dunbar R, Ogg GS, Cerundolo V, Rolink A. Human myelomonocytic cells express an inhibitory receptor for classical and nonclassical MHC class I molecules. J Immunol 1998; 160:3096-100; PMID:9531263
- Rajagopalan S, Long EO. A human histocompatibility leukocyte antigen (HLA)-G-specific receptor expressed on all natural killer cells. J Exp Med 1999; 189:1093-100; PMID:10190900; http://dx.doi.org/10.1084/jem.189.7.1093
- Shiroishi M, Tsumoto K, Amano K, Shirakihara Y, Colonna M, Braud VM, Allan DS, Makadzange A, Rowland-Jones S, Willcox B et al. Human inhibitory receptors Ig-like transcript 2 (ILT2) and ILT4 compete with CD8 for MHC class I binding and bind preferentially to HLA-G. Proc Natl Acad Sci USA 2003; 100:8856-61; PMID:12853576; http://dx.doi.org/10.1073/pnas.1431057100
- Bainbridge DR, Ellis SA, Sargent IL. HLA-G suppresses proliferation of CD4(+) T-lymphocytes. J Reprod Immunol 2000; 48:17-26; PMID:10996380; http://dx.doi.org/10.1016/S0165-0378(00)00070-X
- Contini P, Ghio M, Poggi A, Filaci G, Indiveri F, Ferrone S, Puppo F. Soluble HLA-A,-B,-C and -G molecules induce apoptosis in T and NK CD8+ cells and inhibit cytotoxic T cell activity through CD8 ligation. Eur J Immunol 2003; 33:125-34; PMID:12594841; http://dx.doi.org/10.1002/immu.200390015
- Riteau B, Menier C, Khalil-Daher I, Sedlik C, Dausset J, Rouas-Freiss N, Carosella ED. HLA-G inhibits the allogeneic proliferative response. J Reprod Immunol 1999; 43:203-11; PMID:10479056; http://dx.doi.org/10.1016/S0165-0378(99)00034-0
- Rouas-Freiss N, Moreau P, LeMaoult J, Carosella ED. The dual role of HLA-G in cancer. J Immunol Res 2014; 2014:359748; PMID:24800261; http://dx.doi.org/10.1155/2014/359748
- Moreau P, Mouillot G, Rousseau P, Marcou C, Dausset J, Carosella ED. HLA-G gene repression is reversed by demethylation. Proc Natl Acad Sci USA 2003; 100:1191-6; PMID:12552087; http://dx.doi.org/10.1073/pnas.0337539100
- Castelli EC, Mendes-Junior CT, Deghaide NH, de Albuquerque RS, Muniz YC, Simoes RT, Carosella ED, Moreau P, Donadi EA. The genetic structure of 3' untranslated region of the HLA-G gene: polymorphisms and haplotypes. Genes Immun 2010; 11:134-41; PMID:19798077; http://dx.doi.org/10.1038/gene.2009.74
- Castelli EC, Moreau P, Oyae Chiromatzo A, Mendes-Junior CT, Veiga-Castelli LC, Yaghi L, Giuliatti S, Carosella ED, Donadi EA. In silico analysis of microRNAS targeting the HLA-G 3' untranslated region alleles and haplotypes. Hum Immunol 2009; 70:1020-5; PMID:19664672; http://dx.doi.org/10.1016/j.humimm.2009.07.028
- Manaster I, Goldman-Wohl D, Greenfield C, Nachmani D, Tsukerman P, Hamani Y, Yagel S, Mandelboim O. MiRNA-mediated control of HLA-G expression and function. PLoS One 2012; 7:e33395; PMID:22438923; http://dx.doi.org/10.1371/journal.pone.0033395
- Bukur J, Rebmann V, Grosse-Wilde H, Luboldt H, Ruebben H, Drexler I, Sutter G, Huber C, Seliger B. Functional role of human leukocyte antigen-G up-regulation in renal cell carcinoma. Cancer Res 2003; 63:4107-11; PMID:12874014
- Nuckel H, Rebmann V, Durig J, Duhrsen U, Grosse-Wilde H. HLA-G expression is associated with an unfavorable outcome and immunodeficiency in chronic lymphocytic leukemia. Blood 2005; 105:1694-8; PMID:15466928; http://dx.doi.org/10.1182/blood-2004-08-3335
- Sayed D, Badr G, Maximous D, Mikhail NN, Abu-Tarboush F, Alhazza IM. HLA-G and its relation to proliferation index in detection and monitoring breast cancer patients. Tissue Antigens 2010; 75:40-7; PMID:20196818; http://dx.doi.org/10.1111/j.1399-0039.2009.01393.x
- Singer G, Rebmann V, Chen YC, Liu HT, Ali SZ, Reinsberg J, McMaster MT, Pfeiffer K, Chan DW, Wardelmann E et al. HLA-G is a potential tumor marker in malignant ascites. Clin Cancer Res 2003; 9:4460-4; PMID:14555519
- Amiot L, Ferrone S, Grosse-Wilde H, Seliger B. Biology of HLA-G in cancer: a candidate molecule for therapeutic intervention? Cell Mol Life Sci 2011; 68:417-31; PMID:21063893; http://dx.doi.org/10.1007/s00018-010-0583-4
- Veit TD, Chies JA. Tolerance versus immune response – microRNAs as important elements in the regulation of the HLA-G gene expression. Transpl Immunol 2009; 20:229-31; PMID:19038339; http://dx.doi.org/10.1016/j.trim.2008.11.001
- Wang X, Li B, Wang J, Lei J, Liu C, Ma Y, Zhao H. Evidence that miR-133a causes recurrent spontaneous abortion by reducing HLA-G expression. Reprod Biomed Online 2012; 25:415-24; PMID:22877943; http://dx.doi.org/10.1016/j.rbmo.2012.06.022
- Kawakami K, Enokida H, Chiyomaru T, Tatarano S, Yoshino H, Kagara I, Gotanda T, Tachiwada T, Nishiyama K, Nohata N et al. The functional significance of miR-1 and miR-133a in renal cell carcinoma. Eur J Cancer 2012; 48:827-36; PMID:21745735; http://dx.doi.org/10.1016/j.ejca.2011.06.030
- Kinoshita T, Nohata N, Fuse M, Hanazawa T, Kikkawa N, Fujimura L, Watanabe-Takano H, Yamada Y, Yoshino H, Enokida H et al. Tumor suppressive microRNA-133a regulates novel targets: moesin contributes to cancer cell proliferation and invasion in head and neck squamous cell carcinoma. Biochem Biophys Res Commun 2012; 418:378-83; PMID:22266319; http://dx.doi.org/10.1016/j.bbrc.2012.01.030
- Kojima S, Chiyomaru T, Kawakami K, Yoshino H, Enokida H, Nohata N, Fuse M, Ichikawa T, Naya Y, Nakagawa M et al. Tumour suppressors miR-1 and miR-133a target the oncogenic function of purine nucleoside phosphorylase (PNP) in prostate cancer. Br J Cancer 2012; 106:405-13; PMID:22068816; http://dx.doi.org/10.1038/bjc.2011.462
- Moriya Y, Nohata N, Kinoshita T, Mutallip M, Okamoto T, Yoshida S, Suzuki M, Yoshino I, Seki N. Tumor suppressive microRNA-133a regulates novel molecular networks in lung squamous cell carcinoma. J Hum Genet 2012; 57:38-45; PMID:22089643; http://dx.doi.org/10.1038/jhg.2011.126
- Song YX, Yue ZY, Wang ZN, Xu YY, Luo Y, Xu HM, Zhang X, Jiang L, Xing CZ, Zhang Y. MicroRNA-148b is frequently down-regulated in gastric cancer and acts as a tumor suppressor by inhibiting cell proliferation. Mol Cancer 2011; 10:1; PMID:21205300; http://dx.doi.org/10.1186/1476-4598-10-1
- Tsuruta T, Kozaki K, Uesugi A, Furuta M, Hirasawa A, Imoto I, Susumu N, Aoki D, Inazawa J. miR-152 is a tumor suppressor microRNA that is silenced by DNA hypermethylation in endometrial cancer. Cancer Res 2011; 71:6450-62; PMID:21868754; http://dx.doi.org/10.1158/0008-5472.CAN-11-0364
- Xiang Y, Ma N, Wang D, Zhang Y, Zhou J, Wu G, Zhao R, Huang H, Wang X, Qiao Y et al. MiR-152 and miR-185 co-contribute to ovarian cancer cells cisplatin sensitivity by targeting DNMT1 directly: a novel epigenetic therapy independent of decitabine. Oncogene 2014; 33:378-86; PMID:23318422; http://dx.doi.org/10.1038/onc.2012.575
- Zhou X, Zhao F, Wang ZN, Song YX, Chang H, Chiang Y, Xu HM. Altered expression of miR-152 and miR-148a in ovarian cancer is related to cell proliferation. Oncol Rep 2012; 27:447-54; PMID:21971665; http://dx.doi.org/10.3892/or.2011.1482
- Zhou Y, Wu D, Tao J, Qu P, Zhou Z, Hou J. MicroRNA-133 inhibits cell proliferation, migration and invasion by targeting epidermal growth factor receptor and its downstream effector proteins in bladder cancer. Scand J Urol 2013; 47:423-32; PMID:23206218; http://dx.doi.org/10.3109/00365599.2012.748821
- Zhu C, Li J, Ding Q, Cheng G, Zhou H, Tao L, Cai H, Li P, Cao Q, Ju X et al. miR-152 controls migration and invasive potential by targeting TGFalpha in prostate cancer cell lines. Prostate 2013; 73:1082--9; PMID:23460133; http://dx.doi.org/10.1002/pros.22656
- Consiglio CR, Veit TD, Monticielo OA, Mucenic T, Xavier RM, Brenol JC, Chies JA. Association of the HLA-G gene +3142C>G polymorphism with systemic lupus erythematosus. Tissue Antigens 2011; 77:540-5; PMID:21395561; http://dx.doi.org/10.1111/j.1399-0039.2011.01635.x
- Tan Z, Randall G, Fan J, Camoretti-Mercado B, Brockman-Schneider R, Pan L, Solway J, Gern JE, Lemanske RF, Nicolae D et al. Allele-specific targeting of microRNAs to HLA-G and risk of asthma. Am J Hum Genet 2007; 81:829-34; PMID:17847008; http://dx.doi.org/10.1086/521200
- Braun J, Misiak D, Busch B, Krohn K, Huttelmaier S. Rapid identification of regulatory microRNAs by miTRAP (miRNA trapping by RNA in vitro affinity purification). Nucleic Acids Res 2014; 42(8):e66; PMID:24510096; http://dx.doi.org/10.1093/nar/gku127
- Bukur J, Seliger B. The role of HLA-G for protection of human renal cell-carcinoma cells from immune-mediated lysis: implications for immunotherapies. Semin Cancer Biol 2003 (b); 13:353-9; PMID:14708715; http://dx.doi.org/10.1016/S1044-579X(03)00026-9
- Zhu XM, Han T, Wang XH, Li YH, Yang HG, Luo YN, Yin GW, Yao YQ. Overexpression of miR-152 leads to reduced expression of human leukocyte antigen-G and increased natural killer cell mediated cytolysis in JEG-3 cells. Am J Obstet Gynecol 2010; 202:592 e1-7; PMID:20430358; http://dx.doi.org/10.1016/j.ajog.2010.03.002
- Gonen-Gross T, Achdout H, Arnon TI, Gazit R, Stern N, Horejsi V, Goldman-Wohl D, Yagel S, Mandelboim O. The CD85J/leukocyte inhibitory receptor-1 distinguishes between conformed and β 2-microglobulin-free HLA-G molecules. J Immunol 2005; 175:4866-74; PMID:16210588; http://dx.doi.org/10.4049/jimmunol.175.8.4866
- Howangyin KY, Loustau M, Wu J, Alegre E, Daouya M, Caumartin J, Sousa S, Horuzsko A, Carosella ED, Lemaoult J. Multimeric structures of HLA-G isoforms function through differential binding to LILRB receptors. Cell Mol Life Sci 2012; PMID:22802125; http://dx.doi.org/10.1007/s00018-012-1069-3.
- Havens MA, Reich AA, Duelli DM, Hastings ML. Biogenesis of mammalian microRNAs by a non-canonical processing pathway. Nucleic Acids Res 2012; 40:4626-40; PMID:22270084; http://dx.doi.org/10.1093/nar/gks026
- Jiao J, Herl LD, Farese RV, Gao FB. MicroRNA-29b regulates the expression level of human progranulin, a secreted glycoprotein implicated in frontotemporal dementia. PLoS One 2010; 5:e10551; PMID:20479936; http://dx.doi.org/10.1371/journal.pone.0010551
- Tuncel T, Karagoz B, Haholu A, Ozgun A, Emirzeoglu L, Bilgi O, Kandemir EG. Immunoregulatory Function of HLA-G in Gastric Cancer. Asian Pac J Cancer Prev 2013; 14:7681-4; PMID:24460353; http://dx.doi.org/10.7314/APJCP.2013.14.12.7681
- Girgis AH, Iakovlev VV, Beheshti B, Bayani J, Squire JA, Bui A, Mankaruos M, Youssef Y, Khalil B, Khella H et al. Multilevel whole-genome analysis reveals candidate biomarkers in clear cell renal cell carcinoma. Cancer Res 2012; 72:5273-84; PMID:22926558; http://dx.doi.org/10.1158/0008-5472.CAN-12-0656
- Kuroda N, Tamura M, Shiotsu T, Nakamura S, Taguchi T, Tominaga A, Hes O, Michal M, Kawada C, Shuin T et al. Chromosomal abnormalities of clear cell renal cell carcinoma: frequent gain of chromosome 7. Pathol Int 2010; 60:9-13; PMID:20055946; http://dx.doi.org/10.1111/j.1440-1827.2009.02467.x
- Reid-Nicholson MD, Motiwala N, Drury SC, Peiper SC, Terris MK, Waller JL, Ramalingam P. Chromosomal abnormalities in renal cell carcinoma variants detected by Urovysion fluorescence in situ hybridization on paraffin-embedded tissue. Ann Diagn Pathol 2011; 15:37-45; PMID:21238914; http://dx.doi.org/10.1016/j.anndiagpath.2010.07.011
- Long XR, He Y, Huang C, Li J. MicroRNA-148a is silenced by hypermethylation and interacts with DNA methyltransferase 1 in hepatocellular carcinogenesis. Int J Oncol 2014; 44:1915-22; PMID:24714841; http://dx.doi.org/10.3892/ijo.2014.2373
- Xu Q, Jiang Y, Yin Y, Li Q, He J, Jing Y, Qi YT, Xu Q, Li W, Lu B et al. A regulatory circuit of miR-148a/152 and DNMT1 in modulating cell transformation and tumor angiogenesis through IGF-IR and IRS1. J Mol Cell Biol 2013; 5:3-13; PMID:22935141; http://dx.doi.org/10.1093/jmcb/mjs049
- Chen C, Ridzon DA, Broomer AJ, Zhou Z, Lee DH, Nguyen JT, Barbisin M, Xu NL, Mahuvakar VR, Andersen MR et al. Real-time quantification of microRNAs by stem-loop RT-PCR. Nucleic Acids Res 2005; 33:e179; PMID:16314309; http://dx.doi.org/10.1093/nar/gni178
- Varkonyi-Gasic E, Wu R, Wood M, Walton EF, Hellens RP. Protocol: a highly sensitive RT-PCR method for detection and quantification of microRNAs. Plant Methods 2007; 3:12; PMID:17931426; http://dx.doi.org/10.1186/1746-4811-3-12
- Kononen J, Bubendorf L, Kallioniemi A, Barlund M, Schraml P, Leighton S, Torhorst J, Mihatsch MJ, Sauter G, Kallioniemi OP. Tissue microarrays for high-throughput molecular profiling of tumor specimens. Nat Med 1998; 4:844-7; PMID:9662379; http://dx.doi.org/10.1038/nm0798-844
- Eble JN, Sauter G, Epstein JI, Sesterhenn IA. Pathology and Genetics of Tumours of the Urinary System and Male Genital Organs. IARC Press 2004
- Bukur J, Herrmann F, Handke D, Recktenwald C, Seliger B. Identification of E2F1 as an important transcription factor for the regulation of tapasin expression. J Biol Chem 2010; 285:30419-26; PMID:20663889; http://dx.doi.org/10.1074/jbc.M109.094284
- Real LM, Cabrera T, Collado A, Jimenez P, Garcia A, Ruiz-Cabello F, Garrido F. Expression of HLA G in human tumors is not a frequent event. Int J Cancer 1999; 81:512-8; PMID:10225437; http://dx.doi.org/10.1002/(SICI)1097-0215(19990517)81:4%3c512::AID-IJC2%3e3.0.CO;2-O
- Hirata H, Matsuyama H, Matsumoto H, Korenaga Y, Ohmi C, Sakano S, Yoshihiro S, Naito K. Deletion mapping of 18q in conventional renal cell carcinoma. Cancer Genet Cytogenet 2005; 163:101-105; PMID:16337851; http://dx.doi.org/10.1016/j.cancergencyto.2005.03.010
- Jasinski-Bergner S, Mandelboim O, Seliger B. The role of microRNAs in the control of innate immune response in cancer. J Natl Cancer Inst 2014; 106(10); PMID:25217579; http://dx.doi.org/10.1093/jnci/dju257
- Jasinski-Bergner S, Stehle F, Gonschorek E, Kalich J, Schulz K, Huettelmaier S, Braun J, Seliger B. Identification of 14-3-3beta Gene as a Novel miR-152 Target Using a Proteome-based Approach. J Biol Chem 2014; 289:31121-35; PMID:25228695; http://dx.doi.org/10.1074/jbc.M114.556290
- Jiang F, Richter J, Schraml P, Bubendorf L, Gasser T, Sauter G, Mihatsch MJ, Moch H. Chromosomal imbalances in papillary renal cell carcinoma: genetic differences between histological subtypes. Am J Pathol 1998; 153:1467-3; PMID:9811338; http://dx.doi.org/10.1016/S0002-9440(10)65734-3
- Nohata N, Hanazawa T, Kikkawa N, Sakurai D, Sasaki K, Chiyomaru T, Kawakami K, Yoshino H, Enokida H, Nakagawa M et al. Identification of novel molecular targets regulated by tumor suppressive miR-1/miR-133a in maxillary sinus squamous cell carcinoma. N Int J Oncol 2011;39:1099-107; PMID:21701775; http://dx.doi.org/10.3892/ijo.2011.1096.
- Uchida Y, Chiyomaru T, Enokida H, Kawakami K, Tatarano S, Kawahara K, Nishiyama K, Seki N, Nakagawa M. MiR-133a induces apoptosis through direct regulation of GSTP1 in bladder cancer cell lines. Urol Oncol 2013; 31:115-23; PMID:21396852; http://dx.doi.org/10.1016/j.urolonc.2010.09.017