ABSTRACT
Tumor-derived microvesicles (TD-MVs) are key mediators which are shed by cancer cells and can sensitize neighboring cells in the tumor microenvironment. TD-MVs are extracellular vesicles composed of exosomes and MVs and promote cancer invasion and metastasis. Intratumoral hypoxia is an integral component of all solid tumors. The relationship between hypoxic tumor-shed MVs and NK-mediated cytotoxicity remains unknown. In this paper, we reported that MVs derived from hypoxic tumor cells qualitatively differ from those derived from normoxic tumor cells. Using multiple tumor models, we showed that hypoxic MVs inhibit more NK cell function as compared to normoxic MVs. Hypoxic TD-MVs package two immunosuppressive factors involved in the impairment of natural killer (NK) cell cytotoxicity against different tumor cells in vitro and in vivo. We showed that following their uptake by NK cells, hypoxic TD-MVs transfer TGF-β1 to NK cells, decreasing the cell surface expression of the activating receptor NKG2D, thereby inhibiting NK cell function. MicroRNA profiling revealed the presence of high levels of miR-210 and miR-23a in hypoxic TD-MVs. We demonstrated that miR-23a in hypoxic TD-MVs operates as an additional immunomosuppressive factor, since it directly targets the expression of CD107a in NK cells. To our knowledge, this is the first study to show that hypoxic tumor cells by secreting MVs can educate NK cells and decrease their antitumor immune response. This study highlights the existence of a novel mechanism of immune suppression mediated by hypoxic TD-MVs and further improves our understanding of the immunosuppressive mechanisms prevailing in the hypoxic tumor microenvironment.
Abbreviations
| (HIF-1α) | = | Hypoxia-inducible factor-1 |
| (miR-23a) | = | microRNA |
| (NK) | = | natural killer |
| (TGF-β) | = | Transforming growth factor |
| (TD-MVs) | = | Tumor derived microvesicles |
Introduction
Intratumoral hypoxia is an integral component of all solid tumors and drives cancer progression. Hypoxia is responsible for the emergence of resistant phenotype to several anticancer therapies.Citation1 The hypoxic tumor microenvironment has recently been shown to play a major role in inducing immunosuppressive conditions impairing both cytotoxic T-lymphocyte (CTL)- and NK cell-mediated tumor cell lysis. We and others have shown that hypoxic tumor cells can escape antitumor cytotoxic effectors by various mechanisms.Citation2,3 Hypoxia renders tumor cells resistant to CTL-mediated killing through the activation of several transcriptional factors such as STAT3, HIF-1, Nanog and through pro-survival processes like autophagy.Citation2-4 Moreover, in the context of NK-mediated antitumor immune response, the activation of autophagy in hypoxic tumor cells selectively degrades Granzyme B, making tumor cells less susceptible to NK-mediated killing.Citation5,6 Very recently, we have demonstrated that hypoxia selectively upregulates PD-L1 on MDSCs via HIF-1 and that under hypoxia stress, blockade of PD-L1 abrogates myeloid-derived suppressor cells function by modulating their cytokine production.Citation7
Several lines of evidence support the notion that tumor cells communicate directly with immune cells in the tumor microenvironmentCitation8 and that this process fosters suppression of immunosurveillance.Citation9 Recently, it has been reported that one of the major modes of communication between cancer and immune cells may involve tumor-derived (TD) microvesicles (MVs), which have been considered as prognostic or predictive biomarkers in several different cancers.Citation8,10
At least two different types of extracellular vesicles have been described, categorized according to their size and the way they are secreted. Exosomes are smaller sized vesicles (50–150 nm) generated within multivesicular bodies that fuse with the cell membrane and thus are released into the extracellular space. MVs are larger vesicles (150–1000 nm) formed through budding and fission of the cell membrane through a mechanism mediated by the actin cytoskeleton.Citation8,11
MVs carry lipids, proteins, mRNAs, and miRNAs,Citation12,13 which can be delivered to target immune cells in order to control tumor-associated immune responses by a mechanism which is not fully understood. Exosomes can act as tumor promoters by educating non-malignant cells to provide a tumor-supporting microenvironment, which helps to circumvent immune detection by the host and promotes metastasis. However, TD exosomes with antitumor and immune-activating properties have also been described, reflecting the complexity and different functions of TD-MVs. Due to their ability to carry tumor antigens toward dendritic cells for CTL priming, TD-MVs have been described as immune stimulators.Citation14,15 Moreover, it has been reported that NK cells had their activating receptors (CD69, NKG2D, and NKp44) upregulated and their inhibitory receptor (CD94) downregulated upon incubation with TD-MVs bearing heat shock protein (Hsp).Citation16 MVs are nevertheless more often associated with immune evasion by tumor cells. In this regard, MICA-containing MVs have been reported to markedly decrease NK cell cytotoxicity by inhibiting NKG2D on NK cells.Citation17 It has also been shown that acute myeloid leukemia patients have large numbers of TGF-β-containing MVs that have been reported to markedly decrease NK cell cytotoxicity by inhibiting NKG2D.Citation18,19
Hypoxia was shown to enhance exosome release by breast cancer cellsCitation20 and to induce increased shedding of pro-angiogenic MVs from glioma cells.Citation21 Recently, hypoxia has been described as a regulator of MV formation in tumor cells, which stimulates breast cancer cell invasion and metastasis. Hypoxic breast cancer cells present increased MVs shedding that was shown to be mediated by HIF-1-dependent expression of RAN22A.Citation22 However, the relationship between MV's shedding from hypoxic tumor cells and CTL- and/or NK-mediated killing has not yet been studied. More specifically, the effect of hypoxic TD-MVs on NK cell function remains unknown. In this study, we have investigated the consequences and mechanisms of action of TD-MVs on NK-mediated killing. Here, we provide evidence that hypoxic, but not normoxic, TD-MVs regulate NK cell function via TGF-β and miR-23a involved in targeting CD107a, and hence impairing their cytotoxicity.
Results
Normoxic and hypoxic tumor cell-derived MVs display similar sizes and both are taken up by NK cells
In order to quantify and qualify the MVs shed from normoxic and hypoxic tumor cells, we used TEM and TRPS analysis. First, TEM performed on MVs derived from IGR-Heu and K562 tumor cells revealed that both cells secrete vesicles displaying characteristic shape of MVs. No significant difference in the shape of normoxic and hypoxic MVs was observed (). In addition, MV size distribution analysis performed using TRPS technology demonstrated that normoxic and hypoxic MVs displayed sizes ranging between 160 and 600 nm (). These results indicate no significant difference in the size of MVs shed from normoxic and hypoxic tumor cells. MVs were further characterized for their surface expression of LAMP-1 and MHC-I, both well-known markers of MVs.Citation24 We did not observe any significant difference in the surface expression of these MV markers between normoxic and hypoxic MVs derived from both IGR-Heu and K562 cells ().
Figure 1. Characterization of normoxic and hypoxic tumor-derived microvesicles (MVs). (A) Transmission electron microscopy analysis of the shape of normoxic and hypoxic MVs derived from IGR-Heu and K562 tumor cells. (B) Analysis of the size range of normoxic and hypoxic MVs derived from IGR-Heu and K562 tumor cells determined by Tunable Resistive Pulse Sensing (TRPS) analysis. Results show the percentage of MVs corresponding to each size range. (C) Surface expression of LAMP-1 and MHC-I on normoxic and hypoxic TD-MVs from IGR-Heu and K562 cells. Data are reported as a percentage of positive cells (upper lines) and mean fluorescence intensity (MFI) (lower lines). (D) Analysis of MV uptake by confocal microscopy. Normoxic and hypoxic MVs derived from IGR-Heu and K562 tumor cells were stained with PKH67 (green) and incubated with PKH26-labeled natural killer (NK)-92 cells. Control condition (Ctrl) corresponds to NK-92 cells incubated without MVs. The upper panels represent phase contrast images, the two middle panels represent PHK26 and PKH67-stained NK cells, and the lower panels represent a merge of upper and middle panels and the uptake of PKH67-TD-MVs. Bar: 10 μm.
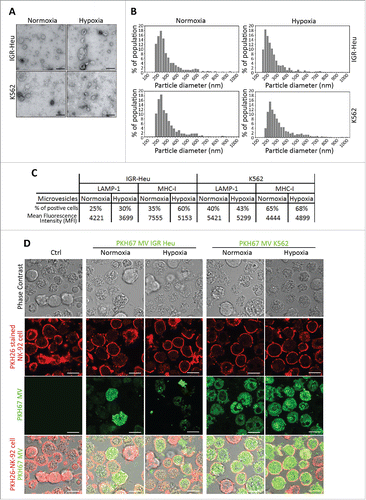
To determine whether TD-MVs are taken-up by NK cells, NK92 cells were stained with PKH26 (red) and incubated with PKH67-stained TD-MVs (green) isolated from normoxic and hypoxic IGR-Heu and K562 tumor cells. shows that although K562-derived MVs penetrate NK-92 cells more efficiently than IGR-Heu-derived MVs, there was no significant difference in the uptake of normoxic and hypoxic MVs derived from the same tumor cell line (both IGR-Heu and K562).
Hypoxic TD-MVs impair NK-mediated cytotoxicity and NK cell function
As no difference in the uptake of normoxic and hypoxic TD-MVs was observed, we next investigated whether NK cells co-cultured with normoxic or hypoxic MVs displayed different levels of cytotoxicity. To address this issue, IGR-Heu and K562 tumor cells were co-cultured with NK-92 or NKD cells, pre-treated with either normoxic or hypoxic TD-MVs, at different effector: target ratios. shows that treatment of NK-92 or NKD cells by either normoxic or hypoxic TD-MVs decreased their cytotoxicity toward IGR-Heu or K562 tumor cells. Interestingly, the decrease in the cytotoxicity of NK cells was significantly higher when NK cells were stimulated with hypoxic as compared to normoxic TD-MVs.
Figure 2. The effect of normoxic and hypoxic tumor-derived microvesicles (MVs) on the activity of natural killer (NK) cells. (A) Cytotoxicity of NK cells against tumor cells. NK-92 (upper panels) or NKD (lower panels) cells, untreated (Ctrl) or treated with normoxic (Normoxic MVs) or hypoxic (Hypoxic MVs) MVs derived from IGR-Heu(left panels) or K562 (right panels) cells. Untreated or MV-treated NK cells were co-cultured with IGR-Heu or K562 tumor cells and the percentage of tumor cells lysed was assessed by conventional 4-h 51Cr release assays at different effector: target ratios (30:1, 10:1, or 3:1). Data represent three independent experiments with standard deviation (SD). Statistically significant difference (indicated by asterisks) in NK-mediated lysis between tumor cells incubated with normoxic and hypoxic MVs are shown (*, p < 0.05; **, p < 0.005). (B) The expression of CD107a and IFNγ in NK-92 (left panels) or NKD (right panels) cells, untreated (Ctrl) or treated with MVs as described in A. Data are reported as a percentage of positive cells from three independent experiments with SD. Statistically significant differences (indicated by asterisks) in the expression of CD107a and IFNγ between tumor cells incubated with normoxic and hypoxic MVs are shown (*, p < 0.05; **, p < 0.005; *** p < 0.0005).
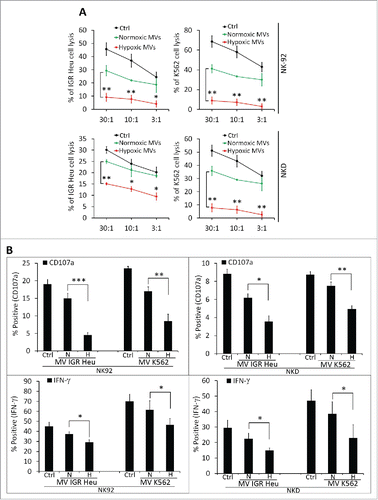
As CD107a and IFNγ expression are established markers of NK cell functional activity,Citation25 we therefore assessed the expression of these markers in NK cells pre-treated with normoxic or hypoxic TD-MVs. shows that hypoxic TD-MVs pretreated NK cells have significantly decreased IFNγ and CD107a as compared to normoxic TD-MVs treated NK cells. A direct correlation between the decrease in the cytotoxicity and the expression of CD107a and IFNγ by NK-92 and NKD cells.
The impairment of NK-mediated cytotoxicity by hypoxic tumor-derived MVs involves a decrease in NKG2D induced by tumor growth factor-β (TGF-β)
The function of NK cells is finely tuned by a balance between signals delivered by activating and inhibitory receptors following their respective interaction with activating and inhibitory ligands.Citation26 We investigated whether hypoxia can modulate NK ligand expression on both tumor cells and TD-MVs. As shown in , we did not observe any significant effect of hypoxia on the expression of major NK ligands on IGR-Heu and K562 tumor cells and their derived MVs as compared to normoxia. This result indicates that the decreased NK cell function after MVs treatment that we observed is not due to altered expression of NK ligands on hypoxic TD-MVs.
Figure 3. Expression of different natural killer (NK) cell ligands on the surface of tumor cells and their derived microvesicles (MVs). (A) Surface expression of NK ligands at the surface of normoxic or hypoxic IGR-Heu and K562 tumor cells (left) and their derived MVs (right). Data are reported as a percentage of positive cells (upper lines) and mean fluorescence intensity (MFI) (lower lines). (B) Quantification of TGF-β1 in normoxic and hypoxic cells and their derived MVs. IGR-Heu or K562 cells were cultured under normoxia (N) or hypoxia for 24, 48, or 72h. TD-MVs from normoxic (N) or 24h hypoxic (H) tumor cells were isolated as described in the Materials and Methods section. The quantification of TGF-β1 in cells and MVs was performed by ELISA and data were reported as pg of TGF-β1 per mg of cell lysate or MVs. Statistically significant differences (indicated by asterisks) in the level of TGF-β1 between normoxic and hypoxic cells and in their derived MVs are shown (*, p < 0.05; **, p < 0.005; *** p < 0.0005). (C) The expression of NKG2D at the surface of NK cells. NK-92 (upper) or NKD (lower) cells cultured in the absence (Ctrl) or presence of normoxic (N MVs) or hypoxic (H MVs), untreated (−) or pre-treated (+) with anti-TGF-β blocking antibody or with its corresponding isotype. The expression of NKG2D at the surface of NK cells was reported as a percentage of positive cells of three independent experiments with standard deviation. Statistically significant differences (indicated by asterisks) in the expression of NKG2D are shown (*,p < 0.05; **, p < 0.005; *** p < 0.0005).
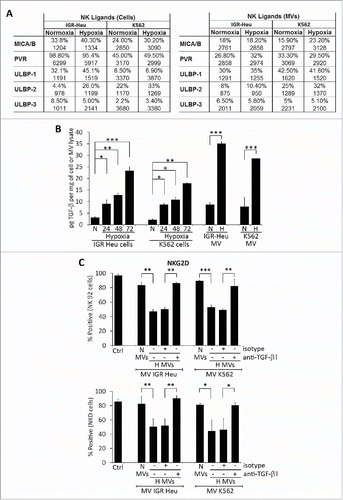
It has recently been reported that TD TGF-β1 downregulates the activating receptor NKG2D and thereby impairs the cytotoxicity of NK cells.Citation27 To investigate whether hypoxic TD-MVs affect the cytotoxicity of NK cells by a mechanism involving TGF-β1-dependent downregulation of NKG2D expression, we first analyzed whether hypoxic stress induces the expression of TGF-β1 in tumor cells. Our results (Fig. S1) showed a time-dependent increase in the expression of TGF-β1 at both mRNA and protein level in hypoxic IGR-Heu and K562 tumor cells. Accordingly, the level of TGF-β1 detected in the MVs of hypoxic cells was significantly higher than in normoxic cells (). We therefore evaluated the effect of this increase in TGF-β1 on the expression of NKG2D at the surface of NK cells. shows that treatment of NK-92 and NKD cells with MVs derived from hypoxic, but not normoxic, IGR-Heu, and K526 tumor cells significantly decreases the expression of NKG2D on the surface of NK cells. Interestingly, the decrease in NKG2D was no longer observed when hypoxic TD-MVs were pre-treated with anti-TGF-β1 blocking antibody. Overall, our data indicate that hypoxic TD-MVs impair the cytotoxicity of NK cells by decreasing the expression of NKG2D in a TGF-β1-dependent manner.
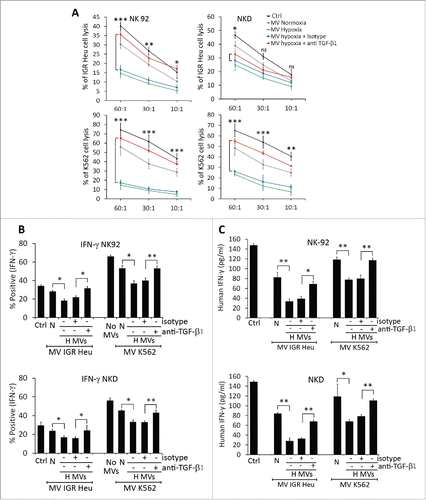
This data is further supported by our results showing that the decrease in the cytotoxicity of NK-92 and NKD cells observed following treatment with hypoxic TD-MVs was restored by anti-TGF-β1 blocking antibody (). The restoration of NK cell cytotoxicity also resulted in restoration of IFNγ production by NK-92 and NKD cells ().
Figure 4. TGF-β1 blockade in hypoxic tumor-derived microvesicles (MVs) restores NK cell function. (A) Cytotoxicity of NK-92 (left panels) or NKD (right panels) cells against IGR-Heu (upper panels) or K562 (lower panels) tumor cells. NK cells cultured in the absence (Ctrl) or presence of normoxic (MV normoxia) or hypoxic (MV hypoxic) microvesicles (MVs), untreated or pre-incubated with anti-TGF-β1 blocking antibody (+TGF-β1) or its corresponding isotype (+Isotype). Untreated or MV-treated NK cells were co-cultured with IGR-Heu or K562 tumor cells and the percentage of tumor cell lysis was assessed as described in . A statistically significant differences (indicated by asterisks) in NK-mediated lysis between hypoxic tumor cells treated with isotype or TGF-β1 blocking antibody are shown (*, p < 0.05; **, p < 0.005; ***, p < 0.0005; ns, not significant). (B) Effect of blocking TGF-β on the expression of IFNγ by NK cells. The expression of intracytoplasmic IFNγ in NK-92 (upper panel) or NKD (lower panel) cells, cultured in the absence (Ctrl) or presence of normoxic (N) or hypoxic (H) MVs, untreated (−) or pre-treated (+) with anti-TGF-β1 blocking antibody or its corresponding isotype. Data are reported as a percentage of positive cells of three independent experiments with standard deviation. Statistically significant differences (indicated by asterisks) in the percentage of IFNγ positive cells are shown (*, p < 0.05; **, p < 0.005). (C) Effect of blocking TGF-β1 on the secretion of IFNγ by NK cells. The quantification of IFNγ was performed by ELISA on NK-92 (upper panel) or NKD (lower panel) cells described in B. Data are reported as pg IFNγ/mL. Statistically significant differences (indicated by asterisks) in the amount of IFNγ are shown (*,p < 0.05; **, p < 0.005).
Hypoxic TD-MVs differentially express several miRNA as compared to normoxic TD-MVs
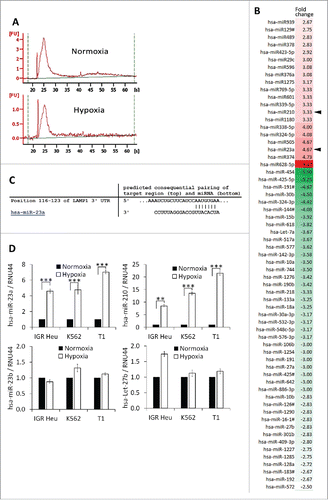
In addition to proteins, TD-MVs and exosomes contain mRNAs and microRNAs that can be taken-up by other cells, including NK cells.Citation17 To determine whether the impairment of NK cell cytotoxicity by hypoxic TD-MVs potentially involves miRNA-mediated mechanisms, we analyzed the miRNA profile of normoxic and hypoxic TD-MVs isolated from IGR-Heu cells. Results of point to the presence of small RNAs, most likely corresponding to miRNAs, in both normoxic and hypoxic MVs. shows that, compared to normoxic MVs, hypoxic MVs displayed 20 upregulated and 44 downregulated miRNAs with a change greater than 2-fold. As expected, we found that hypoxia-induced miR-210Citation28 was increased by 3.33-fold in hypoxic MVs. More interestingly, we showed that miR-23a was increased by 4.67-fold in hypoxic compared to normoxic TD-MVs. In silico prediction of putative miR-23a target genes using the TargetScan database (http://www.targetscan.org) revealed the presence of an miR-23a binding site at position 116–123 in the 3′-UTR of the CD107a gene (). This result suggests that miR-23a in hypoxic MVs could inhibit NK cell function by targeting CD107a. The overexpression of miR-210 and -23a, but not -23b and -27b, in hypoxic MVs isolated from IGR-Heu, K562, and T1 tumor cells as compared to normoxic TD-Mvs, was further validated by real time PCR().
Figure 5. Profiling of microRNA in microvesicles (MVs) derived from hypoxic and normoxic IGR-Heu cells. (A) Bio-analyzer of small nucleic acid content of normoxic (upper) or hypoxic (lower) MVs containing exosomes. (B) miRNA profiling of MVs containing exosomes derived from normoxic or hypoxic tumor cells using Taqman miRNA arrays. Data analysis revealed the presence of 20 upregulated and 44 downregulated miRNAs in hypoxic compared to normoxic MVs with a change greater than 2-fold. (C) Mapping of has-miR-23a on the mRNA 3′-UTR of LAMP1 (source TargetScan: http://www.targetscan.org). (D) Validation of the expression of miRNAs identified by Taqman miRNA array. Real time PCR analysis of miR-23a, miR-210, miR-23b, and let-27b expression in normoxic and hypoxic MVs derived from IGR-Heu, K562, and T1 tumor cells. Statistically significant differences (indicated by asterisks) in the expression of miR-23a and -210 are shown (*, p < 0.05; **, p < 0.005; *** p < 0.0005).
miR-23a-containing hypoxic TD-MVs impair NK cell cytotoxicity and NK cell function by targeting CD107a
To address the relative contribution of miR-210 or miR-23a to the impairment of NK cell cytotoxicity, we transfected NK cells with pre-miR-210 and -23a and assessed there in vitro cytotoxic function and the expression of CD107a, IFNγ, and granzyme B (GzmB).While pre-miR-210 did not affect the cytotoxicity of NK cells (Fig. S2), the transfection of pre-miR-23 () significantly decreased the cytotoxicity of NK cells toward IGR-Heu, K562, and T1 tumor cells at different effector: target ratios (). The decrease in NK cell cytotoxicity was not related to the regulation of NK cell activating receptors (Fig. S3), but most likely related to the ability of miR-23a to target the mRNA expression of CD107a (). This result was further supported by our data showing that the transfection of miR-23a in NK cells significantly decreased the expression of CD107a at their surface when co-cultured with K562 target cells ().
Figure 6. Effect of miR-23a on the cytotoxicity of natural killer (NK) cells. (A) Effect of pre-miR-23a transfection on the expression of miR-210 in NK cells. NK-92 cells were untransfected (UT) or transfected with pre-miR control (pre-miR-Ctrl) or different concentrations of pre-miR-23a. Cells were subjected to real time PCR analysis for the expression of miR-23a (upper panel); miR-210 (middle panel) and miR-27a (lower panel) used as control. (B) Cytotoxicity of NK-92 cells expressing pre-miR-23a. NK-92 cells, transfected as described in A, were co-cultured with IGR-Heu (upper panel); K562 (middle panel), or T1 (lower panel) cells and the percentage of tumor cell lysis was assessed at different effector: target ratios (30:1, 10:1 or 3:1) as described in . Statistically significant differences (indicated by asterisks) in the cytotoxicity of NK cells expressing pre-miR-Ctrl and pre-miR-23a are shown (*, p < 0.05; **, p < 0.005). (C) Real time PCR analysis of LAMP1, IFNγ, GzmB, and PFN mRNA expression in NK-92 cells untransfected (UT) or transfected with either pre-miR control (Ctrl) or pre-miR-23a.Statistically significant differences (indicated by asterisks) in the expression of LAMP1, IFNγ, GzmB, and PFN in NK cells expressing pre-miR-Ctrl and pre-miR-23a are shown (*, p < 0.05; **, p < 0.005; ***, p < 0.0005; ns, not significant). (D) The expression of CD107a, IFNγ, and GzmB in NK-92 cells transfected pre-miR-Ctrl or pre-miR-23a and cultured alone or in the presence of K562 target cells. Statistically significant differences (indicated by asterisks) are shown (**, p < 0.005; ns, not significant). (E) Luciferase reporter gene assay performed using NK-92 cells co-transfected with either pre-miR control (Ctrl) and control vector or pre-miR-23a and vector encoding3′-UTR of LAMP1. After48 h, firefly and renilla luciferase activities were measured using the Dual-Luciferase Reporter assay and the ratio of firefly/renilla luciferase was determined. Statistically significant differences (indicated by asterisks) are shown. The experiment was performed in triplicate and repeated two times with the same results. Error bars indicate standard deviation. Statistically significant differences (indicated by asterisks) are shown (**, p < 0.005).
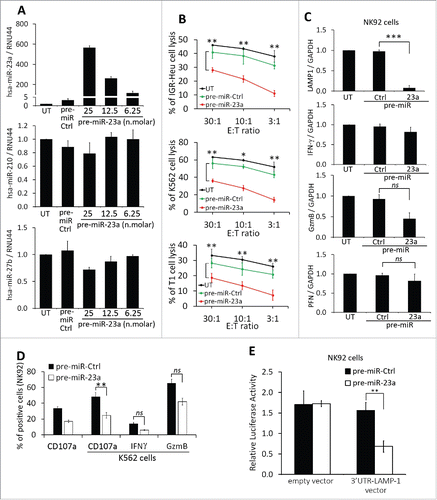
To validate that miR-23a targets CD107a, we conducted a luciferase reporter assay using a vector containing LAMP-1 (CD107a) 3′-UTR. Transfection of pre-miR-23a in cells expressing 3′-UTR LAMP-1 vector significantly reduced luciferase activity by more than 60% compared to control empty vector (), suggesting that miR-23a directly binds to the 3′-UTR of LAMP-1 and targets CD107a expression in NK92 cells.
We next assessed whether hypoxic TD-MVs reduce the cytotoxicity of NK cells by decreasing the expression of CD107a following miR-23a transfer. To address this issue, hypoxic TD-MVs isolated from IGR-Heu, K562, and T1 cells were transfected with either anti-miR-control or anti-miR-23a as previously described.Citation24 Real time PCR demonstrated a decrease in miR-23a expression in hypoxic MVs transfected with anti-miR-23a, but not with anti-miR-control (). The effect of transfected MVs on the activity of NK cells was further investigated according to the experimental design described in . Briefly, normoxic and hypoxic MVs were isolated from IGR-Heu, K562, and T1 tumor cells. NK-92 cells were treated with either normoxic or hypoxic MVs, untransfected or transfected with anti-miR-23a. NK cells treated with different MVs were next co-cultured with target tumor cells and their cytotoxicity was evaluated in terms of expression of CD107a, IFNγ, GzmB, and perforin at the mRNA and protein level. shows that the decrease in CD107a mRNA expression in NK cells treated with hypoxic MVs was no longer observed when NK cells were treated with hypoxic MVs transfected with anti-miR-23a. This effect is specific to CD107a, as the expression of IFNγ, GzmB, or perforin was not affected by anti-miR-23a, even though hypoxic MVs decreased the expression of GzmB in NK cells. The results depicted in confirms that the decrease in the percentage of CD107a and IFNγ-positive NK cells by hypoxic MVs was restored when MVs were transfected with pre-miR-23a.
Figure 7. Targeting miR-23a in hypoxic TD-MVs restores the cytotoxicity of natural killer (NK) cells co-cultured with hypoxic TD-MVs. Real time PCR analysis of the expression of miR-23a. Normoxic (N) or hypoxic MVs derived from IGR-Heu, K562, and T1 tumor cells were untransfected (−) or transfected (+) with anti-miR control (anti-miR-Ctrl) or anti-miR-23a. Results are reported as a ratio between miR-23a and RNU44 (used as housekeeping gene). Statistically significant differences (indicated by asterisks) in the expression of miR-23a are shown (**, p < 0.005; ***, p < 0.0005). (B) Schematic representation of the experimental design used to analyze the effect of targeting miR-23a expression in hypoxic MVs on the cytotoxicity of NK cells. Normoxic and hypoxic MVs were isolated from indicated the tumor cells cultured under normoxic or hypoxic conditions. Untransfected normoxic MVs and hypoxic MVs transfected with anti-miR-23a were incubated with NK-92 cells. Following co-culture with tumor cells, NK cells were sorted and their function evaluated in term of cytotoxicity and the expression of CD107a, IFN-g, GzmB, and perforin. (C) Real time PCR analysis of the mRNA expression of CD107a(LAMP1), IFNγ, Granzyme B (GzmB), and perforin (PFN)in NK-92 cells treated with normoxic or hypoxic MVs, untransfected or transfected with either anti-miR control (+anti-miR-Ctrl) or anti-miR-23a (+anti-miR-23a) derived from IGR-Heu (upper), K562 (middle) or T1 (lower) tumor cells as described in B. Statistically significant differences (indicated by asterisks) in the expression of LAMP1, IFNγ, GzmB, and PFN are shown (*, p < 0.05; **, p < 0.005; ***, p < 0.0005; ns, not significant). (D) Intra-cytoplasmic staining of CD107a (upper) and IFN-g (lower) in control (Ctrl)NK-92cells or in cells untreated (−) or treated (+) with normoxic (N) or hypoxic (H) MV derived from indicated tumor cell lines as described in B. Statistically significant differences (indicated by asterisks) in the percentage of CD107a and IFNγ positive cells are shown (*, p < 0.05; **, p < 0.005; ns, not significant).
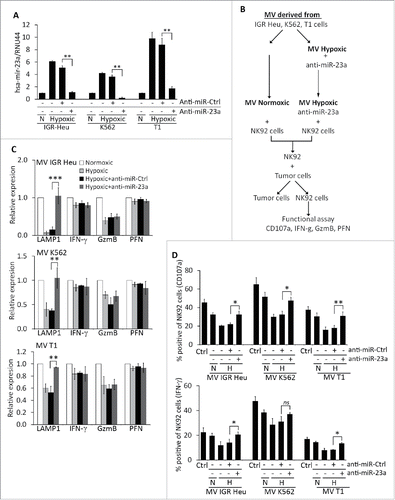
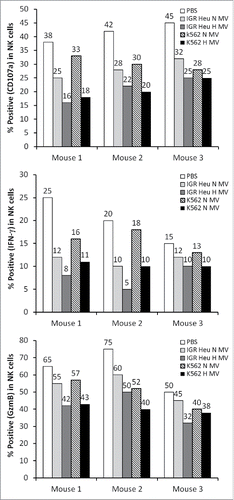
Figure 8. The effect of tumor derived microvesicles (MVs) on the function of natural killer (NK) cells in vivo. Mice were injected intradermally every day for 7 d with phosphate buffered saline (PBS) or with 50 μg of normoxic (N) or hypoxic (H) MVs in PBS derived from IGR Heu or K562 tumor cells. NK cells were sorted from draining lymph nodes by cd49b antibody coated beads and co-cultured with Renca cells. After separation from their target, the expression of CD107a (upper), IFNγ (Middle), and GzmB (lower) was assessed by FACS analysis.
Discussion
The hypoxic tumor microenvironment has previously been described to be associated with drug resistance, invasion, and metastasis.Citation1 Here, we show that hypoxic, but not normoxic, TD-MVs impair the NK cell-mediated antitumor immune response. This finding is consistent with several previous reports describing the exchange of MVs between tumors and the immune system,Citation29,30which ultimately leads to the establishment of an immunotolerant microenvironment. An important issue that arises from these results is whether the effect of hypoxic MVs is due to a difference in their ability to enter NK cells compared to normoxic MVs, or whether it is due to a difference in their contents. Electron microscopy combined with TRPS analysis revealed that the shape and the size of normoxic and hypoxic TD-MVs are roughly similar. In addition, no difference in the uptake of normoxic and hypoxic MVs by NK cells was observed. Based on these data, it is tempting to speculate that the effect of hypoxic MVs on NK cell function could be related to the content of the MVs, and thus to their ability to transfer suppressive factors to NK cells. Further, the content of MVs may reflect the hypoxic status of tumor cells. This could partly explain why some highly aggressive tumor types, such as lung,Citation31 melanomaCitation32,33 and breastCitation34,35 evade the host immune system. Indeed, Hodge et al recently hypothesized that soluble factors such as PGE-2/COX could be responsible for the decreased expression of GzmB, perforin, and IFNγ in T-cells, NKT-like and NK cells, thereby inducing lung cancer immune evasion.Citation31 In keeping with this, we strongly believe that TD-MVs could play a role as a carrier for these soluble factors involved in the regulation of the cytotoxicity of NK cells. In this regard, CD107a and IFNγ have been described as markers of NK cell degranulation and activity, respectively.Citation36 In accordance with this, we provide evidence that the decrease in the cytotoxicity of NK cells correlates with a significant decrease in the expression of CD107a and IFNγ. It is worth noting that NK cell cytotoxicity was also slightly impaired by normoxic TD-MVs and that this impairment was correlated with a modest decrease in CD107a and IFNγ. While further investigations are needed to determine the mechanism underlying this slight decrease by normoxic MVs, it is unlikely that this is related to a difference in the uptake of normoxic and hypoxic MVs by NK cells, as both normoxic and hypoxic MVs are taken-up by NK cells with the same efficiency. We further hypothesize that the differential effect of normoxic and hypoxic TD-MVs could be related to the concentration of inhibitory factors contained in MVs.
TGF-β is a potent immunosuppressive factor involved in immune escape.Citation37 Immune inhibitory effects of TGF-β include induction of regulatory T cells, impairment of antigen presentation, downregulation of immunostimulatory cytokines such as IFNγ, and inhibition of T-cell activation, proliferation, and degranulation. Furthermore, it has been reported that TGF-β inhibits the production of perforin, GzmA GzmB, Fas ligand, and IFNγ in CD8+ T cells at a transcriptional level.Citation38 At the post-transcriptional level, TGF-β has been described to induce a decrease in IFNγ by reducing its mRNA stability in a murine NK cell line.Citation39 More recently, TGF-β has been described as a potent downregulator of NKG2D activating receptors at the surface of NK cells.Citation27 In line with these studies, our results showed that hypoxic, but not normoxic, MVs dramatically decrease NKG2D at the surface of NK cells. Consistent with these results, it is tempting to speculate that hypoxic TD-MVs are able to impair NK cell cytotoxicity via the delivery of TGF-β to NK cells. Several of the results reported here support such a mechanism: (i) the level of TGF-β in hypoxic cells and in their derivative MVs is significantly higher compared to normoxic cells; (ii) treatment of NK cells with hypoxic MVs containing high concentrations of TGF-β induces significant decreases in NKG2D, CD107a, and IFNγ and results in a dramatic decrease in their cytotoxicity; and (iii) the decrease in cytotoxicity, and in the levels of NKG2D, CD107a, and IFNγ, was no longer observed when TGF-β was inhibited by anti-TGF-β blocking antibody.
Although our data establish a link between an increase of TGF-β and a decrease in NK cell cytotoxicity, an important question that remains is whether TGF-β is the only factor involved in the down regulation of CD107a, IFNγ, and NKG2D in NK cells. Indeed, a recent study highlights that TGF-β promotes the expression of the miR-23a cluster in human CD8+ T cells, which subsequently and specifically targets the 3′-UTR of CD107a/LAMP1 mRNA. Importantly, this study also revealed that the miR23a cluster is not only induced by TGF-β, but also exerts a suppressive effect on CD8+ T-cell effector function, even in the absence of TGF-β signaling.Citation40 In accordance with this study, we revealed that miR-23a was significantly upregulated in hypoxic TD-MVs containing high levels of TGF-β. Our data emphasize that hypoxic TD-MVs impair NK cell cytotoxicity by at least two mechanisms that are not-mutually exclusive: (i) by a mechanism involving a decrease in NKG2D expression by TGF-β as previously describedCitation27; and (ii) by decreasing CD107a expression following miR23a transfer. Therefore, it cannot be ruled out that the increased expression of miR-23a observed in hypoxic MVs could be associated with an increased level of TGF-β in hypoxic tumor cells, as previously described in CD8+ T cells.Citation40
It has recently been reported that in breast cancer cells, hypoxia induces an increase in MV release, and hypoxic MVs promote invasion and metastasis.Citation22 However, whether there are qualitative differences regarding the specific cargo carried by MVs generated from hypoxic compared to non-hypoxic cells remains to be established. Our study provides clear evidence that TD-MVs can reflect the hypoxic status of tumor cells by carrying immunosuppressive molecules involved in the impairment of NK cell function not only in vitro but also in vivo. Very interestingly, we showed that NK cells isolated from draining lymph nodes of mice treated with hypoxic TD-MVs display a decreased level of CD107a, IFN-γ, and GzmB as compared to normoxic TD-MVs treated NK cells ().
Overall, our data provide a new mechanism by which hypoxic stress impairs the antitumor immune response by the transfer of suppressive signals to immune cells via MVs. This study further strengthen the notion that hypoxia targeting (HIFs inhibitors) should be supplemented to the current therapies including immunotherapies to further improve their clinical outcome.
Materials and methods
Cell culture and antibodies
The IGR-Heu lung carcinoma cell line was derived and maintained in culture as previously described.Citation23 K562, NK92, and NKD cell lines were purchased from the American Type Culture Collection and cultured in their respective media. Hypoxic stress conditions were generated in a hypoxia workstation (Invivo2 400, Ruskinn), as previously described.Citation23 All antibodies used in this study were obtained from eBioscience.
Preparation of normoxic and hypoxic MVs and transmission electron microscopy (TEM)
All cells were grown at 37°C and 5% CO2 in adequate medium with 10% exosomes depleted FBS. Exosome-free FBS was prepared by ultracentrifugation overnight at 100,000 × g and 4°C. After 48 h, medium was collected and centrifuged at 400 ×g for 5min, 2,500 × g for 20min, 4,500 × g for 20min, and 10,000 × g for 1h at 4°C to pellet MVs. The pellet was washed and suspended in PBS. For hypoxic MVs, cells were grown for 24h at 37°C and 5% CO2 under normoxia and their medium was changed before incubation for 48h at 37°C under hypoxic conditions (pO2= 0.1%).
MV were analyzed by TEM using negative staining method. Five microliters of MVs suspended in PBS was adsorbed onto a 300 mesh copper grid coated with a collodion film covered by a thin carbon film, activated by glow-discharge. After 1 min, grids were washed with aqueous 2% (w/vol) uranyl acetate (Merck) and then dried with ashless filter paper (VWR). TEM observations were carried out on a Zeiss 912AB transmission electron microscope in filtered low loss mode. Electron micrographs were obtained using a ProScan 1024 HSC digital camera and Soft Imaging Software system.
Determination of MV size by Tunable Resistive Pulse Sensing (TRPS) analysis
TRPS analysis was used to measure the size of MVs after isolation from culture supernatants. A NP400 nanopore was fitted onto the qNano (Izon Science) and measures were performed using standard electrolyte buffer (SEB, Izon Science) as an electrolyte. Beads of 350 nm (Izon Science) served for calibration. All measures were performed with similar stretch and voltage and analyzed using Izon Control Suite.
Flow cytometry analysis
Flow cytometry was performed using a LSR-II flow cytometer (BD Biosciences) and indicated antibodies.Citation7 Data were further analyzed by FACS DIVA 7.0 or Flow Jo 7.6.5 software.
MV uptake experiments
TD-MVs were purified as described above from normoxic and hypoxic cells, stained with PKH67, and added to PKH-26-stained recipient cells. After 16 h, recipient cells were analyzed by confocal microscopy.
ELISA for human TGF-β1
Human TGF-β1 was measured in normoxic and hypoxic cells or MVs using the TGF-β1 ELISA kit (eBioscience).
51Cr cytotoxicity assay
The cytotoxic activity of NK cells was measured by a conventional 4-h 51Cr release assay as previously described.Citation23
RNA isolation and SYBR-GREEN qRT-PCR
Total RNA was extracted from cells and MVs with TRIzol solution (Invitrogen). DNase I-treated total RNA (1μg) was converted into cDNA using TaqMan Reverse Transcription Reagent (Applied Biosystems) and mRNA levels were quantified by the SYBR-GREEN qPCR method (Applied Biosystems). Relative expression was calculated by using the comparative Ct method 2^(-DCt). Primer sequences are available upon request.
MicroRNA analysis
The Agilent 2100 Bioanalyzer (Agilent) for small RNA (small RNA chips) was used to assess small RNA profiles in cells and MVs. MicroRNA profiling of normoxic and hypoxic MVs was performed using the TaqMan® Array Human MicroRNA A+B Cards Set v3.0 (Life Technologies).
miR-23a blockade and overexpression
Transfections were conducted with anti-miR-23a (miR inhibitor, Ambion) and pre-miR-23a (miR precursor, Ambion). siPORTNeoFx Transfection Agent (NeoFx; Ambion) was used for transfection according to manufacturer's instructions. AntimiR-CT (miR negative control, Ambion) and pre-miR-CT (miR positive control, Ambion) were used as controls.
Luciferase reporter assay for miR-23a target gene
Vector containing 3′-UTR of LAMP-1 was obtained from GeneCopoeia. NK-92 cells expressing empty vector or vector encoding 3′-UTR were co-transfected with either pre-miR-control or pre-miR-23a using Lipofectamine2000 (Invitrogen) in OPTIMEM (Invitrogen) medium. After 48 h, firefly and Renilla luciferase activities were measured using the LucPair™ Duo-Luciferase Assay Kit (GeneCopoeia).
Statistics
Data were analyzed with GraphPad Prism. Student's t-test was used for single comparisons. Data were considered statistically significant when p was less than 0.05.
Disclosure of potential conflicts of interest
No potential conflicts of interest were disclosed.
Funding
This work was supported by the ARTuR (Association pour la Recherche sur les Tumeurs du Rein), ARC (Association pour la Recherche sur le Cancer) 2012-2013: N° SFI20121205624, and grants from Luxembourg Institute of Health (LHCE-2013 11 05) and FNR Luxembourg (C12/BM/3962058).
References
- Semenza GL. Hypoxia-inducible factors: mediators of cancer progression and targets for cancer therapy. Trends Pharmacol Sci 2012; 33:207-14; PMID:22398146; http://dx.doi.org/10.1016/j.tips.2012.01.005
- Noman MZ, Messai Y, Carre T, Akalay I, Meron M, Janji B, Hasmim M, Chouaib S. Microenvironmental hypoxia orchestrating the cell stroma cross talk, tumor progression and antitumor response. Crit Rev Immunol 2011; 31:357-77; PMID:22142164; http://dx.doi.org/10.1615/CritRevImmunol.v31.i5.10
- Chouaib S, Messai Y, Couve S, Escudier B, Hasmim M, Noman MZ. Hypoxia promotes tumor growth in linking angiogenesis to immune escape. Front Immunol 2012; 3:21; PMID:22566905; http://dx.doi.org/10.3389/fimmu.2012.00021
- Messai Y, Noman MZ, Hasmim M, Janji B, Tittarelli A, Boutet M, Baud V, Viry E, Billot K, Nanbakhsh A et al. ITPR1 protects renal cancer cells against natural killer cells by inducing autophagy. Cancer Res 2014; 74:6820-32; PMID:25297632; http://dx.doi.org/10.1158/0008-5472.CAN-14-0303
- Baginska J, Viry E, Berchem G, Poli A, Noman MZ, van Moer K, Medves S, Zimmer J, Oudin A, Niclou SP et al. Granzyme B degradation by autophagy decreases tumor cell susceptibility to natural killer-mediated lysis under hypoxia. Proc Natl Acad Sci USA 2013; 110:17450-5; PMID:24101526; http://dx.doi.org/10.1073/pnas.1304790110
- Viry E, Baginska J, Berchem G, Noman MZ, Medves S, Chouaib S, Janji B. Autophagic degradation of GZMB/granzyme B: a new mechanism of hypoxic tumor cell escape from natural killer cell-mediated lysis. Autophagy 2014; 10:173-5; PMID:24248158; http://dx.doi.org/10.4161/auto.26924
- Noman MZ, Desantis G, Janji B, Hasmim M, Karray S, Dessen P, Bronte V, Chouaib S. PD-L1 is a novel direct target of HIF-1alpha, and its blockade under hypoxia enhanced MDSC-mediated T cell activation. J Exp Med 2014; 211:781-90; PMID:24778419; http://dx.doi.org/10.1084/jem.20131916
- Muralidharan-Chari V, Clancy JW, Sedgwick A, D'Souza-Schorey C. Microvesicles: mediators of extracellular communication during cancer progression. J Cell Sci 2010; 123:1603-11; PMID:20445011; http://dx.doi.org/10.1242/jcs.064386
- Gajewski TF, Schreiber H, Fu YX. Innate and adaptive immune cells in the tumor microenvironment. Nat Immunol 2013; 14:1014-22; PMID:24048123; http://dx.doi.org/10.1038/ni.2703
- Antonyak MA, Cerione RA. Microvesicles as mediators of intercellular communication in cancer. Methods Mol Biol 2014; 1165:147-73; PMID:24839024
- D'Souza-Schorey C, Clancy JW. Tumor-derived microvesicles: shedding light on novel microenvironment modulators and prospective cancer biomarkers. Gen Dev 2012; 26:1287-99; PMID:22713869; http://dx.doi.org/10.1101/gad.192351.112
- Martins VR, Dias MS, Hainaut P. Tumor-cell-derived microvesicles as carriers of molecular information in cancer. Curr Opin Oncol 2013; 25:66-75; PMID:23165142; http://dx.doi.org/10.1097/CCO.0b013e32835b7c81
- Schifferli JA. Microvesicles are messengers. Semin Immunopathol 2011; 33:393-4; PMID:21590325; http://dx.doi.org/10.1007/s00281-011-0276-6
- Andre F, Schartz NE, Movassagh M, Flament C, Pautier P, Morice P, Pomel C, Lhomme C, Escudier B, Le Chevalier T et al. Malignant effusions and immunogenic tumour-derived exosomes. Lancet 2002; 360:295-305; PMID:12147373; http://dx.doi.org/10.1016/S0140-6736(02)09552-1
- Wolfers J, Lozier A, Raposo G, Regnault A, Thery C, Masurier C, Flament C, Pouzieux S, Faure F, Tursz T et al. Tumor-derived exosomes are a source of shared tumor rejection antigens for CTL cross-priming. Nat Med 2001; 7:297-303; PMID:11231627; http://dx.doi.org/10.1038/85438
- Lv LH, Wan YL, Lin Y, Zhang W, Yang M, Li GL, Lin HM, Shang CZ, Chen YJ, Min J. Anticancer drugs cause release of exosomes with heat shock proteins from human hepatocellular carcinoma cells that elicit effective natural killer cell antitumor responses in vitro. J Biol Chem 2012; 287:15874-85; PMID:22396543; http://dx.doi.org/10.1074/jbc.M112.340588
- Clayton A, Tabi Z. Exosomes and the MICA-NKG2D system in cancer. Blood Cells Mol Dis 2005; 34:206-13; PMID:15885603; http://dx.doi.org/10.1016/j.bcmd.2005.03.003
- Szczepanski MJ, Szajnik M, Welsh A, Whiteside TL, Boyiadzis M. Blast-derived microvesicles in sera from patients with acute myeloid leukemia suppress natural killer cell function via membrane-associated transforming growth factor-beta1. Haematologica 2011; 96:1302-9; PMID:21606166; http://dx.doi.org/10.3324/haematol.2010.039743
- Whiteside TL. Immune modulation of T-cell and NK (natural killer) cell activities by TEXs (tumour-derived exosomes). Biochem Soc Trans 2013; 41:245-51; PMID:23356291; http://dx.doi.org/10.1042/BST20120265
- King HW, Michael MZ, Gleadle JM. Hypoxic enhancement of exosome release by breast cancer cells. BMC cancer 2012; 12:421; PMID:22998595; http://dx.doi.org/10.1186/1471-2407-12-421
- Kucharzewska P, Christianson HC, Welch JE, Svensson KJ, Fredlund E, Ringner M, Morgelin M, Bourseau-Guilmain E, Bengzon J, Belting M. Exosomes reflect the hypoxic status of glioma cells and mediate hypoxia-dependent activation of vascular cells during tumor development. Proc Natl Acad Sci USA 2013; 110:7312-7; PMID:23589885; http://dx.doi.org/10.1073/pnas.1220998110
- Wang T, Gilkes DM, Takano N, Xiang L, Luo W, Bishop CJ, Chaturvedi P, Green JJ, Semenza GL. Hypoxia-inducible factors and RAB22A mediate formation of microvesicles that stimulate breast cancer invasion and metastasis. Proc Natl Acad Sci USA 2014; 111:E3234-42; PMID:24938788; http://dx.doi.org/10.1073/pnas.1410041111
- Noman MZ, Buart S, Van Pelt J, Richon C, Hasmim M, Leleu N, Suchorska WM, Jalil A, Lecluse Y, El Hage F et al. The cooperative induction of hypoxia-inducible factor-1 alpha and STAT3 during hypoxia induced an impairment of tumor susceptibility to CTL-mediated cell lysis. J Immunol 2009; 182:3510-21; PMID:19265129; http://dx.doi.org/10.4049/jimmunol.0800854
- El-Andaloussi S, Lee Y, Lakhal-Littleton S, Li J, Seow Y, Gardiner C, Alvarez-Erviti L, Sargent IL, Wood MJ. Exosome-mediated delivery of siRNA in vitro and in vivo. Nat protoc 2012; 7:2112-26; PMID:23154783; http://dx.doi.org/10.1038/nprot.2012.131
- Vivier E, Tomasello E, Baratin M, Walzer T, Ugolini S. Functions of natural killer cells. Nat Immunol 2008; 9:503-10; PMID:18425107; http://dx.doi.org/10.1038/ni1582
- Long EO, Kim HS, Liu D, Peterson ME, Rajagopalan S. Controlling natural killer cell responses: integration of signals for activation and inhibition. Ann Rev Immunol 2013; 31:227-58; PMID:23516982; http://dx.doi.org/10.1146/annurev-immunol-020711-075005
- Crane CA, Han SJ, Barry JJ, Ahn BJ, Lanier LL, Parsa AT. TGF-beta downregulates the activating receptor NKG2D on NK cells and CD8+ T cells in glioma patients. Neuro-oncology 2010; 12:7-13; PMID:20150362; http://dx.doi.org/10.1093/neuonc/nop009
- Noman MZ, Buart S, Romero P, Ketari S, Janji B, Mari B, Mami-Chouaib F, Chouaib S. Hypoxia-inducible miR-210 regulates the susceptibility of tumor cells to lysis by cytotoxic T cells. Cancer Res 2012; 72:4629-41; PMID:22962263; http://dx.doi.org/10.1158/0008-5472.CAN-12-1383
- Liu Y, Zhao L, Li D, Yin Y, Zhang C-Y, Li J, Zhang Y. Microvesicle-delivery miR-150 promotes tumorigenesis by up-regulating VEGF, and the neutralization of miR-150 attenuate tumor development. Protein Cell 2013; 4:932-41; PMID:24203759; http://dx.doi.org/10.1007/s13238-013-3092-z
- Muturi HT, Dreesen JD, Nilewski E, Jastrow H, Giebel B, Ergun S, Singer BB. Tumor and endothelial cell-derived microvesicles carry distinct CEACAMs and influence T-Cell behavior. PloS one 2013; 8:e74654; PMID:24040308; http://dx.doi.org/10.1371/journal.pone.0074654
- Hodge G, Barnawi J, Jurisevic C, Moffat D, Holmes M, Reynolds PN, Jersmann H, Hodge S. Lung cancer is associated with decreased expression of perforin, granzyme B and IFNgamma by infiltrating lung tissue T cells, NKT-like and NK cells. Clin Exp Immunol 2014; 178(1):79-85; PMID:24894428; http://dx.doi.org/10.1111/cei.12392
- Greenberg E, Nemlich Y, Markel G. MicroRNAs in cancer: lessons from melanoma. Curr Pharm Des 2014; 20(33):5246-59; PMID:24479804; http://dx.doi.org/10.2174/1381612820666140128210105
- Schatton T, Scolyer RA, Thompson JF, Mihm MC, Jr. Tumor-infiltrating lymphocytes and their significance in melanoma prognosis. Method Mol Biol 2014; 1102:287-324; PMID:24258985; http://dx.doi.org/10.1007/978-1-62703-727-3_16.
- Maeda N, Yoshimura K, Yamamoto S, Kuramasu A, Inoue M, Suzuki N, Watanabe Y, Maeda Y, Kamei R, Tsunedomi R et al. Expression of B7-H3, a potential factor of tumor immune evasion in combination with the number of regulatory T cells, affects against recurrence-free survival in breast cancer patients. Ann Surg Oncol 2014; 21 Suppl 4:S546-54; PMID:24562936; http://dx.doi.org/10.1245/s10434-014-3564-2
- Soliman H, Khalil F, Antonia S. PD-L1 expression is increased in a subset of basal type breast cancer cells. PloS one 2014; 9:e88557; PMID:24551119; http://dx.doi.org/10.1371/journal.pone.0088557
- Alter G, Malenfant JM, Altfeld M. CD107a as a functional marker for the identification of natural killer cell activity. J Immunol Method 2004; 294:15-22; PMID:15604012; http://dx.doi.org/10.1016/j.jim.2004.08.008
- Gorelik L, Flavell RA. Immune-mediated eradication of tumors through the blockade of transforming growth factor-beta signaling in T cells. Nat Med 2001; 7:1118-22; PMID:11590434; http://dx.doi.org/10.1038/nm1001-1118
- Thomas DA, Massague J. TGF-beta directly targets cytotoxic T cell functions during tumor evasion of immune surveillance. Cancer Cell 2005; 8:369-80; PMID:16286245; http://dx.doi.org/10.1016/j.ccr.2005.10.012
- Hayashi H, Inoue Y, Tsutsui H, Okamura H, Nakanishi K, Onozaki K. TGFbeta down-regulates IFN-gamma production in IL-18 treated NK cell line LNK5E6. Biochem Biophys Res Commun 2003; 300:980-5; PMID:12559970; http://dx.doi.org/10.1016/S0006-291X(02)02939-X
- Chandran PA, Keller A, Weinmann L, Adel Seida A, Braun M, Andreev K, Fischer B, Horn E, Schwinn S, Junker M et al. The TGF-beta-inducible miR-23a cluster attenuates IFN-gamma levels and antigen-specific cytotoxicity in human CD8+ T cells. J Leukoc Biol 2014; 96(4):633-45; PMID:25030422; http://dx.doi.org/10.1189/jlb.3A0114-025R
