ABSTRACT
Ibrutinib, a BTK inhibitor, is currently used to treat various hematological malignancies. We evaluated whether ibrutinib treatment during development of murine bone marrow-derived dendritic cells (DCs) modulates their maturation and activation. Ibrutinib treatment increased the proportion of CD11c+ DCs, upregulated the expression of MHC-II and CD80 and downregulated Ly6C expression by DCs. Additionally, ibrutinib treatment led to an increase in MHC-II+, CD80+ and CCR7+ DCs but a decrease in CD86+ DCs upon LPS stimulation. LPS/ibrutinib-treated DCs displayed increased IFNβ and IL-10 synthesis and decreased IL-6, IL-12 and NO production compared to DCs stimulated with LPS alone. Finally, LPS/ibrutinib-treated DCs promoted higher rates of CD4+ T cell proliferation and cytokine production compared to LPS only stimulated DCs. Taken together, our results indicate that ibrutinib enhances the maturation and activation of DCs to promote CD4+ T cell activation which could be exploited for the development of DC-based cancer therapies.
KEYWORDS:
Abbreviations
| BTK | = | Bruton's tyrosine kinase |
| CD | = | Cluster of differentiation |
| CCR7 | = | C–C chemokine receptor type 7 |
| DC | = | Dendritic cell |
| GM-CSF | = | Granulocyte-macrophage colony-stimulating factor |
| IFN | = | Interferon |
| IL | = | Interleukin |
| LPS | = | Lipopolysaccharide |
| MHC | = | Major histocompatibility complex |
| NO | = | Nitric oxide |
| TLR | = | Toll-like receptor |
| TNF | = | Tumor necrosis factor |
Introduction
Ibrutinib, a potent irreversible inhibitor of Tec kinase BTK, is approved for marketing in del(17)(p13.1) or relapsed chronic lymphocytic leukemia (CLL) and mantle cell lymphoma.Citation1 Ibrutinib has also been reported to have favorable immune modulating effects. In addition to its role in killing malignant B cells, ibrutinib modulates the recruitment and cytokine responses of myeloid cells in immune complex disease models.Citation2 Since ibrutinib has been shown to differentially regulate cytokine production and surface marker expression in murine DCs,Citation3 we were interested in further exploring how ibrutinib modulates DC function. A study on DCs from BTK−/− mice suggests that BTK participates in the in vitro development of DCs, modulates LPS-induced cytokine and surface marker expression in DCs and alters the ability of BTK−/− DCs to activate CD4+ T cell responses.Citation4 Therefore, we studied how the inhibition of BTK activity during DC development using ibrutinib would affect the development and subsequent immune responses of DCs. We evaluated this by culturing murine bone marrow-derived cells in the presence of DC polarizing growth factors, with or without ibrutinib. Further, we compared the activation status, immune responses upon LPS stimulation and subsequent T cell activation induced by ibrutinib-treated or untreated DCs.
Materials and methods
Mice strains
Female C57BL/6 (age 8–10 weeks) and OT-II TCR transgenic mice (age 8–10 weeks) were purchased from Harlan and Jackson Laboratories, respectively. All animals were housed in a pathogen-free animal facility in The Ohio State University in accordance with National Institutes of Health and institutional guidelines.
Cultivation and in vitro studies with bone marrow-derived dendritic cells
Bone marrow-derived DCs from C57BL/6 mice were cultivated as described previously with some modifications.Citation3 Briefly, bone marrow cells were isolated from femurs and tibias of mice, treated with ACK lysis buffer and plated in complete RPMI medium supplemented with 10% fetal bovine serum (Atlanta Biologicals), 1% penicillin (20 Units/mL)/streptomycin (20 μg/mL) (Life Technologies) and 20 ng/mL GM-CSF (Peprotech) for 7 d. At Day 1, 1 μM ibrutinib (Pharmacyclics Inc.) or PBS was added to the culture and remained in the supernatant until the end of the culture period to generate ibrutinib-treated and untreated DCs, respectively. At Day 7, ibrutinib-treated and untreated DCs were collected by gently harvesting the cells in the floating fraction of the culture medium to obtain > 60% purity of CD11c+ DCs, which was then analyzed for expression of surface markers by flow cytometry. Cells were rested overnight, prior to subsequent LPS activation studies.
In vitro LPS activation studies
Overnight rested ibrutinib-treated and untreated DCs were stimulated with 1 μg/mL LPS (Sigma-Aldrich) at 37°C and 5% CO2 for 24 or 48 h. After 24 h, supernatants were harvested for cytokine analyses by ELISACitation5 and cells were isolated for flow cytometric analysis. After 48 h, supernatants were harvested to determine nitric oxide (NO) production by Griess assay.Citation6
T cell co-culture and proliferation studies
Overnight rested DCs (with or without ibrutinib treatment) were pulsed with 10 μg/mL OVA-peptide (323–339) (Anaspec) for 2 h prior to treatment with 1 μg/mL LPS (Sigma-Aldrich) for 22 h. After OVA/LPS stimulation, DCs were cultured with nylon wool-enriched CFSE-labeled T cells or T and B cells in 1:4 ratio each. T cell and B cell fractions were prepared from OT-II mice which was described previously.Citation3,5 Briefly, single cell suspensions prepared from the spleens from OT-II mice in complete RPMI medium were treated with ACK Lysis buffer and incubated in pre-equilibrated nylon wool columns for 1 h. After incubation, cells were eluted from the column to get the T cell enriched fraction with >90% CD3+ T cells. The column was plunged with media to recover the B cell enriched fraction with >65% cells B220+ B cells and approximately 25% CD3+ T cells. After 4 or 6 d of DC-T cell or DC-T and B cell co-culture, T cell proliferation was evaluated by flow cytometry based on the reduction of CFSE fluorescence. Culture supernatants were harvested for cytokine analyses by ELISA.Citation5
Flow cytometry
Cells were prepared for flow cytometry analysis as described previously.Citation3,5 In order to study the expression of surface markers on DCs, cells were blocked using normal mouse serum and incubated with conjugated antibodies against various cell surface markers including CD11c, Ly6C, MHC-II, CD80, CD86 and CCR7 (Biolegend). Samples were acquired on a BD FACS Calibur (BD Biosciences). Data analysis was performed using FlowJo software (Tree Star, Inc.). Analysis was conducted by gating on CD11c+ cells using isotype controls for the corresponding conjugated antibody. In order to measure proliferation in T cell co-culture assay, cells from co-cultures assays were blocked as mentioned above and incubated with conjugated antibody against CD4 (Biolegend). Percentage of proliferating CD4+ cells was measured by evaluating reduction of CFSE using the Proliferation platform in the FlowJo software.
Statistical analysis
All statistical analyses were done using Prism 5 (GraphPad Software). Student's unpaired t test was employed to determine statistical significance of values obtained. The p values less than 0.05 were considered statistically significant.
Results and discussion
Ibrutinib treatment enhances the development and maturation of DCs
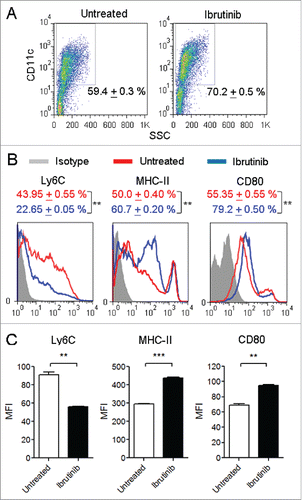
In order to study whether inhibition of BTK using ibrutinib treatment affects DC development, we compared the proportion of CD11c+ DCs generated from ibrutinib-treated and untreated DC cultures. We observed that ibrutinib-treated DC cultures had a significantly higher percentage of CD11c+ DCs compared to ibrutinib-untreated DC cultures (). We also analyzed the maturation status of ibrutinib-treated and untreated DCs by measuring the expression of surface markers such as Ly6C, MHC-II and the co-stimulatory molecule, CD80. Ibrutinib treatment increased the percentage of MHC-II+ and CD80+ DCs and decreased the percentage of Ly6C+ DCs (). Further, ibrutinib-treated DCs displayed higher cell-surface expression levels of MHC-II and CD80 and lower expression levels of Ly6C compared to untreated DCs ().
Figure 1. Ibrutinib treatment enhances the development and maturation of DCs. (A) Dot plots show the percentages of CD11c+ DCs in untreated and ibrutinib-treated DC cultures. Numbers denote mean + SEM of duplicate percentage values. (B) Histograms show the expressions of Ly6C, MHC-II and CD80 in CD11c+ DCs from untreated and ibrutinib-treated DC cultures. Numbers denote mean + SEM of duplicate percentage values of cells expressing the respective surface molecule. (C) Mean fluorescence intensities of Ly6C, MHC-II and CD80 expression in CD11c+ DCs from untreated and ibrutinib-treated DC cultures. The data are presented as mean + SEM of duplicate MFI values. Bone marrow cells from C57BL/6 mice were cultured in the presence of GM-CSF, without or with 1 µM ibrutinib for 7 d to generate untreated and ibrutinib-treated DCs, respectively. At Day 7, DC cultures were stained with the fluorescently labeled antibodies for the respective surface markers and their expressions were determined by flow cytometry. The data presented are representative of three independent experiments. **p < 0.001, ***p < 0.0001.

When DCs undergo maturation, they downregulate Ly6C, upregulate CD11c and enhance the expression of MHC-II and CD80.Citation7,8 Ibrutinib treatment reduced the expression of Ly6C and increased the expression of MHC-II and CD80 on DCs suggesting that it promotes the maturation of DCs. Taken together, our results indicate that inhibition of BTK using ibrutinib enhances the development and maturation of bone marrow-derived DCs.
Ibrutinib modulates activation of DCs in response to LPS stimulation
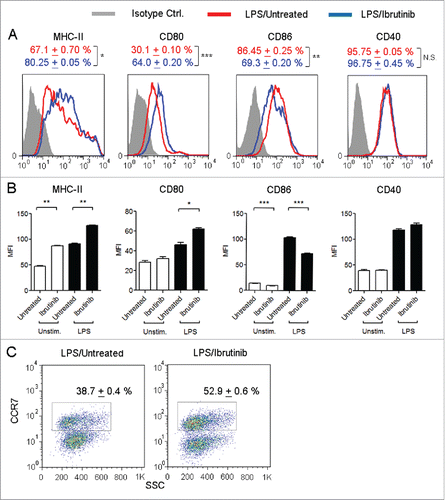
Since ibrutinib-treated DCs are more mature compared to untreated DCs, we studied whether ibrutinib-treated DCs would respond more robustly to inflammatory stimuli. Using LPS, a TLR-4 ligand, as an immunogen, we compared the expression of MHC-II and co-stimulatory molecules such as CD80, CD86 and CD40 in ibrutinib-treated and untreated DCs. We observed that ibrutinib treatment increased the percentage of MHC-II+ and CD80+ DCs and decreased the percentage of CD86+ DCs upon LPS stimulation (). Additionally, LPS/ibrutinib-treated DCs upregulated the expression levels of MHC-II and CD80 and downregulated expression levels of CD86 compared to LPS/untreated DCs (). We did not find any significant difference in the percentage of CD40+ DCs or levels of CD40 between LPS/ibrutinib-treated and LPS/untreated DCs ().
Figure 2. Ibrutinib differentially regulates the expression of MHC-II, co-stimulatory molecules and CCR7 on LPS-treated DCs. (A) Histograms show the expressions of MHC-II, CD80, CD86 and CD40 in CD11c+ DCs from LPS/untreated and LPS/ibrutinib-treated DCs. Numbers denote mean + SEM of duplicate percentage values. (B) Mean fluorescence intensities of MHC-II, CD80, CD86 and CD40 on CD11c+ DCs from untreated and ibrutinib-treated DCs upon LPS stimulation. The data are presented as mean + SEM of duplicate MFI values. (C) Dot plots show the percentage of CCR7+ cells in CD11c+ DCs from LPS/untreated and LPS/ibrutinib-treated DC cultures. Numbers denote mean + SEM of duplicate percentage values. Untreated and ibrutinib-treated DCs were treated with control (media) or LPS (1 μg/mL) for 24 h. After 24 h, cells were stained with fluorescently labeled antibody for the respective surface molecules and their expressions were determined by flow cytometry. Analyses were conducted by gating on CD11c+ DCs. The data presented are representative of three independent experiments. *p < 0.05, **p < 0.001, ***p < 0.0001.

Upon maturation and activation, DCs upregulate the expression of a chemokine receptor, CCR7, in order to migrate from peripheral sites into T cell specific regions within the draining lymph node and induce T cell responses.Citation9 Since ibrutinib treatment enhances the maturation and activation status of DCs, we evaluated whether this would also enhance CCR7 expression on DCs. We observed a higher percentage of CCR7+ DCs in LPS/ibrutinib-treated DC cultures compared to LPS/untreated DC cultures ().
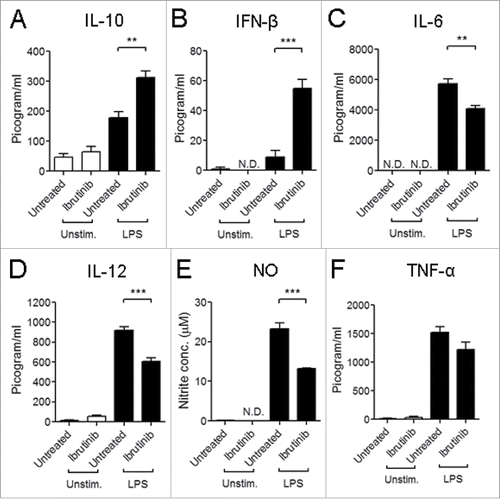
When we compared LPS-induced cytokine and NO responses in ibrutinib-treated and untreated DCs, we observed that LPS/ibrutinib-treated DCs produced higher levels of IL-10 and IFNβ () and lower levels of IL-6, IL-12 and NO (). There was no significant difference in TNF-α production between LPS/ibrutinib-treated and LPS/untreated DCs ().
Figure 3. Ibrutinib differentially regulates cytokine production and nitric oxide (NO) responses by LPS-treated DCs. (A) IL-10, (B) IFNβ, (C) IL-6, (D) IL-12, (E) NO and (F) TNF-α production by untreated and ibrutinib-treated DCs upon LPS stimulation. Untreated and ibrutinib-treated DCs were treated with control (media) or LPS (1 μg/mL). After 24 h of LPS treatment, cytokine production was determined in the culture supernatants by ELISA. After 48 h of LPS treatment, NO levels were determined in the culture supernatants by measuring nitrite concentrations using Griess assay. The data are presented as mean + SEM of triplicate sample values from two independent experiments. **p < 0.001, ***p < 0.0001.

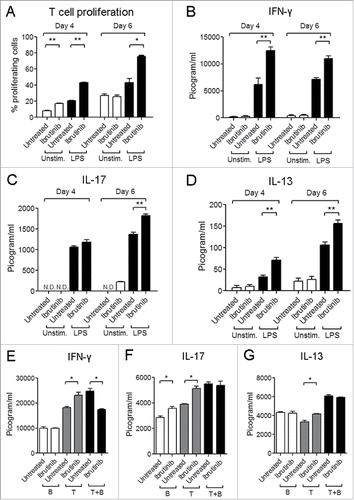
Since ibrutinib differentially regulates surface marker expression and cytokine production (), we studied whether this would impact the ability of DCs to activate CD4+ T cell responses. We studied this using an ovalbumin (OVA) peptide antigen-specific DC: T cell co-culture model. We observed that LPS/ibrutinib-treated DCs promoted higher rates of T cell proliferation compared to LPS/untreated DCs (). We also measured the levels of cytokines in the co-culture supernatants. While LPS/ibrutinib-treated DCs enhanced IFNγ and IL-13 production at earlier and later time points compared to LPS/untreated DCs, IL-17 production was significantly higher at a later time point (). We also evaluated whether the presence of B cells in the co-culture altered the ability of LPS/ibrutinib-treated DCs to enhance T cell responses. We observed that LPS/ibrutinib-treated DCs promoted T cell proliferation compared to LPS/untreated DCs even in the presence of B cells (data not shown). However, the presence of B cells led to significant reduction in production of IFNγ by T cells but had no effect on IL-13 and IL-17 production compared T cells co-cultured with LPS/untreated DC in the presence of B cells (). Taken together, our results indicate that ibrutinib differentially regulates LPS-mediated surface marker expression and cytokine production in DCs to enhance CD4+ T cell activation.
Figure 4. Ibrutinib-treated DCs enhance T cell proliferation and production of T cell derived cytokines. (A) Analysis of T cell proliferation upon co-culture with untreated, ibrutinib-treated, LPS/untreated or LPS/ibrutinib-treated DCs. Untreated and ibrutinib-treated DCs were pulsed with OVA (10 μg/mL) for 2 h prior to treatment with LPS (1 μg/mL) for 22 h. After OVA/LPS stimulation, DCs were cultured in 1:4 ratio with CFSE-stained T cells enriched from spleens of OT-II mice for 4 or 6 d. At Day 4 and 6, cells from co-culture were stained with anti-CD4 antibody and T cell proliferation was measured by flow cytometry. Analyses were conducted by gating on CD4+ population. Production of cytokines (B) IFNγ, (C) IL-17 and (D) IL-13 in co-culture experiments performed as mentioned in A. At Day 4 and 6 of co-culture, cell culture supernatants were collected and the respective cytokines were measured by ELISA. Production of cytokines (E) IFNγ, (F) IL-17 and G) IL-13 in DC, T cell and B cell co-culture experiments. OVA pulsed LPS/untreated and LPS/ibrutinib-treated DCs were cultured in 1:4 ratio each with B cell fraction (B), T cell fraction (T) or both (T + B) prepared by nylon wool enrichment from spleens of OT.II mice for 6 d and cytokines were measured in the culture supernatants. The data are presented as mean + SEM of duplicate sample values and are representative of two independent experiments. *p < 0.05, **p < 0.001.

Our observations for higher IL-10 and lower IL-12 production by ibrutinib-treated DCs is consistent with a study on LPS-mediated cytokine production in BTK−/− macrophages and DCs.Citation10 Further, lower NO production upon LPS stimulation has been demonstrated in XID macrophages which possess a mutation in BTK that interferes with normal BTK signaling.Citation11
Our previous study on the LPS-mediated responses upon ibrutinib treatment of differentiated DCs demonstrated that ibrutinib-treated DCs decrease CD86 and NO production and increase CD80 and IL-10 production which corroborates with our current observations ().Citation3 However, the contrasting differences between the two studies in cytokines such as TNF-α and IL-6 and expression of surface markers like MHC-II suggests that BTK plays a dual role in both development as well as TLR-4 signaling of DCs. Indeed, BTK has been previously described to play an inhibitory role during the in vitro development and BTK deficiency promotes the development of DCs which are more activated compared to wildtype (WT) DCs.Citation4 BTK−/− DCs express higher levels of MHC-II and CD80 and promote higher CD4+ T cell responses compared to WT DCs which we also observed in our current study (). On the other hand, the study by Kawakami et al. finds that BTK−/− DCs produce lower amounts of IL-10 compared to WT DCs. Further, the authors propose that the reduced IL-10 production by BTK−/− DCs enhances DC-mediated T cell proliferation. Interestingly, our results indicate that higher IL-10 production by DCs upon BTK inhibition may not necessarily dampen DC-mediated T cell proliferation (). It is possible that the increased CD80 expression () and IFNβ production () upon ibrutinib treatment compensate for the inhibitory effects of IL-10 on T cell activation and differentiation. CD80/CD28 co-stimulation initiates the activation of naive CD4+ T cellsCitation12 while IFNβ enhances the ability of DCs to induce T cell proliferation and cytokine production.Citation13 Furthermore, previous studies have shown that deficient NO production by DCs mediates higher rates of T cell proliferation under in vitro conditions.Citation14 Our previous study on ibrutinib also suggests a correlation between lower NO production by ibrutinib-treated DCs and higher rates of DC-mediated T cell proliferation.Citation3 Hence, the lower NO production by DCs upon ibrutinib treatment could also be responsible for the enhanced DC-mediated T cell proliferation. Our study also demonstrates that the presence of other immune cells such as B cells in the DC-T cell co-culture alters the cytokine profile induced upon ibrutinib treatment on DCs (). It is likely that cytokines produced by effector B cells in the co-culture modulate T cell responses as has been previously reported.Citation15 We observed that IFNγ levels are reduced in the presence of B cells in LPS/ibrutinib-treated DC co-culture compared to LPS/untreated DC co-culture. Since IL-10 production by B cells suppresses Th1 responses,Citation16 we also measured the levels of IL-10 in these cultures. However, we could not detect the presence of this cytokine in the co-culture supernatants suggesting that suppression of IFNγ in the presence of B cells is not mediated by IL-10. Our future studies will focus on further characterizing this IL-10-independent mechanism by which the presence of immune cells such as B cells and cancer cells affect the ability of ibrutinib to enhance DC-mediated T cell responses.
DC-based immunotherapies have been employed to promote the maturation and activation of non-functional DCs in cancer patients in order to elicit higher anticancer T cell responses.Citation17 The success of these therapies is dependent on the culture of mature DCs which display high T cell-stimulatory capacity and express high levels of CCR7 to home to lymph nodes. However, many DC-based therapies have poor clinical efficacy because the DC culture strategies generate immature or partially mature DCs.Citation18 Since ibrutinib enhances the expression of MHC-II, co-stimulatory molecules and CCR7 and promotes DC-mediated T cell activation, it should be further explored for the generation of mature DCs for cancer therapy. A high percentage of CLL patients display immunodeficiency which is characterized by the lack of immunoglobulin production and defective T cell responses. This immune dysfunction can be observed from early stages of the disease, is perpetuated by the immunosuppressive activity of drugs administered during the treatment phase and also leads to poor immunity against infections commonly observed in CLL patients.Citation19,20 Certain DC-based vaccines administered to CLL patients restore T cell function by enhancing IFNγ production and T cell proliferation with a concomitant decrease in the frequency of regulatory T cells in vivo.Citation21 Therefore, DC-based therapies have the potential to mitigate immunodeficiency during CLL by improving T cell responses. Our studies provide a rationale for the use of ibrutinib in the development of DC-based vaccines for alleviating immunodeficiency during CLL. Future studies which focus on how ibrutinib modulates DC development and maturation will be critical in the translation of ibrutinib for such DC-based cancer therapies.
Disclosure of potential conflicts of interest
No potential conflicts of interest were disclosed.
Acknowledgment
We thank Pharmacyclics Inc., CA for providing us with ibrutinib for our studies.
Funding
This work was supported by National Institutes of Health grants R03AI090231, RC4AI092624, R34AI100789, R21AT004160 and R03CA164399 awarded to A.R.S., R01CA162411 and R35CA197734 to J.C.B and National Institute of Dental and Craniofacial Research Training Grant T32DE014320 awarded to S.O.
References
- Berglöf A, Hamasy AJ, Meinke S, Palma M, Krstic A, Månsson R, Kimby E, Österborg A, Smith CI. Targets for Ibrutinib beyond B cell malignancies. Scand J Immunol 2015; 82(3):208-17; PMID:26111359; http://dx.doi.org/10.1111/sji.12333
- Chang BY, Huang MM, Francesco M, Chen J, Sokolove J, Magadala P, Robinson WH, Buggy JJ. The Bruton tyrosine kinase inhibitor PCI-32765 ameliorates autoimmune arthritis by inhibition of multiple effector cells. Arthritis Res Ther 2011; 13:R115; PMID:21752263; http://dx.doi.org/10.1186/ar3400
- Natarajan G, Terrazas C, Oghumu S, Varikuti S, Dubovsky JA, Byrd JC, Satoskar AR. Ibrutinib enhances IL-17 response by modulating the function of bone marrow derived dendritic cells. OncoImmunology 2015; 5:e1057385; PMID:26942065; http://dx.doi.org/10.1080/2162402X.2015.1057385.
- Kawakami Y, Inagaki N, Salek-ardakani S, Kitaura J, Tanaka H, Nagao K. Regulation of dendritic cell maturation and function by Bruton's tyrosine kinase via IL-10 and Stat3. Proc Natl Acad Sci USA 2006; 103:153-8; PMID:16371463; http://dx.doi.org/10.1073/pnas.0509784103
- Oghumu S, Varikuti S, Terrazas C, Kotov D, Nasser MW, Powell CA, Ganju RK, Satoskar AR. CXCR3 deficiency enhances tumor progression by promoting macrophage M2 polarization in a murine breast cancer model. Immunology 2014; 143(1):109-19; PMID:24679047; http://dx.doi.org/10.1111/imm.12293
- Sanchez Y, Rosado JDD, Vega L, Elizondo G, Estrada-Muñiz E, Saavedra R, Juárez I, Rodríguez-Sosa M. The unexpected role for the aryl hydrocarbon receptor on susceptibility to experimental toxoplasmosis. J Biomed Biotechnol 2010; 2010:505694; PMID:20111744; http://dx.doi.org/10.1155/2010/505694
- Lutz MB, Schuler G. Immature, semi-mature and fully mature dendritic cells: which signals induce tolerance or immunity? Trends Immunol 2002; 23:445-9; PMID:12200066; http://dx.doi.org/10.1016/S1471-4906(02)02281-0
- Caton ML, Smith-Raska MR, Reizis B. Notch-RBP-J signaling controls the homeostasis of CD8- dendritic cells in the spleen. J Exp Med 2007; 204:1653-64; PMID:17591855; http://dx.doi.org/10.1084/jem.20062648
- Randolph GJ. Dendritic cell migration to lymph nodes: cytokines, chemokines, and lipid mediators. Semin Immunol 2001; 13:267-74; PMID:11502161; http://dx.doi.org/10.1006/smim.2001.0322
- Ní Gabhann J, Spence S, Wynne C, Smith S, Byrne JC, Coffey B, Stacey K, Kissenpfennig A, Johnston J, Jefferies CA. Defects in acute responses to TLR4 in Btk-deficient mice result in impaired dendritic cell-induced IFN-γ production by natural killer cells. Clin Immunol 2012; 142:373-82; PMID:22281426 http://dx.doi.org/10.1016/j.clim.2011.12.009
- Mukhopadhyay S, Mohanty M, Mangla A, George A, Bal V, Rath S, Ravindran B. Macrophage effector functions controlled by Bruton's Tyrosine Kinase are more crucial than the cytokine balance of T cell responses for microfilarial clearance. J Immunol 2002; 168:2914-21; PMID:11884462; http://dx.doi.org/10.4049/jimmunol.168.6.2914
- Walsh KP, Mills KHG. Dendritic cells and other innate determinants of T helper cell polarisation. Trends Immunol 2013; 34:521-30; PMID:23973621; http://dx.doi.org/10.1016/j.it.2013.07.006
- Montoya M, Schiavoni G, Mattei F, Gresser I, Belardelli F, Borrow P, Tough DF. Type I interferons produced by dendritic cells promote their phenotypic and functional activation. Blood 2002; 99:3263-72; PMID:11964292; http://dx.doi.org/10.1182/blood.V99.9.3263
- Lu L, Bonham CA, Chambers FG, Watkins SC, Hoffman RA, Simmons RL, Thornson AW. Induction of nitric oxide synthase in mouse dendritic cells by IFN-γ, endotoxin, and interaction with allogeneic T cells. J Immunol 1996; 157:3577-86; PMID:8871658
- Harris DP, Haynes L, Sayles PC, Duso DK, Eaton SM, Lepak NM, Johnson LL, Swain SL, Lund FE. Reciprocal regulation of polarized cytokine production by effector B and T cells. Nat Immunol 2000; 1:475-82; PMID:11101868; http://dx.doi.org/10.1038/82717
- Mosmann T. Complexity or coherence? Cytokine secretion by B cells. Nat Immunol 2000; 1:465-6; PMID:11101865; http://dx.doi.org/10.1038/82707
- Palucka K, Banchereau J. Cancer immunotherapy via dendritic cells. Nat Rev Cancer 2012; 12:265-77; PMID:22437871; http://dx.doi.org/10.1038/nrc3258
- Kalinski P, Urban J, Narang R, Berk E, Wieckowski E, Muthuswamy R. Dendritic cell-based therapeutic cancer vaccines: what we have and what we need. Futur Oncol 2010; 5:379-90; PMID:19374544; http://dx.doi.org/10.2217/fon.09.6
- Melchardt T, Weiss L, Greil R, Egle A. Viral infections and their management in patients with chronic lymphocytic leukemia. Leuk Lymphoma 2013; 54:1602-13; PMID:23206225; http://dx.doi.org/10.3109/10428194.2012.755178
- Hamblin AD, Hamblin TJ. The immunodeficiency of chronic lymphocytic leukaemia. Br Med Bull 2008; 87:49-62; PMID:18755702; http://dx.doi.org/10.1093/bmb/ldn034
- Palma M, Hansson L, Choudhury A, Näsman-Glaser B, Eriksson I, Adamson L, Rossmann E, Widén K, Horváth R, Kokhaei P, Vertuani S, Mellstedt H, Österborg A. Vaccination with dendritic cells loaded with tumor apoptotic bodies (Apo-DC) in patients with chronic lymphocytic leukemia: effects of various adjuvants and definition of immune response criteria. Cancer Immunol Immunother 2012; 61:865-79; PMID:22086161; http://dx.doi.org/10.1007/s00262-011-1149-5
