
ABSTRACT
Colony stimulating factor-1 (CSF-1) is produced by a variety of cancers and recruits myeloid cells that suppress antitumor immunity, including myeloid-derived suppressor cells (MDSCs.) Here, we show that both CSF-1 and its receptor (CSF-1R) are frequently expressed in tumors from cancer patients, and that this expression correlates with tumor-infiltration of MDSCs. Furthermore, we demonstrate that these tumor-infiltrating MDSCs are highly immunosuppressive but can be reprogrammed toward an antitumor phenotype in vitro upon CSF-1/CSF-1R signaling blockade. Supporting these findings, we show that inhibition of CSF-1/CSF-1R signaling using an anti-CSF-1R antibody can regulate both the number and the function of MDSCs in murine tumors in vivo. We further find that treatment with anti-CSF-1R antibody induces antitumor T-cell responses and tumor regression in multiple tumor models when combined with CTLA-4 blockade therapy. However, this occurs only when administered after or concurrent with CTLA-4 blockade, indicating that timing of each therapeutic intervention is critical for optimal antitumor responses. Importantly, MDSCs present within murine tumors after CTLA-4 blockade showed increased expression of CSF-1R and were capable of suppressing T cell proliferation, and CSF-1/CSF-1R expression in the human tumors was not reduced after treatment with CTLA-4 blockade immunotherapy. Taken together, our findings suggest that CSF-1R-expressing MDSCs can be targeted to modulate the tumor microenvironment and that timing of CSF-1/CSF-1R signaling blockade is critical to improving responses to checkpoint based immunotherapy.
Significance: Infiltration by immunosuppressive myeloid cells contributes to tumor immune escape and can render patients resistant or less responsive to therapeutic intervention with checkpoint blocking antibodies. Our data demonstrate that blocking CSF-1/CSF-1R signaling using a monoclonal antibody directed to CSF-1R can regulate both the number and function of tumor-infiltrating immunosuppressive myeloid cells. In addition, our findings suggest that reprogramming myeloid responses may be a key in effectively enhancing cancer immunotherapy, offering several new potential combination therapies for future clinical testing. More importantly for clinical trial design, the timing of these interventions is critical to achieving improved tumor protection.
KEYWORDS:
Introduction
Therapeutic antibody blockade of CTLA-4 or PD-1 are now approved regimens for the treatment of advanced melanoma, renal cell carcinoma and non-small cell lung cancer (NSCLC). Clinical benefit has, however, been limited to a subset of patients.Citation1-6,53-55 Identification of resistance mechanisms and development of combinatorial strategies is, therefore, crucial for further improvement of these therapies. Multiple factors can contribute to resistance of cancer to immunotherapies and one dominant feature is the presence of an immunosuppressive tumor microenvironment. The tumor microenvironment contains multiple subtypes of infiltrating myeloid cells, including MDSCs that support tumor progression by suppressing antitumor immune responses and promoting angiogenesis. Clinical data and experimental studies have established the pro-tumorigenic potential of tumor-infiltrating MDSCs.Citation7 MDSCs have been classified by their surface marker expression profiles into distinct subsets and are typically characterized as either CD1–1b+Ly6G+Ly6C−/low granulocytic MDSCs (G-MDSCs) or CD11b+Ly6G−/lowLy6Chigh monocytic MDSCs (MO-MDSCs) with diverse functions in tumor and other tissues.Citation7-10
Several cytokines and chemokines are implicated in the recruitment of myeloid cells to the tumor, including colony-stimulating factor-1 (CSF-1).Citation8-11 CSF-1 signaling through its receptor CSF-1R is a critical regulator of survival, differentiation and proliferation of myeloid cells and their precursors.Citation12,13 CSF-1 is highly expressed by several tumors types, and in some cancers, its expression correlates with diminished survival.Citation14,15 It has been demonstrated that CSF-1 is involved in myeloid infiltration of tumors leading to increased tumor progression and angiogenesis.Citation13,14,16-18 Targeting of CSF-1R has therefore emerged as a strategy to limit attraction of MDSCs or block their tumor-promoting functions.Citation19,20 In preclinical studies, therapeutic antibodies and small-molecule inhibitors directed against CSF-1R have been reported to inhibit the immunosuppressive tumor microenvironment and facilitate immune responses to cancer.Citation16,21-25
This pathway has led to the development of various anti-CSF-1R antibodies and small molecule inhibitors as a single agent and in combination with other therapeutic modalities for the treatment of cancer patients.Citation26
In the current study, we evaluate the mechanism by which blockade of CSF-1/CSF-1R signaling inhibits MDSCs by exploring both murine and human systems. We find that recruitment of MDSCs to tumors is regulated by CSF-1/CSF-1R signaling, and that inhibition of CSF-1/CSF-1R signaling with blocking antibodies alleviates immune suppression not only by decreasing the number of MDSCs, but also by reprogramming MDSCs to facilitate antigen presentation and augment T-cell activation within the tumor microenvironment. Supporting these findings, we show high expression of CSF-1 as well as CSF-1R in human melanoma and lung tumors. CSF-1R-expressing MDSCs from the human tumors are highly suppressive in vitro, yet these suppressions can be abolished by CSF-1R blockade. Moreover, it has been demonstrated that an immunosuppressive tumor microenvironment mediated by CSF-1 may limit the antitumor activity of checkpoint blockade and lead to low response rates in preclinical models (Holmgaard et al. in review 2015).Citation18 Here, we find that targeting CSF-1/CSF-1R in combination with CTLA-4 blockade results in greater inhibition of MDSC tumor accumulation and synergistic tumor growth reduction, but only when CSF-1R blockade was administered after or concurrently with CTLA-4 blockade, indicating that the therapeutic effect is highly dependent on timing. Overall, our data suggest that reprogramming myeloid cell responses via CSF-1/CSF-1R blockade could improve antitumor responses in patients but timing is critical and benefit is only seen if CTLA-4 blockade is given prior to or concurrently with CSF-1/CSF-1R blockade
Results
CSF-1/CSF-1R signaling blockade reduces tumor infiltration by myeloid cell subsets
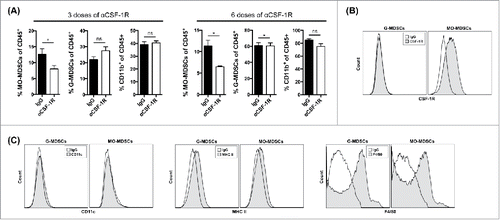
Recently, our group as well as Zhu et al. have reported that inhibition of CSF-1/CSF-1R signaling with small molecule inhibitors can improve the efficacy of checkpoint blockade in murine tumor models by enhancing anti-CTLA-4- and anti-PD-1-induced tumor immunity (Holmgaard et al., under review 2015).Citation18 However, the mechanism by which inhibition of CSF-1/CSF-1R signaling alters tumor immunity requires further characterization. In order to understand the impact of CSF-1/CSF-1R signaling blockade on myeloid responses in murine tumor models, 4T1 tumor-bearing mice were treated with the CSF-1R blocking antibody CS7 (αCSF-1R). An antibody similar to CS7 is currently under clinical development and being tested in phase one clinical trials (NCT01346358). Tumor growth was evaluated serially and tumor-infiltrating myeloid composition was assessed at various time points. Three doses of αCSF-1R treatment resulted in a significant reduction in the number of tumor-infiltrating CD11b+Ly6G−/lowLy6Chigh monocytic MDSCs (MO-MDSCs), but not CD11b+Ly6G+Ly6C−/low granulocytic MDSCs (G-MDSCs) () in this tumor model. This was also observed after six doses of αCSF-1R (). In addition, we found that only the MO-MDSCs expressed CSF-1R (). Importantly, both MDSC subsets were characterized by low levels of MHC class II and CD11c and intermediate expression of F4/80 (), confirming their status as immature myeloid cells and distinguishing them from mature myeloid cells such as dendritic cells and macrophages.
Figure 1. Blockade of CSF-1R signaling reprograms the tumor microenvironment (A) Mice were injected with 4T1 tumor cells and treated with αCSF-1R or IgG. Frequencies of CD11b+Ly6G−/lowLy6Chigh. MO-MDSCs, CD11b+Ly6G+Ly6C−/low G-MDSCs and total CD11b+ myeloid cells of total CD45+ cells in tumors after three and six doses of treatment. (B) Expression of CSF-1R within the CD11b+Ly6G−/lowLy6Chigh and CD11b+Ly6G+Ly6C−/low gated populations. (C) CD11b+Ly6G−/lowLy6Chigh and CD11b+Ly6G+Ly6C−/low subsets from 4T1 tumors were evaluated for expression of CD11c, MHC class II and F4/80 markers (filled histograms) against their matched isotype controls (open histograms). Data are mean +/– SEM.
Inhibition of CSF-1/CSF-1R signaling reprograms tumor-infiltrating MO-MDSCs
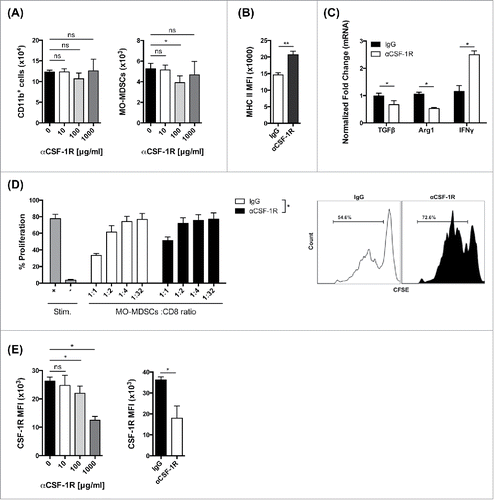
Despite loss of MO-MDSCs, the total number of CD11b+ myeloid cells was not changed significantly by αCSF-1R treatment (). To determine whether CSF-1R blockade reprograms MO-MDSCs or preferentially depletes/kills CSF-1R expressing MO-MDSCs, we FACS sorted CD11b+ cells from mice bearing established 4T1 tumors and treated them with αCSF-1R in vitro. We observed that the number of MO-MDSCs was significantly reduced (p < 0.05) after in vitro culture with 100 μg/mL αCSF-1R, while the total number of CD11b+ cells remained without significant change (), suggesting that the level of MO-MDSC cell depletion/death is not higher following αCSF-1R treatment. The remaining cells displayed markedly increased expression of MHC class II (), suggesting enhanced antigen presentation capacity. We also observed reduced expression of the immunosuppressive molecules Arg1 and TGFβ (). By contrast, IFNγ, a surrogate marker for antitumor activity, was upregulated after CSF-1R inhibition (). Taken together, these data suggest that αCSF-1R treatment preferentially, but not exclusively, reprograms MDSCs potentially supporting antitumor T cell responses.
Figure 2. CSF-1/CSF-1R signaling blockade reprograms MO-MDSC response (A) Number of total CD11b+ cells and MO-MDSCs after in vitro culture of 4T1 tumor-infiltrating CD11b+ cells with different concentrations of αCSF-1R as indicated. (B) MHC class II expression by MFI in purified MO-MDSCs after in vitro culture with 100 μg/mL IgG or αCSF-1R. (C) RT-PCR analysis for Arg1, TGFβ and IFNγ mRNA expression on purified CD11b+ cells after in vitro culture with 100 μg/mL IgG or αCSF-1R. (D) CD8+ T cell suppression by MO-MDSCs from αCSF-1R-treated 4T1 tumor-bearing mice (day 23). Percent CD8+ T cell proliferation in different MO-MDSCs to CD8+ T cell ratios as indicated, and representative histograms of CD8+ T cell proliferation in MDSC to CD8+ T cell ratios of 1:2. (E) CSF-1R expression by MFI in purified MO-MDSCs after in vitro or in vivo treatment with IgG or αCSF-1R. Data are mean +/– SEM.
CSF-1/CSF-1R signaling blockade reduces the suppressive capacity of tumor-infiltrating MO-MDSCs
To assess whether CSF-1R blockade could functionally alter the ability of MO-MDSCs to impair T cell function, we measured the suppressive activity of MO-MDSCs isolated from 4T1 tumors following six doses of CSF-1R blocking antibody. In addition to reduced expression of immunosuppressive factors noted above, we found that MO-MDSCs that remained after αCSF-1R-treatment had reduced ability to suppress CD8+ T cell proliferation in vitro (). These data suggest that CSF-1R blockade not only alters the phenotype and cytokine profiles of tumor-infiltrating MO-MDSCs, but also favorably influences their function. Finally, we found that the expression of CSF-1R on MO-MDSCs was significantly reduced by αCSF-1R treatment in vitro and in vivo (), suggesting that CSF-1Rhigh MDSCs are preferentially yet passively eliminated upon αCSF-1R via changes in phenotype and function.
MDSCs are frequently found in CSF-1 producing tumors from melanoma and NSCLC patients
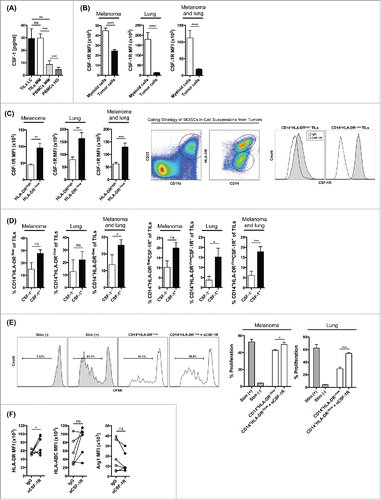
To assess the significance and translational relevance of our findings, we characterized the expression of CSF-1 in human cancer. We analyzed cell cultures of tumor cell suspensions prepared from fresh tumors from patients with metastatic melanoma and NSCLC and found that tumors from the majority of patients with resected melanoma (9 of 12) or NSCLC (7 of 12) produced high levels of CSF-1 (>20 pg/mL) (). CSF-1 was also detectable in PBMC samples from cancer patients, although at markedly lower levels than what we observed in tumor samples (). By contrast, CSF-1 was undetectable in PBMCs from healthy donors (). These observations are consistent with other reports Citation14,16,18,27 and suggest that melanoma and lung tumor cells frequently produce high levels of CSF-1. In addition to CSF-1, CSF-1R expression was frequently detected in both melanoma and lung tumors. CSF-1R was mainly detected in the tumor-infiltrating myeloid cells, and not in tumor cells (). MDSCs in cancer patients have been characterized by the expression of CD11b, CD33, CD14, Arg1 and low/absent expression of HLA-DR.Citation28 We found that CSF-1R expression was significantly increased in the CD11b+CD33+CD14+HLA-DR−/low myeloid cell population compared to CD11b+CD33+CD14+HLA-DRhigh cells (), indicating that the cellular source of CSF-1R in these tumors is mainly MDSCs. Furthermore, we found that the total number of CD11b+CD33+CD14+HLA-DR−/low cells as well as the frequency of CSF-1R-expressing CD11b+CD33+CD14+HLA-DR−/low were numerically increased in patients with detectable concentrations of CSF-1 in their tumors, but these selected differences were not statistically significant ().
Figure 3. CSF-1/CSF-1R signaling blockade alters the function and phenotype of MDSCs from human melanoma and lung tumors. (A) Production of CSF-1 in tumor samples from patients with lung cancer, in tumor and PBMC samples from patients with melanoma, and in PBMCs from healthy donors. (B) CSF-1R expression in myeloid cells and tumor cells from tumors of patients with melanoma and lung cancer. (C) CSF-1R expression in CD11b+CD33+CD14+HLA-DRhigh and CD11b+CD33+CD14+HLA-DR−/low myeloid cells in tumors of patients with melanoma and lung cancer, gating strategy for MDSCs and representative flow histograms for CSF-1R expression. (D) Frequency of total CD11b+CD33+CD14+HLA-DR−/low and CSF-1R-expressing CD11b+CD33+CD14+HLA-DR−/low cells in cell suspensions of CSF-1+ and CSF-1− tumors. (E) T cell suppression assay with CD14+HLA-DR−/low cells enriched from cell suspensions from tumors of melanoma and lung cancer patients and pre-incubated in vitro with αCSF-1R or IgG. Percent T cell proliferation and representative histograms in CD14+HLA-DR−/low to T cell ratios of 1:1. (F) MFI for HLA-ABC, HLA-DR and Arg1 expression in CD14+ cell cultures after treatment with αCSF-1R or IgG. Data are mean +/– SEM and represent 12 melanoma patients and 12 lung cancer patients (A–D), three melanoma patients and three lung cancer patients (E), and six lung cancer patients (F).
Immunosuppressive CSF-1R-expressing MDSCs infiltrating human tumors are reprogramed by CSF-1/CSF-1R signaling blockade
In order to understand the impact of CSF-1R signaling on MDSCs in human tumors, we compared the suppressive capacity of CD14+HLA-DR−/low cells following in vitro treatment with either fully human αCSF-1R antibody (CS4) or IgG. We found that CD14+HLA-DR−/low cells purified from patients showing high levels of CSF-1 and CSF-1R expression were able to suppress proliferation of autologous CD8+ T cells in vitro and this suppression was abolished by pre-incubation with αCSF-1R (). Furthermore, we observed upregulation of HLA class I (A/B/C) and HLA-DR, and decreased expression of Arg1 after in vitro treatment with αCSF-1R (). These data did not always reach statistical significance () due to a limited number of patient specimens available for analysis. Nonetheless, these results conceptually support our findings from murine tumor models and suggest that CSF-1R blockade reprograms MDSC to sustain antitumor activity.
CSF-1R blockade therapy alters the intratumoral myeloid response without increasing antitumor T cell activity
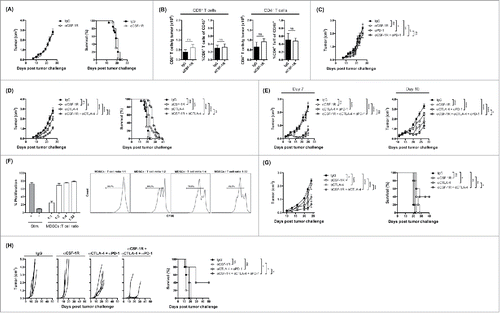
To further understand how blockade of CSF-1/CSF-1R signaling might alter the immune response to tumors, we assessed tumor growth and characterized tumor-infiltrating T cells following CSF-1R blockade in established 4T1 tumors. Mice bearing established (7 d, 150 mm3) 4T1 tumors were treated with αCSF-1R or IgG as control. Tumor growth and tumor-free survival was not changed by αCSF-1R treatment as a single agent (). Similarly, the number of CD8+ and CD4+ effector T cells was unaffected (). Thus, despite a significant reduction in tumor-infiltrating MO-MDSCs, αCSF-1R treatment alone did not affect tumor progression.
Figure 4. Antitumor effects of CSF-1/CSF-1R signaling blockade therapy as a single agent and in combinations with immune checkpoint blockade. (A) Average tumor growth and overall survival of 4T1 tumor-bearing mice treated with αCSF-1R. (B) Absolute number and frequency of CD8+ and CD4+ effector T cells in 4T1 tumors treated with αCSF-1R or IgG. (C) Tumor growth curves for 4T1 tumor-bearing mice treated with αCSF-1R and/or αPD-1. (D) Average tumor growth and tumor-free survival of 4T1 tumor-bearing mice treated with αCSF-1R and/or αCTLA-4. (E) Tumor growth curves for 4T1 tumor-bearing mice treated with αCSF-1R and/or αCTLA-4 + αPD-1 on day 7 or 10 post-tumor challenge. (F) T cell suppression by tumor-infiltrating MDSCs from CT26 tumor-bearing mice. Percent T cell proliferation in different MDSCs to T cell ratios as indicated and representative histograms. (G) Mean tumor growth and overall survival of CT26 tumor-bearing mice treated with αCSF-1R and/or αCTLA-4. (H) Individual tumor growth and overall survival of B16-IDO tumor-bearing mice treated with αCSF-1R and/or αCTLA-4 + αPD-1. Results are expressed as mean –/+ SEM.
CSF-1/CSF-1R signaling blockade enhances responses to CTLA-4 based immunotherapy
It has previously been demonstrated that CSF-1R blockade using small molecule inhibitors enhances tumor responses to T-cell-based immunotherapies in different tumor models Citation18,23 (Holmgaard et al. under review 2015). Based on the above observations, we assessed whether αCSF-1R could enhance the response of 4T1 tumors to immune checkpoint blockade. In order to test this, mice with established 4T1 tumors (7 d, 150 mm3) were treated with αCSF-1R plus PD-1 or CTLA-4 blocking antibodies. Combination of PD-1 blockade with αCSF-1R had no additional effect on tumor progression in established tumors compared to PD-1 monotherapy (). By contrast, the combination of CSF-1R blockade with CTLA-4 blockade delayed tumor progression and increased overall survival compared to single agents and differences were statistically significant (). Since combined blockade of PD-1 and CTLA-4 therapy has proven to have a high level of clinical activity,Citation29,30 we also investigated a triple combination approach, including αCSF1R. Addition of CSF1R blockade did not further reduce tumor growth in mice bearing established (7 d, 150 mm3) 4T1 tumors compared with CTLA-4 + PD-1 blockade (). However, progression of larger tumors (10 d, 300 mm3) was significantly delayed by αCSF-1R in combination with αPD-1 + αCTLA-4 ().
The combinatorial antitumor effect of CSF-1R and T cell checkpoint blockade therapy is observed in other tumor types
To determine whether the CSF-1R + CTLA-4 blockade treatment strategy could be extended to other tumor types, we used the CT26 colorectal tumor model. Similar to 4T1 tumors and human tumors, MO-MDSCs isolated from CT26 tumors are highly immunosuppressive in vitro (). In order to test the combination of dual CSF-1R inhibition and CTLA-4 blockade in this model, BALB/c mice were implanted with CT26 tumor cells and treated with αCSF-1R and/or αCTLA-4 when tumors exhibited a volume of approximately 100–150 mm3 (day 10). The combination therapy caused delayed tumor growth with prolonged survival in ∼40% of mice, whereas the individual components had modest to no effect on tumor growth and survival (). Moreover, we tested whether αCSF-1R could potentiate the antitumor efficacy of T cell checkpoint blockade in an aggressive IDO expressing melanoma tumor model. We have previously described that overexpression of IDO by B16 tumor cells (B16-IDO) promotes tumor recruitment of large numbers of highly suppressive MDSCs.Citation51 To this end, B16-IDO tumor-bearing mice were treated with αCSF-1R in combination with αPD-1 + αCTLA-4 antibodies. αCSF-1R alone had no effect on the progression of B16-IDO tumors (), while αPD-1 + αCTLA-4 checkpoint therapy alone had little efficacy on B16-IDO tumor growth and no effect on overall survival (). By contrast, the combination of αCSF-1R with αPD-1 + αCTLA-4 significantly reduced tumor progression and prolonged survival (). Thus, the therapeutic activity of the combination of αCSF-1R and T cell checkpoint blockade is not restricted to the 4T1 tumor model. These data using an antibody to block the CSF-1R, in melanoma, colon and breast cancer confirm previous findings with small molecule inhibitors of CSF-1R in a pancreatic tumor modelCitation18 and in the B16-IDO tumor model (Holmgaard et al., under review, 2015).
Timing of CSF-1R blockade therapy is critical in order for CTLA-4 blockade to induce effective antitumor immune responses
None of the treatments described above induced long-term effects or completely regressed aggressive 4T1 tumors. In an attempt to enhance the antitumor efficacy and induce long-term survival of CSF-1R + CTLA-4 blockade therapy, we sought to optimize the schedule of CTLA-4 and CSF-1R blockade as indicated in . Tumor-bearing mice were treated concurrently with three doses of αCSF-1R and αCTLA-4 followed by either αCSF-1R or αCTLA-4 or both throughout the experiment every 3 d as outlined in . All appropriate control groups have been included as well (). All three combination regimens delayed tumor growth significantly compared to controls (). However, when the group receiving one cycle of the combination (three doses of αCSF-1R + αCTLA-4) was compared to the groups receiving multiple cycles of the αCSF-1R + αCTLA-4 combination, we did not observe any significant differences in tumor growth delay (). Thus, the additional cycles of αCSF-1R + αCTLA-4 combination therapy did not result in better tumor regression or tumor delay.
Figure 5. Timing determines the efficacy of αCSF-1R + αCTLA-4 against 4T1 tumors (A) Treatment scheme and average tumor growth for 4T1 tumor-bearing mice treated with IgG (Group A), αCSF-1R (three initial doses) (Group B), αCSF-1R (continuous) (Group C), αCTLA-1 (three initial doses) (Group D), αCTLA-1 (continuous) (Group E), Concurrent αCSF-1R + αCTLA-4 (three initial doses) (Group F), Concurrent αCSF-1R + αCTLA-4 (continuous) (Group G), Sequential αCSF-1R +αCTLA-4 (three initial doses) and αCSF-1R (continuous) (Group H), and Sequential αCSF-1R +αCTLA-4 (three initial doses) and αCTLA-4 (continuous) (Group I). (B) Treatment scheme, average tumor growth and survival for 4T1 tumor-bearing mice treated with IgG (Group A), αCSF-1R (Group B), αCTLA4 (Group C), sequential αCSF-1R and αCSF-1R + αCTLA4 (Group D), sequential αCTLA-4 and αCSF-1R + αCTLA4 (Group E), or concurrent αCSF-1R + αCTLA4 (Group F). (C) Treatment scheme and average tumor growth for 4T1 tumor-bearing mice treated with IgG (Group A), sequential αCSF-1R and αCTLA4 (Group B), sequential αCTLA-4 and αCSF-1R (Group C), or concurrent αCSF-1R + αCTLA4 (Group D). Data are mean +/– SEM.
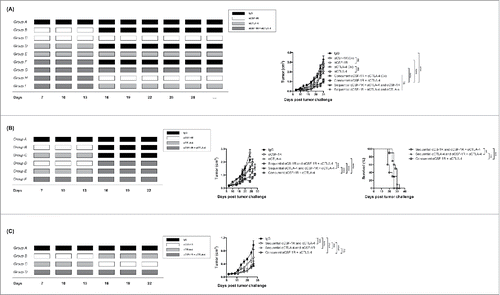
To further investigate the optimal timing for initiating αCSF-1R/αCTLA-4 combination therapy, we injected mice with 4T1 tumors cells, and treated with sequential αCSF-1R followed by αCSF-1R + αCTLA-4, sequential αCTLA-4 followed by αCSF-1R + αCTLA-4 or concurrent αCSF-1R + αCTLA-4 as delineated in . Concurrent treatment with αCSF-1R + αCTLA-4 resulted in markedly delayed tumor growth compared to the sequential treatments. However, the overall survival was not significantly different. Furthermore, we found that sequential αCTLA-4 followed by αCSF-1R + αCTLA-4 therapy reduced tumor growth more than sequential αCSF-1R followed by αCSF-1R + αCTLA-4 (), suggesting that timing of αCSF-1R and αCTLA-4 is important to induce optimal antitumor effects. To examine this further, mice were treated with sequential αCSF-1R followed by αCTLA-4, sequential αCTLA-4 followed by αCSF-1R or concurrent αCSF-1R + αCTLA-4 as shown in . Interestingly, the antitumor efficacy of sequential αCTLA-4 followed by αCSF-1R and concurrent αCSF-1R + αCTLA-4 were similar () and significantly better than sequential αCSF-1R followed by αCTLA-4 (). Together, these data indicate that αCSF-1R should be administered after or concurrent to αCTLA-4 therapy to obtain optimal antitumor responses
αCTLA-4 primes antitumor T-cell responses and activates MDSCs
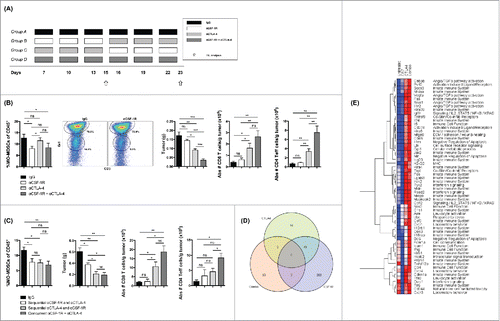
To delineate the mechanism underlying the above observations, we analyzed tumor infiltrates before and after treatment with αCSF-1R and/or αCTLA-4 (15 d post tumor challenge) as outlined in . The frequency of tumor-infiltrating MO-MDSCs was reduced significantly by αCSF-1R treatment alone (day 15) (). However, this was not associated with a significant decrease in tumor size or increase in number of T cells infiltrating the tumor (). The frequency of MO-MDSCs was also reduced significantly by the αCSF-1R + αCTLA-4 combination treatment (), and, importantly, this was associated with a decrease in tumor size and increase in both CD8+ and CD4+ T effector cells (Teff) in the tumor (). Although the MO-MDSC population was not affected by αCTLA-4 treatment alone (), αCTLA-4 treatment did cause a significant reduction in tumor size and increased T cell tumor-infiltration (). Next, we characterized tumor infiltrates after sequential or concurrent αCSF-1R and αCTLA-4 treatment (23 d post tumor challenge) (). At this time point, the frequency of tumor-infiltrating MO-MDSCs was reduced in all treated groups (). This was associated with a reduction in tumor growth in all treated groups (); however, the tumors in the groups treated with sequential αCTLA-4 followed by αCSF-1R or concurrent αCSF-1R + αCTLA-4 were significantly smaller than tumors in the group receiving sequential αCSF-1R followed by αCTLA-4 (). Notably, treatment with αCSF-1R followed by αCTLA-4 did not cause an increase in infiltrating CD8+ and CD4+ Teff cells in tumors (). Together these data show that αCSF-1R reduces tumor growth and enhances antitumor T cell responses only when administered after or concurrent with αCTLA-4.
Figure 6. The combination of αCTLA-4 and αCSF-1R modifies the tumor microenvironment and increases intra tumor inflammation. (A) 4T1 tumors were harvested on 15 (after treatment with αCSF-1R and/or αCTLA-4) and 23 (after sequential or concurrent treatment with αCSF-1R and αCTLA-4) post-tumor inoculation and analyzed for tumor-infiltrating immune cells. Treatment schedule for each group: Group A) IgG, Group B) Sequential αCSF-1R and αCTLA-4, Group C) Sequential αCTLA-4 and αCSF-1R, and Group D) Concurrent αCSF-1R + αCTLA-4. (B) Results for day 15: Frequency of CD11b+Ly6G−/lowLy6Chigh. MO-MDSCs of total CD45+ cells and representative dot plots, mean tumor weight, and absolute number of CD8+ T cells and CD4+ Teff cells per gram of tumor. (C) Results for day 23: Frequency of CD11b+Ly6G−/lowLy6Chigh. MO-MDSCs of total CD45+ cells, mean tumor weight, and absolute number of CD8+ T cells and CD4+ Teff cells per gram of tumor. (D–E) Data is derived from nanoString analysis using the 750 gene Mouse Immunology Panel. Differential gene expression using the Broad GenePattern “Comparative Marker Selection” tool identified a set of 200 genes down-regulated in CS7 versus control with p value < 0.05. These 200 were removed, leaving 550 genes, which were reanalyzed in Comparative Marker Selection using “one-versus-all” as a comparison mode. From this a total of 64 genes were found to be differentially expressed at the p value < 0.05 level, of which two were shared with CS7 and two with CTLA4, leaving 60 unique genes differentially expressed versus the aggregate of control, CS7, and CTLA4. Data are mean +/– SEM.
In order better understand how the concurrent combination of αCSF-1R and αCTLA-4 causes a superior response, we isolated tumors after mono or combination therapy and measured changes intra-tumor gene expression compared to control. Differential gene expression analysis using NanoString PanCancer Immune Profiling showed a significant reduction of over 200 genes after αCSF-1R monotherapy, correlating with a pronounced reduction of MO-MDSCs inside the tumor (data not shown). Because the contribution of reduced cell numbers to the gene expression could not be separated, we removed these genes from further analysis. Examining the remaining genes, using “one-versus-all” comparison, we performed differential gene analysis between the groups to determine what changes were present in the combination group. Using this method, a total of 64 genes were found to be differentially expressed of which two were shared with αCSF-1R and two with αCTLA-4, leaving 60 unique genes differentially expressed versus the aggregate of control, CS7 (αCSF-1R), and αCTLA-4 (). Examining these genes more closely showed that concurrent combination therapy causes a dramatic upregulation of an inflammatory gene signature in the tumor, including IFNγ, PD-L1 and an activation of IFN responsive genes (). In addition, many of the genes are in innate pathways that could be involved in monocyte function. As these genes don't appear to be upregulated after αCSF-1R monotherapy, our observation suggests that in combination could be altering the activity of remaining monocytes, resulting in greater activation of T cells.
To investigate this further, and to determine the function of MDSCs inside the tumor, we isolated MO-MDSCs before and after αCTLA-4 treatment and tested their suppressive capacity in vitro. Interestingly, MO-MDSCs from αCTLA-4 treated tumors were significantly more immunosuppressive than MO-MDSCs from day 7 untreated tumors (), possibly due to triggering of an inflammatory microenvironment. Furthermore, we observed that the expression of CSF-1R on MO-MDSCs was significantly upregulated after αCTLA-4 treatment in vivo and in vitro (). These data suggest that αCSF-1R enhances the activity of CTLA-4 blockade by blocking the feedback suppressive capacity of MO-MDSCs in the tumor microenvironment. We confirmed this, finding that in vitro treatment of tumor-infiltrating CD11b+ cells with αCSF-1R + αCTLA-4 lowered the number of MO-MDSCs within the cultures () and increased the expression level of MHC class II and the macrophage marker F4/80, but reduced expression of Arg1 in remaining cells (). The number of total CD11b+ myeloid cells did not change by addition of αCSF-1R + αCTLA-4 to the cultures (). In addition, MO-MDSCs purified from tumors of αCSF-1R + αCTLA-4 treated mice showed reduced ability to suppress CD8+ T cell proliferation in vitro () as well as increased expression of MHC class II (), compared to MO-MDSCs from αCTLA-4 treated mice. These findings are consistent with the reprogramming of MDSCs we demonstrated with αCSF-1R treatment alone in .
Figure 7. αCTLA-4 enhances the suppressive capacity of tumor-infiltrating MDSCs (A) Suppressive activity of MO-MDSCs purified from tumors of 4T1 tumor-bearing mice before (day 7 after tumor inoculation) or after treatment with αCTLA-4 (day 15). Percent CD8+ T cell proliferation and representative histograms of CD8+ T cell proliferation in MDSC to CD8+ T cell ratios of 1:1. (B) CSF-1R expression by MFI in purified MO-MDSCs after in vivo or in vitro treatment with IgG or αCTLA-4. (C) Number of total CD11b+ cells and MO-MDSCs after in vitro culture of CD11b+ cells purified from 4T1 tumors with IgG or αCSF-1R + αCTLA-4. (D) Arg1, MHC class II and F4/80 expression by MFI in purified MO-MDSCs after in vitro culture with IgG or αCSF-1R + αCTLA-4. (E) CD8+ T cell suppression by MO-MDSCs from αCSF-1R + αCTLA-4 or αCTLA-4 treated 4T1 tumor-bearing mice. MO-MDSCs were purified by FACS and assayed for their ability to suppress CD8+ T cell proliferation following CD3/CD28 and IL-2 stimulation. Percent CD8+ T cell proliferation in different MO-MDSCs to CD8+ T cell ratios as indicated and representative histograms of CD8+ T cell proliferation in MDSC to CD8+ T cell ratios of 1:1. (F) MHC class II expression by MFI in purified MO-MDSCs from αCSF-1R + αCTLA-4 or αCTLA-4 treated 4T1 tumor-bearing mice. (G) MFI and fold change in CSF-1R expression in CD11b+CD33+CD14+HLA-DR−/low myeloid cells from PBMCs of human melanoma patients at baseline (Time Point A) and post (Time Point B and C) CTLA4 blockade immunotherapy, and representative histograms. (H) Expression of CSF-1 in PBMCs from human melanoma patients at baseline (Time Point A) and post (Time Point B and C) CTLA4 blockade immunotherapy. (I) MFI and fold change in Arg1 in CD11b+CD33+CD14+HLA-DR−/low myeloid cells from PBMCs of human melanoma patients at baseline (Time Point A) and post (Time Point B and C) CTLA4 blockade immunotherapy. Data are mean +/– SEM (A-F) and represents six patients (G–I).
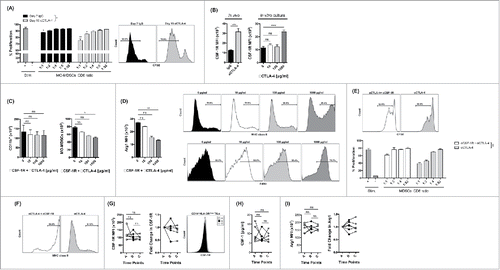
In order to investigate the potential clinical relevance of these findings we characterized MDSCs from patients treated with ant-CTLA4 (ipilimumab). We found that MDSCs from PBMC samples of melanoma patients obtained after the patients received CTLA-4 blockade with ipilimumab also showed expression of CSF-1R (). Similarly, these PBMC samples showed detectable levels of CSF-1 (). Finally, the MDSCs showed Arg1 expression, indicating that the MDSCs are activated (). These data suggest that CTLA-4 blockade immunotherapy does not decrease CSF-1R/CSF-1 expression levels or functional properties of MDSCs in melanoma patients and that combination with CSF-1R/CSF-1 blockade might be beneficial in anti-CTLA-4 and anti-CTLA-4/PD-1 blockade treatment regimens.
Discussion
Even though T cell checkpoint immunotherapies have achieved impressive clinical benefits in some cancers, particularly melanoma,Citation31,32 their application as single agents is still not inducing clinical response in the majority of patients with solid tumors.Citation1-4 This is potentially due to the unique immunosuppressive microenvironment in many tumors. Tumor-infiltrating suppressive myeloid cells have been demonstrated to be a critical component of the inhibitory tumor microenvironment and thus, therapeutic strategies that reprogram dominant myeloid responses may allow effective T cell checkpoint therapy.
Data from several preclinical studies suggest that inhibition of CSF-1R signaling may alter the immunologic responses of tumor-infiltrating myeloid cells (Holmgaard et al., in review 2015).Citation16,18,22,23,25,33-36 Early studies demonstrated a critical role of CSF-1R on tumor-associated macrophage (TAM) infiltration of spontaneous murine breast tumors and human breast cancer xenografts. These studies showed reduced angiogenesis and delayed tumor progression to metastasis upon depletion or inhibition of CSF-1R-expressing TAMs.Citation11,37 Similarly, it has been demonstrated that depletion of CSF-1R-expressing TAMs in murine tumor models sensitizes tumors to adoptively transferred T cell based therapies,Citation23 chemotherapy Citation33 and radiation.Citation22 More recently, CSF-1R expression was observed on MDSCs.Citation38,39 Studies have demonstrated that CSR-1R signaling regulate tumor recruitment of both MDSCs and TAMs.Citation16,22 We also showed that targeting CSF-1R signaling using PLX647 in a murine IDO-expressing melanoma model (B16-IDO) depleted more than 65% of tumor-infiltrating MDSCs, leading to delayed tumor progression and increased efficacy of immunotherapies targeting CTLA-4, PD-1 and IDO (Holmgaard et al. under review, 2015). In the study presented here, we find that blockade of CSF-1/CSF-1R signaling in murine breast tumors with an anti-CSF-1R antibody also targets the more abundant MDSCs rather than macrophages, supporting our previous findings in melanoma. The role of CSF-1 may be tumor model-dependent as distinct myeloid subsets dominate in different tumor models. Some tumor models are more infiltrated with and more dependent on MDSCs,Citation22,40,51 whereas others have few MDSCs and are primarily dominated by macrophages.Citation23,34
Recruitment and differentiation of myeloid cells in tumors are complex processes regulated by multiple pathways, which may lead to differential responses to CSF-1R inhibition.Citation10,41-43 Several studies have shown that CSF-1/CSF-1R signaling blockade using antibodies or small molecule inhibitors directed against CSF-1R promotes tumor regression, yet the exact mechanism by which this happens is unknown. While some studies have shown that CSF-1R inhibition reduces the number of TAM/myeloid cells,Citation16,18,23 others have shown that CSF-1R blockade favorably reprograms TAM/myeloid responses without reducing their numbers.Citation34 Here, we show that blockade of CSF-1/CSF-1R signaling in murine breast tumors not only reduces the number of tumor-infiltrating MDSCs but also reprograms the remaining MDSCs to support antitumor immunity. Importantly, we saw a similar alteration of MDSCs toward an antitumor phenotype in melanoma and lung cancer patients upon blockade of CSF-1/CSF-1R signaling in vitro. These results suggest that CSF-1R signaling can regulate both the number and function of tumor-infiltrating myeloid cells. These activities may however be dependent on the tumor type or cytokine milieu within the tumor microenvironment. The exact mechanism by which CSF-1R blockade reprograms the remaining myeloid cells is unknown. CSF-1R signaling may promote a pro-tumor myeloid phenotype, while its blockade leads to an antitumor phenotype. Cytokines within the tumor microenvironment may differentially program myeloid cells to play diverse roles. To this end, it has been demonstrated that CSF-1 and CSF-2 induce different phenotypic changes in macrophages in vitro.Citation44 This study showed that macrophages cultured in CSF-2 preferentially produced pro-inflammatory cytokines, whereas macrophages cultured in CSF-1 produced anti-inflammatory cytokines. These observations suggest that if tumors produce high levels of CSF-2, blockade of CSF-1R signaling may reprogram myeloid cells toward an antigen-presenting phenotype. CSF-2 is produced by many cancer cell types, including breast, colon and prostate cancer.Citation45-48 Along these lines, it has been demonstrated that the TGFβ inhibitor, SM16, acts to inhibit its kinase activity and, in turn, skews unfavorable MDSCs to become tumoricidal myeloid cells.Citation9 The SHP1 inhibitor, NSC87877, can similarly shift the activity of MDSCs,Citation49 resulting in reduced tumor growth. The exact mechanism by which these pathways regulate MDSC polarization remains unclear.
In addition to reprograming myeloid cells, CSF-1R signaling blockade may select for a subset of tumor-restraining myeloid cells that are insensitive to the CSF-1 signal. MDSCs are composed of heterogeneous subsets with distinct functions,Citation7 and consequently, different factors may be required for their survival, proliferation, and effector functions. Thus, selection pressure due to CSF-1R blockade may have enriched for subsets of antitumor myeloid cells in the tumor tissue that are less dependent on CSF-1 signaling for their survival and eliminated the myeloid cells with a more suppressive phenotype. Our data demonstrate that myeloid cells remaining after anti-CSF-1R antibody treatment in vitro and in vivo show significantly lower CSF-1R expression levels, indicating that CSF-1Rhigh MDSCs were preferentially eliminated. These data could imply that certain subsets of MDSCs are more dependent on the CSF-1 signal than others.
The anti-CSF-1R antibody therapy alone failed to enhance T cell infiltration and delay tumor progression. However, addition of anti-CSF-1R antibody markedly improved the efficacy of CTLA-4 checkpoint blockade in both breast and colon tumor models, and slowed progression of more established breast tumors and IDO-expressing melanoma tumors when combined with CTLA-4 + PD-1 blockade. Similar antitumor effects have recently been described using small molecule inhibitors of CSF-1R in murine models of melanoma and pancreatic cancer (Holmgaard et al., under review, 2015).Citation18 In this study, we further show that therapeutic effect of CSF-1R blockade is highly dependent on the timing of the therapy. Perhaps not surprisingly, we find that anti-CSF-1R antibody therapy is effective only when the CSF-1R expressing cells that show immunosuppressive functions are highly present in the tumor microenvironment. Furthermore, our data indicate that T cells infiltrating the tumor (possibly induced CTLA-4 blockade) may activate CSF-1R-expressing myeloid cells to become suppressive. These observations suggest that reprogramming MDSC responses via CSF-1/CSF-1R blockade could improve antitumor responses in patients previously treated with CTLA-4 blockade (or CTLA-4 + PD-1 blockade) or treated concurrently with CTLA-4 and CSF-1/CSF-1R blockade. Supporting these findings, we find that the CSF-1R is indeed expressed in MDSCs from melanoma patients after CTLA-4 blockade immunotherapy with ipilimumab.
Finally, tumor expression of CSF-1 was correlated with increased tumor infiltration of MDSCs in patients with metastatic melanoma and lung cancer, and the majority of these MDSCs were CSF-1R positive, further highlighting the importance of CSF-1/CSF-1R signaling in the recruitment and function of tumor-infiltrating myeloid cells, including MDSCs, in human tumors.
In summary, our findings suggest that CSF-1/CSF-1R signaling blockade may be an effective therapeutic target to reprogram the immunosuppressive tumor microenvironment, and validate the benefits of targeting CSF-1R signaling in combination with T cell checkpoint blockade. However the timing of the combination therapy and the pre-existing tumor microenvironment are critical suggesting that the treatment of cancers patients with CSF-1/CSF-1R signaling blockade and check point blockade should follow a rationally designed treatment plan and tailored to patient with specific pre-existing intra-tumor immune landscape.
Methods
Mice
BALB/c and C57BL/6J mice (6–8 weeks old) were purchased from Jackson Laboratory. Mice were treated in accordance with the NIH and American Association of Laboratory Animal Care regulations. All mouse procedures and experiments were approved by the MSKCC Institutional Animal Care and Use Committee.
Cell lines
The murine cancer cell lines for breast cancer (4T1), colon cancer (CT26) and melanoma (B16-IDO) were maintained in RPMI medium supplemented with 10% fetal calf serum (FCS) and penicillin with streptomycin. B16-IDO was generated by transduction of B16F10 with GFP plus the IDO gene as previously described.Citation50
Tumor challenge and treatment experiments
On day 0 of the experiments, tumors were implanted by injection of tumor cells in the right flank intradermally (i.d.). For the 4T1 tumor model, 5 × 10⁵ tumor cells were injected and treatment was initiated on day 7 or 10, post tumor inoculation as indicated. For the CT26 tumor model, 5 × 10⁵ tumor cells were injected and treatment was initiated on day 10, post tumor inoculation. For the B16-IDO tumor model, 2.5 × 10⁵ tumor cells were injected and treatment was initiated on day 3, post tumor inoculation. Treatment was given according to the following regimen for each drug: Anti-CTLA-4 antibody (100 ug/mouse, clone 9H10, BioXcell), anti-PD-1 antibody (250 ug/mouse, clone RPM1-14, BioXcell) and anti-CSF-1R antibody (40 mg/kg, CS7, Eli Lilly and Company) were injected intraperitoneal (i.p.) every 3 d as indicated. Control groups received a corresponding dose of isotype antibody. The animals were euthanized for signs of distress.
Isolation of tumor-infiltrating cells and lymphoid tissue cells
Tumor samples were finely chopped and treated with 1.67 U/mL Liberase (Roche) and 0.2 mg/mL DNase (Roche) in RPMI for 30 min at 37°C. Tumor samples were then mashed through a 100-μm cell strainer (BD Biosciences) to generate single-cell suspensions in RPMI supplemented with 7.5% FCS. Cells from spleens and LNs were isolated by grinding through 100-μm filters. After red blood cell (RBC) lysis (ACK Lysing Buffer, Lonza) when required, all samples were washed and re-suspended in FACS buffer (PBS/2%FCS).
Flow cytometry and morphology analysis
Cells isolated from mouse tumors, spleens and LNs were pre-incubated (15 min, 4°C) with anti-CD16/32 monoclonal antibody (Fc block, clone 2.4G, BD Biosciences) to block unspecific binding and then stained (30 min, 4°C) with appropriate dilutions of various combinations of the following fluorochrome-conjugated antibodies: anti-CD3-eFluor 450 (clone 17A2), anti-MHC Class II-eFluor 450 (clone M5/114.15.2), anti-CSF-1R-PE (clone AFS98), anti-CD8-PE Texas Red (clone 5H10), anti-Gr1-PerCP-Cy5.5 (clone R86-8C5), anti-CD4-PE-Cy7 (clone RM4-5), anti-CD45-APC (clone 104), anti-F4/80-APC (clone BM8), anti-CD11c-Alexa Fluor 700 (clone N418), and anti-CD11b-APC eFluor 780 (clone M1/70) antibodies, all purchased from BD Biosciences, eBioscience or Invitrogen. The cells were further permeabilized using FoxP3 Fixation and Permeabilization Kit (eBioscience) and stained for Foxp3 (clone FJK-16s, Alexa-Fluor-700-conjugated, eBioscience). The stained cells were acquired on a LSRII Flow Cytometer using BD FACSDiva software (BD Biosciences) and the data were processed using FlowJo software (Treestar).
Purification of MDSCs
Mouse tumor single-cell suspensions were generated as described in the previous section. Tumor cells were subsequently separated from debris over a Ficoll gradient (Sigma-Aldrich). Cells were stained with anti-CD45.2-Alexa-Fluor-700, anti-CD11b-APC-Cy7 and anti-Gr1-PerCP-Cy5.5 antibodies for flow sorting on a FACSAria™ II Cell Sorter (BD Biosciences). Dead cells were excluded using DAPI (Invitrogen). Purity of flow-sorted populations was above 90%.
In vitro culture of MDSCs with anti-CSF-1R antibody
Purified MDSCs were cultured in complete RPMI media supplemented with 0.05 M β-mercaptoethanol with or without anti-CSF-1R antibody (CS7 (Rat anti-mouse CSF-1R) or CS4 (fully human anti-human CSF-1R) supplied by Eli Lilly and Company), at indicated concentrations. One day later, cells were collected and tested for expression of various surface markers by flow cytometry, in T cell suppression assays or RT-PCR as described.
T cell suppression assay with MDSCs
Spleens and lymph nodes from naive mice were isolated and grinded through 100-μm filters to generate a single cell suspension. After RBC lysis, CD8+ cells were purified using anti-CD8+ (Ly-2) microbeads (Miltenyi Biotech) according to manufacturer's protocol and labeled with 1 mM CFSE (Invitrogen) in pre-warmed PBS for 10 min at 37°C. The CFSE-labeled CD8+ T cells were then plated in complete RPMI media supplemented with 0.05 M β-mercaptoethanol and 50 U/mL IL-2 onto round bottom 96-well plates (1 × 10⁵ cells per well) coated with 1 μg/mL anti-CD3 (clone 1454–2C11) and 5 μg/mL anti-CD28 (clone 37N) antibodies. Purified MDSCs were added in indicated ratios and plates were incubated at 37°C. After 72 h, cells were harvested and CFSE signal in the gated CD8+ T cells was measured by flow cytometry (LSRII flow cytometer, BD Biosciences). Controls were wells without CD11b+ cells (Stim+) and wells without CD11b+ cells and anti-CD3/CD28 antibody (Stim-).
Taqman gene expression analysis
RNA from MDSC cultures was isolated using the RNeasy kit (QIAGEN). cDNA was then produced from RNA using the Superscript II Reverse Transcription kit (Invitrogen). Relative gene expression was then determined using the ABI 7500 RT-PCR System using VIC- and FAM-conjugated primer probes (Applied Biosystems). Primers for amino acids, synthases, cytokines and receptors presented here included Arg1, TGFβ and IFNγ. hprt was used as the endogenous control. Relative gene expression was calculated using Taqman primers by the ΔΔCt method.
RNA extraction and nanostring
Total RNA was extracted using MagMax-96 Total RNA Isolation Kit (Thermo Fisher Scientific) following manufacturer's protocol. RNA was quantitated using spectrophotometry BioTEk Synergy 2. 100 ug of RNA was used to determine gene expression levels using the Nanostring nCounter system (Nanosting Technologies). nCounter Mouse PanCancer Immune Profiling Panel was used to evaluate the RNA. The total RNA was hybridized to the custom codesets at 65°C overnight (15.5 to 22.5 h). The reaction was processed on the nCounter™ Prep Station and gene expression data was then acquired on the nCounter™ Digital Analyzer at the “high resolution” setting.
Differential Gene Expression analysis was conducted using the Broad Institute GenePattern version 3.9.1.Citation52 The specific GenePattern modules used were: a) ComparativeMarkerSelection version 10 using a “phenotype test” of “one versus all” and default settings (including 2-sided T-Test) for all other parameters; b) HierarchicalClustering version 6 using Pearson correlation for row clustering, log-transforming the data before clustering, and default settings for all other parameters.
Patient material
Patient samples were collected on a tissue-collection protocol approved by the Institutional Review Board. Surgical specimens from patients with metastatic melanoma or lung cancer were processed within 3 h. Single-cell suspensions were prepared using the human tumor dissociation kit (Miltenyi Biotec) according to the manufacturer protocol. Briefly cells were obtained by mincing the tumors into small pieces (1 mm3) and dissociated using enzymatic digestion with 1 h incubation at 37°C with constant shaking in gentleMACS™ Octo Dissociator. Cell viability was assessed by trypan blue exclusion. Cells were frozen at a concentration of 5 × 10⁶/mL in 90% FBS with 10% DMSO until experiments were performed.
Whole blood was drawn in cell preparation tubes (CPT) containing sodium heparin (BD Vacutainer). Peripheral blood mononuclear cells (PBMCs) were isolated from whole blood by centrifuging the CPT tubes at 800 g for 25 min. The plasma was collected and retained for other experiments. The interface cells were harvested and washed twice with PBS with 10% FCS at 500 g and 450 g for 10 min, respectively. PBMCs were then resuspended in complete RPMI 1640 with 10% autologous plasma or PHS. For cryopreservation, PBMCs were resuspended in FCS with 10% dimethylsulfoxide (DMSO) (Sigma-Aldrich, St. Louis, MO), frozen at −80°C for 2–3 d and then stored in liquid nitrogen until tested. Patients received ipilimumab at either 0.3 mg/kg (n = 1), 3 mg/kg (n = 4), or 10 mg/kg (n = 65) every 3 weeks for four treatments. PBMCs were collected on the day of dosing. Time Point A PBMCs were collected on the day of the first dose before injection and defines baseline, i.e. pre-treatment PBMCs. Time Point B and C PBMCs were collected on the day of the second and third dose, respectively, and defines PBMCs after one and two doses of ipilimumab.
In vitro cultures of human myeloid cells with anti-CSF-1R antibody
Cell suspensions were generated from human tumors as described above. CD14+ cells were positively selected from patient TIL samples by lymphoprep isolation (Sigma-Aldrich) and MACS separation (Miltenyi Biotec) according to manufacturer's recommendations. Purified CD14+ cells were cultured in complete RPMI media supplemented with 0.05 M β-mercaptoethanol with or without 100 μg/mL fully human anti-CSF-1R antibody (CS4, Eli Lilly and Company). One day later, cells were collected and stained with anti-CD14-eFlour450 (clone M5E2), anti-HLA-ABC-FITC, anti-CSF-1R-PE (Clone 9-4D2-1E4), anti-HLA-DR-PE Texas Red (clone G46-6), anti-CD11b-PerCP-Cy5.5 (clone M1/70), anti-CD33-PE-Cy7 (clone P67.6), and anti-CD45-APC eFluor 780 (clone 2D1) antibodies, all purchased from BD Biosciences, eBioscience or Invitrogen. The cells were further permeabilized using FoxP3 Fixation and Permeabilization Kit (eBioscience) and stained for Arginase (APC-conjugated, R&D Systems) or with matched isotype control antibody.
T cell suppression assay with human myeloid cells
T cell suppression assays were performed as described previously (Holmgaard et al., in press, 2015). Briefly, CD45+ cells were positively selected from patient PBMC or TIL samples by lymphoprep isolation (Sigma-Aldrich) and MACS separation (Miltenyi Biotec) according to manufacturer's recommendations. HLA-DR−/lowCD14+ effector cells were obtained first by depleting HLA-DR+ cells followed by enrichment of CD14+ cells from the HLA-DR−/low fraction, using antibody labeled microbeads (Miltenyi Biotec). Purity of enriched cell populations was assessed by flow cytometry using antibodies for HLA-DR and CD14 (eBiosciences) and LIVE/DEAD Fixable Aqua Dead Cell Stain-Amcyan (Invitrogen). The target cell population was obtained by CD14+ depletion (Miltenyi Biotec). Target cells were labeled with CFSE as described above, and resuspended in complete RPMI media supplemented with 0.05 M β-mercaptoethanol and 50 U/mL IL-2. Target cells were plated onto round bottom 96-well plates (5 × 10⁴ cells per well) coated with 5 μg/mL anti-CD3 (clone OKT3), and CD14+HLA-DR−/low cells were added at effector to target ratio 1:1. The plate was incubated for 6 d at 37°C. Proliferation was assessed by flow cytometry using antibodies for CD8+(eBioscience). When indicated CD14+HLA-DR−/low cells were pre-incubated withfully human anti-CSF-1R antibody (CS4, Eli Lilly and Company) for 4 h at 4°C, before they were added to the plates.
CSF-1 expression in patient samples
PBMCs or tumor cell suspensions were washed and plated in 48 well plates in triplicates in 400 uL complete RPMI media supplemented with 0.05 M β-mercaptoethanol. Plates were incubated for 48 h at 37°C. After culture for the required period of time, the culture supernatants were aspirated and centrifuged to remove cells and debris. Subsequently, supernatants were analyzed for CSF-1 concentrations by ELISA, according to the manufacturer's instructions (Sigma-Aldrich).
CSF-1R expression in patient samples
PBMCs or tumor cell suspensions were washed and stained with anti-CD14-eFlour450 (clone M5E2), anti-HLA-ABC-FITC (clone W6/32), anti-CSF-1R-PE (Clone 9-4D2-1E4), anti-HLA-DR-PE Texas Red (clone G46-6), anti-CD11b-PerCP-Cy5.5 (clone M1/70), anti-CD33-PE-Cy7 (clone P67.6), and anti-CD45-APC eFluor 780 (clone 2D1) antibodies (eBioscience and BD Bioscience) for phenotypic analysis. The stained cells were acquired on a LSRII Flow Cytometer using BD FACSDiva software (BD Biosciences) and the data were processed using FlowJo software (Treestar). Dead cells and doublets were excluded on the basis of forward and side scatter.
Statistics
Where indicated, data were analyzed for statistical significance and reported as p values. Data were analyzed by 2-tailed Student's t test when comparing means of two independent groups and two-way ANOVA when comparing more than two groups. p < 0.05 was considered statistically significant (*p < 0.05, **p < 0.01, ***p < 0.001, ****p < 0.0001). Evaluation of survival patterns in tumor-bearing mice was performed by the Kaplan–Meier method, and results were ranked according to the Mantel-Cox Log-Rank test. p < 0.05 was considered statistically significant (*p < 0.05, **p < 0.01, ***p < 0.001, ****p < 0.0001). Survival was defined as mice with tumors < 1.000 cm3.
Disclosure of potential conflicts of interest
No potential conflicts of interest were disclosed.
Acknowledgments
We would like to thank Eli Lilly for proving anti-CSF-1R antibodies for the studies. Further, we thank Hong Zhong (Memorial Sloan Kettering Cancer Center) for technical assistance. In addition, we thank the Flow Cytometry Facility at Memorial Sloan Kettering Cancer Center.
Funding
This work was supported by the Swim across America, Ludwig Institute for Cancer Research, Breast Cancer Research Foundation, National Cancer Institute grants R01 CA56821 and the Lita Annenberg Hazen Foundation. RBH is the recipient of postdoctoral fellowships through The Danish Cancer Society and The Carlsberg Foundation, Denmark. This research was also funded in part through the NIH/NCI Cancer Center Support Grant P30 CA008748 and U54 OD020355-01.
References
- Royal RE, Levy C, Turner K, Mathur A, Hughes M, Kammula US, Sherry RM, Topalian SL, Yang JC, Lowy I, Rosenberg SA. Phase 2 trial of single agent Ipilimumab (anti-CTLA-4) for locally advanced or metastatic pancreatic adenocarcinoma. J Immunother (2010); 33(8):828-33; PMID:20842054; http://dx.doi.org/10.1097/CJI.0b013e3181eec14c
- Le DT, Lutz E, Uram JN, Sugar EA, Onners B, Solt S, Zheng L, Diaz LA Jr, Donehower RC, Jaffee EM et al. Evaluation of ipilimumab in combination with allogeneic pancreatic tumor cells transfected with a GM-CSF gene in previously treated pancreatic cancer. J Immunother (2013); 36(7):382-9; PMID:23924790; http://dx.doi.org/10.1097/CJI.0b013e31829fb7a2
- Hodi FS, O'Day SJ, McDermott DF, Weber RW, Sosman JA, Haanen JB, Gonzalez R, Robert C, Schadendorf D, Hassel JC et al. Improved survival with ipilimumab in patients with metastatic melanoma. N Engl J Med (2010); 363(8):711-23; PMID:20525992; http://dx.doi.org/10.1056/NEJMoa1003466
- Robert C, Thomas L, Bondarenko I, O'Day S, Weber J, Garbe C, Lebbe C, Baurain JF, Testori A, Grob JJ et al. Ipilimumab plus dacarbazine for previously untreated metastatic melanoma. N Engl J Med (2011); 364(26):2517-26; PMID:21639810; http://dx.doi.org/10.1056/NEJMoa1104621
- Phan GQ, Yang JC, Sherry RM, Hwu P, Topalian SL, Schwartzentruber DJ, Restifo NP, Haworth LR, Seipp CA, Freezer LJ et al. Cancer regression and autoimmunity induced by cytotoxic T lymphocyte-associated antigen 4 blockade in patients with metastatic melanoma. Proc Natl Acad Sci U S A (2003); 100(14):8372-7; PMID:12826605; http://dx.doi.org/10.1073/pnas.1533209100
- Hodi FS, Mihm MC, Soiffer RJ, Haluska FG, Butler M, Seiden MV, Davis T, Henry-Spires R, MacRae S, Willman A et al. Biologic activity of cytotoxic T lymphocyte-associated antigen 4 antibody blockade in previously vaccinated metastatic melanoma and ovarian carcinoma patients. Proc Natl Acad Sci U S A (2003); 100(8):4712-7; PMID:12682289; http://dx.doi.org/10.1073/pnas.0830997100
- Gabrilovich DI, Nagaraj S. Myeloid-derived suppressor cells as regulators of the immune system. Nat Rev Immunol (2009); 9(3):162-74; PMID:19197294; http://dx.doi.org/10.1038/nri2506
- Youn JI, Nagaraj S, Collazo M, Gabrilovich DI. Subsets of myeloid-derived suppressor cells in tumor-bearing mice. J Immunol (2008); 181(8):5791-802; PMID:18832739; http://dx.doi.org/10.4049/jimmunol.181.8.5791
- Umemura N, Saio M, Suwa T, Kitoh Y, Bai J, Nonaka K, Ouyang GF, Okada M, Balazs M, Adany R et al. Tumor-infiltrating myeloid-derived suppressor cells are pleiotropic-inflamed monocytes/macrophages that bear M1- and M2-type characteristics. J Leukoc Biol (2008); 83(5):1136-44; PMID:18285406; http://dx.doi.org/10.1189/jlb.0907611
- Sawanobori Y, Ueha S, Kurachi M, Shimaoka T, Talmadge JE, Abe J, Shono Y, Kitabatake M, Kakimi K, Mukaida N et al. Chemokine-mediated rapid turnover of myeloid-derived suppressor cells in tumor-bearing mice. Blood (2008); 111(12):5457-66; PMID:18375791; http://dx.doi.org/10.1182/blood-2008-01-136895
- Lin EY, Nguyen AV, Russell RG, Pollard JW. Colony-stimulating factor 1 promotes progression of mammary tumors to malignancy. J Exp Med (2001); 193(6):727-40; PMID:11257139; http://dx.doi.org/10.1084/jem.193.6.727
- Dai XM, Ryan GR, Hapel AJ, Dominguez MG, Russell RG, Kapp S, Sylvestre V, Stanley ER. Targeted disruption of the mouse colony-stimulating factor 1 receptor gene results in osteopetrosis, mononuclear phagocyte deficiency, increased primitive progenitor cell frequencies, and reproductive defects. Blood (2002); 99(1):111-20; PMID:11756160; http://dx.doi.org/10.1182/blood.V99.1.111
- Li F, Xiang Y, Potter J, Dinavahi R, Dang CV, Lee LA. Conditional deletion of c-myc does not impair liver regeneration. Cancer Res (2006); 66(11):5608-12; PMID:16740696; http://dx.doi.org/10.1158/0008-5472.CAN-05-4242
- Richardsen E, Uglehus RD, Johnsen SH, Busund LT, Macrophage-Colony Stimulating Factor (CSF1) Predicts Breast Cancer Progression and Mortality. Anticancer research (2015); 35(2):865-74; PMID:25667468
- Zhu XD, Zhang JB, Zhuang PY, Zhu HG, Zhang W, Xiong YQ, Wu WZ, Wang L, Tang ZY, Sun HC. High expression of macrophage colony-stimulating factor in peritumoral liver tissue is associated with poor survival after curative resection of hepatocellular carcinoma. J Clin Oncol (2008); 26(16):2707-16; PMID:18509183; http://dx.doi.org/10.1200/JCO.2007.15.6521
- Priceman SJ, Sung JL, Shaposhnik Z, Burton JB, Torres-Collado AX, Moughon DL, Johnson M, Lusis AJ, Cohen DA, Iruela-Arispe ML et al. Targeting distinct tumor-infiltrating myeloid cells by inhibiting CSF-1 receptor: combating tumor evasion of antiangiogenic therapy. Blood (2010); 115(7):1461-71; PMID:20008303; http://dx.doi.org/10.1182/blood-2009-08-237412
- Tarhini AA, Butterfield LH, Shuai Y, Gooding WE, Kalinski P, Kirkwood JM. Differing patterns of circulating regulatory T cells and myeloid-derived suppressor cells in metastatic melanoma patients receiving anti-CTLA4 antibody and interferon-alpha or TLR-9 agonist and GM-CSF with peptide vaccination. J Immunother (2012); 35(9):702-10; PMID:23090079; http://dx.doi.org/10.1097/CJI.0b013e318272569b
- Zhu Y, Knolhoff BL, Meyer MA, Nywening TM, West BL, Luo J, Wang-Gillam A, Goedegebuure SP, Linehan DC, DeNardo DG. CSF1/CSF1R blockade reprograms tumor-infiltrating macrophages and improves response to T-cell checkpoint immunotherapy in pancreatic cancer models. Cancer Res (2014); 74(18):5057-69; PMID:25082815; http://dx.doi.org/10.1158/0008-5472.CAN-13-3723
- Manthey CL, Johnson DL, Illig CR, Tuman RW, Zhou Z, Baker JF, Chaikin MA, Donatelli RR, Franks CF, Zeng L et al. JNJ-28312141, a novel orally active colony-stimulating factor-1 receptor/FMS-related receptor tyrosine kinase-3 receptor tyrosine kinase inhibitor with potential utility in solid tumors, bone metastases, and acute myeloid leukemia. Mol Cancer Ther (2009); 8(11):3151-61; PMID:19887542; http://dx.doi.org/10.1158/1535-7163.MCT-09-0255
- Patel S, Player MR. Colony-stimulating factor-1 receptor inhibitors for the treatment of cancer and inflammatory disease. Current topics in medicinal chemistry (2009); 9(7):599-610; PMID:19689368; http://dx.doi.org/10.2174/156802609789007327
- Chitu V, Nacu V, Charles JF, Henne WM, McMahon HT, Nandi S, Ketchum H, Harris R, Nakamura MC, Stanley ER. PSTPIP2 deficiency in mice causes osteopenia and increased differentiation of multipotent myeloid precursors into osteoclasts. Blood (2012); 120(15):3126-35; PMID:22923495; http://dx.doi.org/10.1182/blood-2012-04-425595
- Xu J, Escamilla J, Mok S, David J, Priceman S, West B, Bollag G, McBride W, Wu L. CSF1R signaling blockade stanches tumor-infiltrating myeloid cells and improves the efficacy of radiotherapy in prostate cancer. Cancer Res (2013); 73(9):2782-94; PMID:23418320; http://dx.doi.org/10.1158/0008-5472.CAN-12-3981
- Mok S, Koya RC, Tsui C, Xu J, Robert L, Wu L, Graeber TG, West BL, Bollag G, Ribas A. Inhibition of CSF-1 receptor improves the antitumor efficacy of adoptive cell transfer immunotherapy. Cancer Res (2014); 74(1):153-61; PMID:24247719; http://dx.doi.org/10.1158/0008-5472.CAN-13-1816
- Coniglio SJ, Eugenin E, Dobrenis K, Stanley ER, West BL, Symons MH, Segall JE. Microglial stimulation of glioblastoma invasion involves epidermal growth factor receptor (EGFR) and colony stimulating factor 1 receptor (CSF-1R) signaling. Mol Med (2012); 18:519-27; PMID:22294205; http://dx.doi.org/10.2119/molmed.2011.00217
- DeNardo DG, Brennan DJ, Rexhepaj E, Ruffell B, Shiao SL, Madden SF, Gallagher WM, Wadhwani N, Keil SD, Junaid SA et al. Leukocyte complexity predicts breast cancer survival and functionally regulates response to chemotherapy. Cancer Discov (2011); 1(1):54-67; PMID:22039576; http://dx.doi.org/10.1158/2159-8274.CD-10-0028
- Ries CH, Hoves S, Cannarile MA, Ruttinger D. CSF-1/CSF-1R targeting agents in clinical development for cancer therapy. Curr Opin Pharmacol (2015); 23:45-51; PMID:26051995; http://dx.doi.org/10.1016/j.coph.2015.05.008
- Tarhini AA, Iqbal F. CTLA-4 blockade: therapeutic potential in cancer treatments. Onco Targets Ther (2010); 3:15-25; PMID:20616954; http://dx.doi.org/10.2147/OTT.S4833
- Gabrilovich DI, Ostrand-Rosenberg S, Bronte V. Coordinated regulation of myeloid cells by tumours. Nat Rev Immunol (2012); 12(4):253-68; PMID:22437938; http://dx.doi.org/10.1038/nri3175
- Larkin J, Chiarion-Sileni V, Gonzalez R, Grob JJ, Cowey CL, Lao CD, Schadendorf D, Dummer R, Smylie M, Rutkowski P et al. Combined Nivolumab and Ipilimumab or Monotherapy in Untreated Melanoma. N Engl J Med (2015); 373(1):23-34; PMID:26027431; http://dx.doi.org/10.1056/NEJMoa1504030
- Postow MA, Chesney J, Pavlick AC, Robert C, Grossmann K, McDermott D, Linette GP, Meyer N, Giguere JK, Agarwala SS et al. Nivolumab and ipilimumab versus ipilimumab in untreated melanoma. N Engl J Med (2015); 372(21):2006-17; PMID:25891304; http://dx.doi.org/10.1056/NEJMoa1414428
- Hamid O, Robert C, Daud A, Hodi FS, Hwu WJ, Kefford R, Wolchok JD, Hersey P, Joseph RW, Weber JS et al. Safety and tumor responses with lambrolizumab (anti-PD-1) in melanoma. N Engl J Med (2013); 369(2):134-44; PMID:23724846; http://dx.doi.org/10.1056/NEJMoa1305133
- Wolchok JD, Kluger H, Callahan MK, Postow MA, Rizvi NA, Lesokhin AM, Segal NH, Ariyan CE, Gordon RA, Reed K et al. Nivolumab plus ipilimumab in advanced melanoma. N Engl J Med (2013); 369(2):122-33; PMID:23724867; http://dx.doi.org/10.1056/NEJMoa1302369
- Mitchem JB, Brennan DJ, Knolhoff BL, Belt BA, Zhu Y, Sanford DE, Belaygorod L, Carpenter D, Collins L, Piwnica-Worms D et al. Targeting tumor-infiltrating macrophages decreases tumor-initiating cells, relieves immunosuppression, and improves chemotherapeutic responses. Cancer Res (2013); 73(3):1128-41; PMID:23221383; http://dx.doi.org/10.1158/0008-5472.CAN-12-2731
- Pyonteck SM, Akkari L, Schuhmacher AJ, Bowman RL, Sevenich L, Quail DF, Olson OC, Quick ML, Huse JT, Teijeiro V et al. CSF-1R inhibition alters macrophage polarization and blocks glioma progression. Nat Med (2013); 19(10):1264-72; PMID:24056773; http://dx.doi.org/10.1038/nm.3337
- Strachan DC, Ruffell B, Oei Y, Bissell MJ, Coussens LM, Pryer N, Daniel D. CSF1R inhibition delays cervical and mammary tumor growth in murine models by attenuating the turnover of tumor-associated macrophages and enhancing infiltration by CD8 T cells. Oncoimmunology (2013); 2(12):e26968; PMID:24498562; http://dx.doi.org/10.4161/onci.26968
- Sluijter M, van der Sluis TC, van der Velden PA, Versluis M, West BL, van der Burg SH, van Hall T. Inhibition of CSF-1R supports T-cell mediated melanoma therapy. PLoS One (2014); 9(8):e104230; PMID:25110953; http://dx.doi.org/10.1371/journal.pone.0104230
- Paulus P, Stanley ER, Schafer R, Abraham D, Aharinejad S. Colony-stimulating factor-1 antibody reverses chemoresistance in human MCF-7 breast cancer xenografts. Cancer Res (2006); 66(8):4349-56; PMID:16618760; http://dx.doi.org/10.1158/0008-5472.CAN-05-3523
- Movahedi K, Guilliams M, Van den Bossche J, Van den Bergh R, Gysemans C, Beschin A, De Baetselier P, Van Ginderachter JA. Identification of discrete tumor-induced myeloid-derived suppressor cell subpopulations with distinct T cell-suppressive activity. Blood (2008); 111(8):4233-44; PMID:18272812; http://dx.doi.org/10.1182/blood-2007-07-099226
- Huang B, Pan PY, Li Q, Sato AI, Levy DE, Bromberg J, Divino CM, Chen SH. Gr-1+CD115+ immature myeloid suppressor cells mediate the development of tumor-induced T regulatory cells and T-cell anergy in tumor-bearing host. Cancer Res (2006); 66(2):1123-31; PMID:16424049; http://dx.doi.org/10.1158/0008-5472.CAN-05-1299
- Srivastava MK, Zhu L, Harris-White M, Kar UK, Huang M, Johnson MF, Lee JM, Elashoff D, Strieter R, Dubinett S et al. Myeloid suppressor cell depletion augments antitumor activity in lung cancer. PLoS One (2012); 7(7):e40677; PMID:22815789; http://dx.doi.org/10.1371/journal.pone.0040677
- Li X, Loberg R, Liao J, Ying C, Snyder LA, Pienta KJ, McCauley LK. A destructive cascade mediated by CCL2 facilitates prostate cancer growth in bone. Cancer Res (2009); 69(4):1685-92; PMID:19176388; http://dx.doi.org/10.1158/0008-5472.CAN-08-2164
- Lin H, Lee E, Hestir K, Leo C, Huang M, Bosch E, Halenbeck R, Wu G, Zhou A, Behrens D et al. Discovery of a cytokine and its receptor by functional screening of the extracellular proteome. Science (2008); 320(5877):807-11; PMID:18467591; http://dx.doi.org/10.1126/science.1154370
- Wei S, Nandi S, Chitu V, Yeung YG, Yu W, Huang M, Williams LT, Lin H, Stanley ER. Functional overlap but differential expression of CSF-1 and IL-34 in their CSF-1 receptor-mediated regulation of myeloid cells. J Leukoc Biol (2010); 88(3):495-505; PMID:20504948; http://dx.doi.org/10.1189/jlb.1209822
- Fleetwood AJ, Lawrence T, Hamilton JA, Cook AD. Granulocyte-macrophage colony-stimulating factor (CSF) and macrophage CSF-dependent macrophage phenotypes display differences in cytokine profiles and transcription factor activities: implications for CSF blockade in inflammation. J Immunol (2007); 178(8):5245-52; PMID:17404308; http://dx.doi.org/10.4049/jimmunol.178.8.5245
- Anagnostopoulos GK, Sakorafas GH, Kostopoulos P, Margantinis G, Tsiakos S, Terpos E, Pavlakis G, Fortun P, Arvanitidis D. Disseminated colon cancer with severe peripheral blood eosinophilia and elevated serum levels of interleukine-2, interleukine-3, interleukine-5, and GM-CSF. Surg Oncol (2005); 89(4):273-5; PMID:15726608; http://dx.doi.org/10.1002/jso.20173
- Wu QD, Wang JH, Bouchier-Hayes D, Redmond HP. Neutrophil-induced transmigration of tumour cells treated with tumour-conditioned medium is facilitated by granulocyte-macrophage colony-stimulating factor. Eur J Surg (2000); 166(5):361-6; PMID:10881945; http://dx.doi.org/10.3109/110241500750008899
- Jubinsky PT, Short MK, Mutema G, Morris RE, Ciraolo GM, Li M. Magmas expression in neoplastic human prostate. J Mol Histol (2005); 36(1–2):69-75; PMID:15704001; http://dx.doi.org/10.1007/s10735-004-3840-8
- Chavey C, Bibeau F, Gourgou-Bourgade S, Burlinchon S, Boissière F, Laune D, Roques S, Lazennec G. Oestrogen receptor negative breast cancers exhibit high cytokine content. Breast cancer research : BCR (2007); 9(1):R15; PMID:17261184; http://dx.doi.org/10.1186/bcr1648
- Fridlender ZG, Sun J, Kim S, Kapoor V, Cheng G, Ling L, Worthen GS, Albelda SM. Polarization of tumor-associated neutrophil phenotype by TGF-beta: “N1” versus “N2” TAN. Cancer cell (2009); 16(3):183-94; PMID:19732719; http://dx.doi.org/10.1016/j.ccr.2009.06.017
- Holmgaard RB, Zamarin D, Munn DH, Wolchok JD, Allison JP. Indoleamine 2,3-dioxygenase is a critical resistance mechanism in antitumor T cell immunotherapy targeting CTLA-4. J Exp Med (2013); 210(7):1389-402; PMID:23752227; http://dx.doi.org/10.1084/jem.20130066
- Holmgaard RB, D Zamarin, Y Li, B Gasmi, DH Munn, JP Allison, T Merghoub, JD Wolchok. Tumor-Expressed IDO Recruits and Activates MDSCs in a Treg-Dependent Manner. Cell reports 2015; 13:412-4; PMID:26411680; http://dx.doi.org/10.1016/j.celrep.2015.08.077
- Reich M, Liefeld T, Gould J, Lerner J, Tamayo P, Mesirov JP, “GenePattern 2.0” Nature Genetics (2006); 38 no. 5: 500-501; http://dx.doi.org/10.1038/ng0506-500
- Robert C, Schachter J, Long GV, Arance A, Grob JJ, Mortier L, Daud A, Carlino MS, McNeil C, Lotem M et al. Pembrolizumab versus Ipilimumab in Advanced Melanoma. N Engl J Med Jun (2015); 25;372(26):2521-32; PMID:25891173; http://dx.doi.org/10.1056/NEJMoa1503093
- Garon EB1, Rizvi NA, Hui R, Leighl N, Balmanoukian AS, Eder JP, Patnaik A, Aggarwal C, Gubens M, Horn L et al. Pembrolizumab for the treatment of non-small-cell lung cancer. N Engl J Med May (2015); 21;372(21):2018-28; PMID:25891174; http://dx.doi.org/10.1056/NEJMoa1501824
- Motzer RJ, Escudier B, McDermott DF, George S, Hammers HJ, Srinivas S, Tykodi SS, Sosman JA, Procopio G, Plimack ER et al. Nivolumab versus Everolimus in Advanced Renal-Cell Carcinoma. N Engl J Med Nov 5(2015); 373(19):1803-13; PMID:26406148; http://dx.doi.org/10.1056/NEJMoa1510665