
ABSTRACT
Upregulation of T cell immunoglobulin-3 (TIM-3) has been associated with negative regulation of the immune response in chronic infection and cancer, including lymphoma. Here, we investigated the possible correlation between TIM-3 expression by ex vivo cytotoxic T cells (CTL) from follicular lymphoma (FL) biopsies and their functional unresponsiveness that could limit the favorable impact of CTL on disease progression. We report a high percentage of CD8+TIM-3+T cells in lymph nodes of FL patients. When compared to their CD8+TIM-3− counterparts, CD8+TIM-3+ T cells exhibited defective cytokine production following TCR engagement. Furthermore, CD8+TIM-3+ T cells display ex vivo markers of lytic granule release and remain unresponsive to further TCR-induced activation of the lytic machinery. Although confocal microscopy showed that TIM-3 expression on CD8+ T cells correlated with minor alterations of immunological synapse, a selective reduction of ERK signaling in CD8+TIM-3+T cells was observed by phospho-flow analysis. Finally, short relapse-free survival despite rituximab(R)-chemotherapy was observed in patients with high content of TIM-3+ cells and a poor infiltrate of granzyme B+ T cells in FL lymph nodes. Together, our data indicate that, besides selective TCR early signaling defects, TIM-3 expression correlates with unresponsiveness of ex vivo CD8+ T cells in FL. They show that scores based on the combination of exhaustion and cytolytic markers in FL microenvironment might be instrumental to identify patients at early risk of relapses following R-chemotherapy.
Abbreviations
| CTL | = | cytotoxic T cells |
| EBV | = | Epstein Barr virus |
| FFPE | = | formalin-fixed paraffin-embedded |
| FL | = | follicular lymphoma |
| GrzB | = | granzyme B |
| IHC | = | immunohistochemistry |
| IS | = | immunological synapse |
| MFI | = | mean fluorescence intensity |
| PFS | = | progression-free survival |
| PMA/ion | = | Phorbol 12-myristate 13-acetate/ionomycin |
| R- | = | rituximab |
| SAg | = | superantigen |
| TCR | = | T-cell receptor |
| TMA | = | tissue microarray |
Introduction
Follicular lymphoma (FL) is the second most frequent B-cell lymphoma in adults. It is considered as an “indolent” lymphoma, based on non-aggressive initial presentation. However, despite the indolent course and evident therapeutic benefits of strategies combining chemotherapy and rituximab,Citation1-3 FL is still considered as an incurable disease since patients invariably relapse and ultimately die.
Previous studies have shown that the composition of the immune infiltrate and the intensity of the immune response in FL patients influence the disease outcome.Citation4-6 A predominance of T cells or of T cell related genes correlates with good prognosis, whereas a predominance of accessory cells (dendritic cells and monocytes) is associated with an aggressive course.Citation4-6 Among T cell populations, it is generally considered that CD8+ T cells, which play a central role in antitumor immune surveillance,Citation7 correlate with improved prognosis in FL.Citation4,6,8 By applying confocal laser scanning microscopy to FL lymph node samples, we previously showed that CD8+ cytotoxic T cells (CTL) are able to form synaptic-like contacts with FL B cells in tissues.Citation9 We also showed that a high expression of the lytic molecule granzyme B (GrzB) within CTL cytotoxic granules correlates with prolonged progression-free survival (PFS) in FL patients treated with immunochemotherapy.Citation9
T cell-infiltrating tumors display phenotypic and functional features of exhausted T cells, indicating that they are functionally impaired due to tumor antigen overload and various tumor immune escape mechanisms.Citation10-14 The state of unresponsiveness of exhausted cells is characterized by the expression of immune checkpoint molecules that are implicated in the down modulation of T cell responses. Several immune checkpoint molecules have been described as markers of CTL inactivation in cancerCitation15,16 and chronic viral infections.Citation17,18
Among them, it has been reported that the expression of TIM-3 (a member of the immunoglobulin and mucin domain families) on the surface of T cells correlates with reduced Th1 immune responses and with immunological tolerance in both viral infections and tumors.Citation19 More specifically, a recent study reported that TIM-3 engagement inhibits early TCR signaling and interferes with immunological synapse formation in cultured human peripheral blood CD8+ T cells.Citation20 TIM-3 expression is increased in tumor-infiltrating T lymphocytes (TILs) in several solid cancers such as non-small cell lung cancer or and advanced melanoma.Citation11-14 The expression of TIM-3 is also increased in FL TILsCitation10-14 and a high expression of TIM-3 is correlated with higher histological grade and level of serum lactate dehydrogenase in FL patients as compared to FL with low expression of TIM-3.Citation10 Recently, Yang et al.Citation10 showed that treatment with IL-12 increases TIM-3 expression by FL TILs and that TIM-3+ TILs exhibit functional impairment when stimulated with PMA/ionomycin (PMA/ion). Finally, they observed that patients with a high number of CD4+TIM-3+ T cells in FL cellular suspensions showed a poorer clinical outcome as compared to the FL patients with a low number of CD4+TIM-3+ T cells, with a 2-y PFS rate at 82% versus 100%.Citation10
An unanswered question regarding the TIM-3+ CTL function in FL concerns the capacity of the CD8+TIM-3+ T cell-infiltrating FL lymph nodes to be productively activated via TCR engagement. To address this question, we investigated various early and late responses in primary CD8+TIM-3+ T cells freshly isolated from FL lymph nodes as compared to their TIM-3− counterparts. By assaying the signaling and functional responses of TILs contained within fresh lymph node cell suspensions, we provide evidence that TIM-3 expression has minor effects on early TCR signaling, whereas it remains a powerful marker of exhaustion of CD8+ T cell-infiltrating FL.
Results
Expression of TIM-3 on CD8+GrzB+ T cell-infiltrating FL lymph nodes
We analyzed the composition of the immune cell infiltrate in FL lymph nodes as compared to tonsils using the gating strategies described in Fig. S1, for CD8+ T cells. We observed that FL lymph nodes (Fig. S2A) and tonsils (Fig. S2B) from various donors exhibited a similar percentage of the main adaptive and innate cell subsets (CD4+ and CD8+ T cells, γδ T cells, and NK cells) and a similarly rich B-cell infiltrate. These results validated the use of tonsils as a non-tumoral control tissue for FL samples. In agreement with our previous IHC data,Citation9 we found an increased percentage of CD8+GrzB+ CTL and a higher mean fluorescence intensity (MFI) of GrzB expression by individual CD8+ T cell in FL samples when compared to tonsils (Fig. S2C and D).
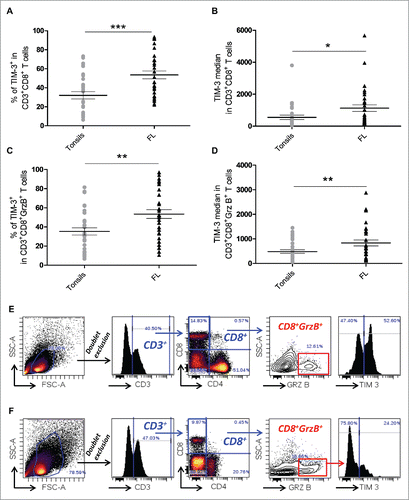
Our analysis also showed that the percentage of TIM-3+ cells within the CD8+ T cell population and the median fluorescence intensity of TIM-3 staining were higher in T cell-infiltrating FL lymph nodes as compared to tonsils (). Higher percentage and higher median fluorescence intensity of TIM-3 in FL compared to tonsils were also observed in CD8+GrzB+cells (). Representative examples of TIM-3 expression in FL and tonsil CD3+CD8+GrzB+ T cells are shown in , respectively.
Figure 1. TIM-3 is highly expressed in both CD8+ and CD8+GrzB+tumor-infiltrating T cells in FL lymph nodes. Percentage of CD3+CD8+TIM-3+ T cells (A) and TIM-3 median fluorescence intensity (B) in CD3+CD8+ T cells from FL nodes (n = 33) and tonsils (n = 29). Percentage of CD3+CD8+GrzB+TIM-3+ T cells (C) and TIM-3 median fluorescence intensity in TIM-3+ CTL cells (D) in FL nodes and tonsils. Example of the gating strategy used and representative histogram of TIM-3 expression in CD8+GrzB+ in FL lymph nodes (E) and in tonsils (F). Unpaired Student's t-test using the GraphPad Prism software (version 6; GraphPad) was used to determine the statistical significance of differences between the groups. p = 0.0002 (A); p = 0.0164 (B); p = 0.0015 (C); p = 0.0078 (D).
The above results show that though the frequency of armed CTL is increased in FL tissues, a large number of these FL CTL express TIM-3, suggesting a state of inactivation.
CD8+ TIM-3+ TILs exhibit defective responses to TCR stimulation
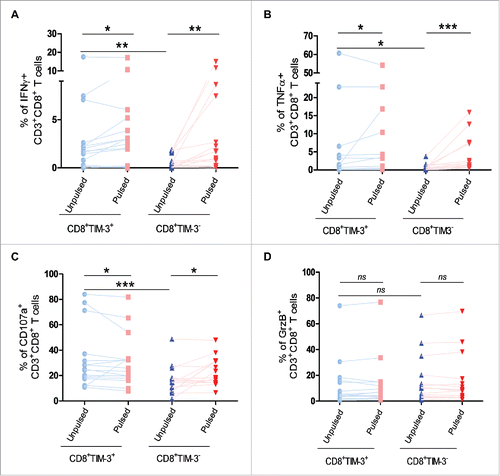
To assess functional responses of CD8+TIM-3+ and CD8+TIM-3− T cells, we investigated cytokine production in freshly isolated primary FL cell suspensions. This approach allowed us to interrogate cells that were not manipulated by cell sorting and ex vivo culture. Target EBV-transformed B cells pulsed with a cocktail of superantigen (SAg) were added to the primary FL cell suspensions in order to elicit activation of the T cells within their microenvironment. It has been previously reported that the incubation of FL-B cells with peripheral blood T cells from healthy donors can alter their functional responses.Citation21 More recently, it has been reported that peripheral blood CD8+ T cells from healthy donors exhibit deficient cytotoxicity when interacting with B cells from both CLL patients and healthy donors B cells.Citation22 We thus employed as target cells JY cells (an EBV-transformed B-cell line that is typically used as conventional target for human CTLsCitation23), and not autologous FL B cells pulsed with a cocktail of SAg, to stimulate in an efficient fashion both TIM-3+ and TIM-3− CD8+ T cells and to compare their responses.
We observed that though basal levels of IFNγ and TNFα production were higher in CD8+TIM-3+ T cells than in their CD8+TIM-3−counterparts, cytokine production following TCR engagement was not further increased in CD8+TIM-3+ T cells as compared to CD8+TIM-3−T cells (). We next investigated the activation of the lytic machinery in CD8+TIM-3+T cells after TCR stimulation. Likewise, CD8+TIM-3+ T cells showed a higher basal level of CD107a expression on their surface than their CD8+TIM-3− counterparts (). As shown in , following TCR stimulation, CD107a exposure was either unchanged or decreased in CD8+TIM-3+T cells. GrzB expression was also not strongly altered in these cells following TCR stimulation (). CD8+TIM-3− T cells exhibited a moderate increase in CD107a exposure, whereas the loss of GrzB was not significantly induced after TCR engagement.
Figure 2. Impact of TIM-3 expression on cytokine production and lytic machinery activation in FL lymph node CD8+ T cells following TCR triggering. IFNγ (A) and TNFα (B) production by CD8+TIM-3+or by CD8+TIM-3− T cells from FL lymph node cell suspensions (n = 26) after 4 h conjugation with unpulsed or SAg-pulsed EBV B cells. CD107a exposure (C) and GrzB expression (D) in CD8+TIM-3+or CD8+TIM-3− T cells in FL cell suspensions after conjugation. Wilcoxon signed-rank test using the GraphPad Prism software (version 6; GraphPad) was used to determine the statistical significance of differences between the groups. p = 0.0206, 0.0012, 0.0027 (A); p = 0.0252, 0.0002, 0.0261 (B); p = 0.0332, 0.0206, 0.0002 (C); p = 0.3301, 0.3684, 0.0853 (D).
As shown in Fig. S3, similar results were obtained following stimulation with PMA/ion, a treatment that bypasses TCR engagement, in line with previously reported data.Citation10
Likewise, as shown in Fig. S4, CD8+TIM-3+T cells from tonsils or reactive lymph nodes cell suspensions also exhibited a defect in cytokine production and CD107a exposure following PMA/ion stimulation. Moreover, they also showed a higher basal activation status when compared to their TIM-3− counterpart.
To further investigate the basal activation status of TIM-3+CD8+ T cells, we compared the gene expression profile of CD3+CD8+TIM-3+ T cells with that of CD3+CD8+TIM-3− T cells. Cells were freshly isolated from FL lymph nodes. We initially verified that the HAVCR2 gene, coding for TIM-3, was significantly upregulated in CD8+TIM-3+ cells when compared to CD8+TIM-3− cells (Fig. S5A and 5B). We next focused on genes included in the “T cell activation” (Gene Ontology GO0042110) and “Programmed cell death” (Gene Ontology GO0012501) genesets and on genes coding for proteins described as markers of CD8+ T cell activation, such as PRF1, CD69, etc. We found an upregulation of several genes involved in T cell activation such as GZMB, PRF1, CD70, and IL2RA in CD3+CD8+TIM-3+ T cells as compared to their TIM-3− counterpart (Fig. S5A and B). In contrast, PDCD1, IL2, and CD69 gene expressions were similar in TIM-3+ and TIM-3− cells (Fig. S5C and D).
Taken together, the above results showed that CD8+TIM-3+ TILs isolated from FL samples exhibit a high basal state of activation but are unresponsive to TCR-mediated stimulation. Interestingly, this functional phenotype is observed in CD8+TIM-3+ T cells from both FL lymph nodes and reactive lymphoid tissues.
Productive early TCR signaling at the immunological synapse of freshly isolated CD8+TIM-3+ cells
The above reported data showing impaired responses of TIM-3+ cells raised the question of whether TCR signaling could be impaired in TIM-3+ cells or whether activation defects might occur downstream of early TCR signaling. To address this question, CD8+TIM-3−and CD8+TIM-3+T cells were sorted from lymph nodes of FL patients and conjugated for 15 min with EBV B cells either unpulsed or pulsed with a cocktail of bacterial SAg. Cells were stained with antibodies directed against α-tubulin and phosphorylated tyrosine (pTyr) to detect T cell polarization toward target cells and tyrosine phosphorylation events at the immunological synapse. Cells were analyzed using a confocal laser-scanning microscope. This analysis showed that pTyr staining was detectable at the contact site between SAg-pulsed target cells and both TIM-3+and TIM-3− T cells (, respectively), whereas it was not observed in TIM-3−cells in contact with unpulsed target cells ().
Figure 3. Minor alteration of immunological synapse formation in CD8+TIM-3+ T cells from FL lymph nodes. Representative IS formation between CD8+TIM–3+ T cells (A) and CD8+TIM-3– T cells (B and C) from FL lymph nodes (n = 3) stained with α-tubulin (green) and pTyr (red) after 15 min conjugation with unpulsed (C) or SAg-pulsed (A and B) EBV B cells (blue stained). The yellow arrow indicates the MTOC position. Bar 5 µm. (D) Scheme depicting pTyr intensity measurement defined by three reference areas at different regions of the T cell surface: immunological synapse between T cell and target B cell (=IS), distal synapse region (=D–IS) and area between these two regions (=M). The intensity of pTyr red fluorescence was measured in the different cell areas as indicated in the scheme. Fluorescence intensity in the regions of interest was compared to that of the entire cells using the Metamorph® software. In particular, the mean intensity of pTyr red fluorescence in CD8+TIM-3– and in CD8+TIM3+ T cells was calculated by dividing the pTyr red pixels in IS and those in the D-IS for the total red pixel of entire cell (IS+M+D-IS) (E). Comparison of pTyr staining lenght at the IS area between pulsed CD8+TIM-3+ T cells and CD8+TIM-3– T cells (unpulsed CD8+TIM-3– T cells as negative control) (µm). (F) Comparison of the distance between microtubule-organizing center (MTOC) and the center of the IS area between pulsed CD8+TIM-3+ T cells and CD8+TIM-3– T cells (µm). Each dot in represents a cell. Data are from three FL patients. For the different FL samples standardized conditions for pinhole size, for gain and offset (brightness and contrast), were used for image capture. Wilcoxon signed-rank test using the GraphPad Prism software (version 6; GraphPad) was used to determine the statistical significance of differences between the groups. p = 0.3699, p < 0.0001, and p < 0.0001, respectively (D); p < 0.0001 and p = 0.0232, respectively (E).
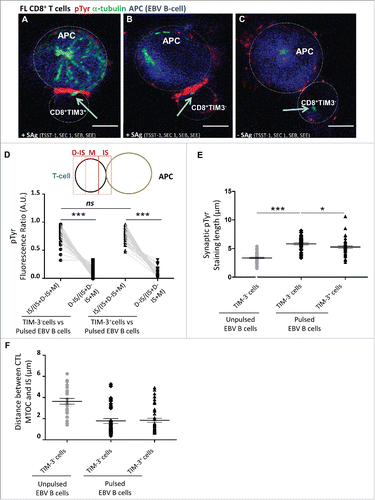
To quantify this phenomenon, we measured in a significant number of T cell/B cell conjugates the intensity of pTyr staining at the synaptic area (IS), at the distal area (D-IS), and in the whole cell. For data normalization, fluorescence intensities at the IS and at the D-IS were divided by the total fluorescence intensity of the T cell. As shown in , in stimulated cells, the intensity of pTyr staining at the IS was higher at the IS when compared to the D-IS. Moreover, TIM-3− and TIM-3+ T cells exhibited pTyr staining intensities at the IS that were not significantly different (). Nevertheless, measurement of the length of the synaptic pTyr staining in CD8+TIM-3+cells, as compared to CD8+TIM-3−cells, revealed that the extension of phosphorylated tyrosines in TIM-3+T cells was moderately shorter (), suggesting a slightly reduced area of signaling.
Polarization responses toward target cells were similar in the TIM-3+ and TIM-3− T cell subsets. Indeed, in both cases, a major fraction of T cells in conjugation with target cells polarized their microtubule organizing center (MTOC) toward the IS ().
In summary, these results indicate that conjugate formation and early TCR signaling are not substantially altered in CD8+TIM-3+T cells from FL patients.
Selective signal transduction defects in CD8+TIM-3+ FL TILs
In order to identify possible downstream mechanisms responsible for the defective activation of TIM-3+ CTL, we investigated signal transduction in CD8+TIM-3+ T cells as compared to their CD8+TIM-3− counterparts in FL cell suspensions, using a phospho-flow approach.
After 15 min of stimulation with PMA/ion, ERK phosphorylation was reduced in CD8+TIM-3+ T cells as compared to CD8+TIM-3− T cells. The reduced level of ERK phosphorylation in CD8+TIM-3+ TILs was also observed after 4 h PMA/ion stimulation (data not shown). In contrast, similar levels of pAKT(T308) and pAKT(S473) were induced upon PMA/ion stimulation in the two cell subsets ().
Figure 4. Selective signaling defects following FL CD8+ TIM-3+ T cell stimulation. Representative histogram overlay (A) and pooled datas (B) of CD8+TIM-3+ and CD8+TIM-3−T cells staining for phosphorylated ERK (pERK) and AKT (T308 and S473) (pAKTs), (MFI), after 15 min of PMA/ion stimulation (n = 7). Representative histogram overlay (C) and pooled datas (D) of CD8+TIM-3+ and CD8+ TIM-3− T cell staining for pERK after 15 min of TCR triggering (n = 4). Paired Student's t-test using the GraphPad Prism software (version 6; GraphPad) was used to determine the statistical significance of differences between the groups. p = 0.0488 (B); p = 0.0422 (D).
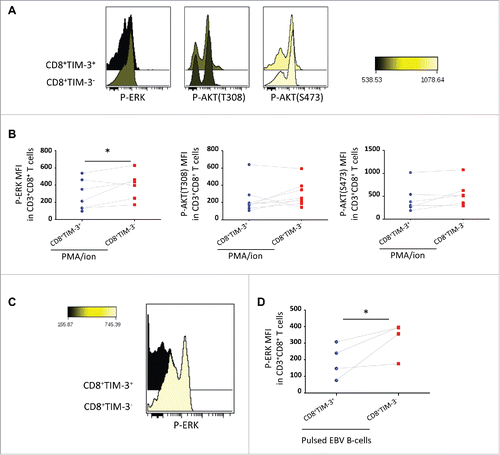
We then asked whether TCR engagement would also result in a reduced ERK phosphorylation in the CD8+TIM-3+ T cell subset. As shown in , CD8+TIM-3+T cells exhibited a significantly lower ERK phosphorylation following TCR triggering for 15 min when compared to their CD8+TIM-3− T cell counterpart. Accordingly, phosphorylation of MEK 1/2 (S218/S222) (a signaling component upstream of ERK) was also reduced in CD8+TIM-3+ T cells following TCR triggering (Fig. S6).
Taken together, these results show that though CD8+TIM-3+ T cells form immunological synapses with antigen-presenting cells, selective defects in TCR signaling are observed in these cells.
Prognostic value of TIM-3 expression in FL microenvironment
In order to define if the prognostic value of the GrzB score we previously reportedCitation9 could be modulated by TIM-3 expression in the tumor microenvironment, we investigated, by using whole slide imaging, TIM-3+ T cell infiltration on 46 FL patients' samples from a previously published cohort ().Citation9 Since co-localization of TIM-3 and CD8 at the cell membrane was technically difficult to assess by IHC in FFPE samples, we focused on the analysis of TIM-3 expression by all small lymphocytes of FL microenvironment. Staining for TIM-3 showed a variable infiltration of TIM-3+ lymphoid cells in our FL cohort, accounting for a median 10% (range <5%–30%) of total immune cells. This analysis allowed us to define two groups of patients: One exhibiting high TIM-3 staining in FL samples () and the other exhibiting a low TIM-3 staining () with a cutoff value at 10%. In agreement with our previous results,Citation9 low GrzB score (calculated by adding the percentage of GrzB+ cells combined to the value corresponding to the staining intensity)Citation9 exhibited a significant association with poor PFS (logrank p-value = 0.016) ().
Figure 5. Correlation of TIM-3 expression in FL microenvironment with progression-free-survival in FL patients treated by R-combined chemotherapy. Representative sections from FL lymph nodes showing high (A and B) and low (C and D) content of TIM-3+ cells, with cutoff of 10% (bar = 50 µm). Kaplan Meier curves for PFS of FL patients (n = 46) according to GrzB score ( p = 0.016) (E); to the percentage of TIM-3+ cells (p = 0.037) (F) and to the cumulative value of GrzB score and TIM-3 staining in the four groups (Log rank p-value = 0.0064) (G).
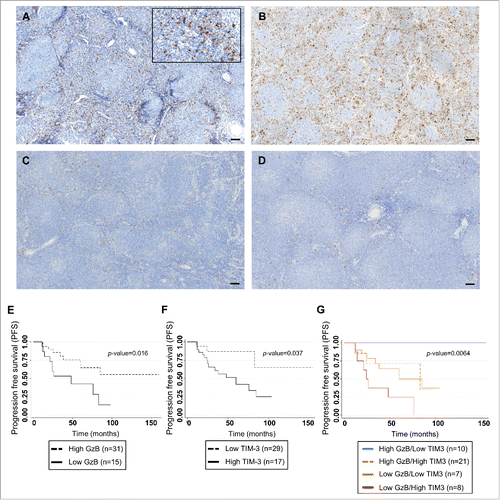
Table 1. Clinical features and IHC score for TIM-3 staining of the 46 FL patients cohort.
High percentage of TIM-3+ immune cells in the infiltrate was associated with shortened patient PFS (logrank p-value = 0.037) (). Multivariate analysis showed that both GrzB score and percentage of TIM-3+ cells were independent risk factors for early relapse (). We next investigated the cumulative effect of TIM-3+ cell percentage and GrzB score on PFS. As shown in and , the 2-y PFS was 100% in patients with high GrzB/low TIM-3 staining, whereas it was 50% in patients with low GrzB/high TIM-3 staining. Patients with high GrzB/high TIM-3 or low GrzB/low TIM-3 staining showed an intermediate risk of relapse with 2-y PFS rate at 81.2% (adjusted p-value = 0.001). The cumulative effect of GrzB score and TIM-3+ cell percentage on PFS was confirmed in a TMA cohort of FL patients (n = 34) treated by R-chemotherapy (log rank p-value = 0.01) (Fig. S7 and Table S2).
Table 2. Clinical features and progression-free survival of the 46 FL patients used for IHC.
Our results clearly indicate that the sequential scoring of an immune-checkpoint (TIM-3) and a T cell activation marker (GrzB) might be of value to identify FL patients with high risk for early relapse after R-chemotherapy.
Discussion
In this study, we investigated the ex vivo functional responses of CD8+TIM-3+T cells following stimulation. A novel aspect of our study is that we monitored CD8+TIM-3+ responses not only following PMA/ion stimulation, but also after triggering of TCR by cell-bound ligands. We report that CD8+TIM-3+T cells are strongly enriched in FL lymph node samples and exhibit defective cytokine production and activation of the lytic machinery when compared to their CD8+TIM-3−counterparts. In spite of major functional defects, minor alterations of TCR signaling were detected in FL CD8+TIM-3+T cells.
Our results shed new light on the role of TIM-3 in the control of CD8+ T cell responses in cancer patients. It is well established that TIM-3 expression correlates with a T cell exhausted phenotype in viral infectionsCitation24-28 and in cancer.Citation10-13 However, functional responses to TCR engagement of TIM-3+ TILs within freshly prepared tissue suspensions of tumor-infiltrated lymph nodes from cancer patients have not been investigated.
In a recent study, Yang et al.Citation10 investigated the functional responses of CD4+TIM-3+ or CD8+TIM-3+ T cells in FL patients and showed that TIM-3+ T cells are functionally impaired following stimulation with PMA/ion.Citation10 Our results extend those previous observations by showing that following TCR triggering T cells in lymph node cell suspensions exhibit impaired CD107a upregulation and limited IFNγ and TNFα production. Our analysis also suggests that TIM-3 expression is associated with a basal status of activation characterized by higher levels of cytokine production and of CD107a expression on their surface, when compared to their TIM-3− counterparts. Together, these results suggest that CD8+TIM-3+ T cells might have been constitutively activated in vivo and might therefore represent a population of exhausted cells less responsive to further stimulation. In other words, it is tempting to speculate that our study provides a “post-hit” snapshot of the activation status of CD8+ cell-infiltrating FL lymph nodes. Further research is necessary to better characterize the basal activation status of CD8+TIM-3+ T cells. It would be for instance interesting to investigate whether CD8+TIM-3+ T cells might exhibit a more restricted TCR repertoire when compared to their TIM-3+ counterpart.
We also show that conjugate formation and early TCR signaling were not substantially altered in FL CD8+TIM-3+T cells, when compared to FL CD8+TIM-3−T cells. Ramsay et al.Citation21 previously reported that in FL patients with leukemic-phase disease, TILs and peripheral blood T lymphocytes interacting with FL B cells form defective immunological synapses. Our results extend those obtained by Ramsay et al.Citation21 since we did not investigate the capacity of FL lymphocytes to form synapses as compared to healthy donors, conversely we focused on the role of TIM-3 expression in modulating synapse formation.
A recent study reported that TIM-3 expression inhibits TCR signaling and affects the stability of immunological synapses.Citation20 Although Clayton et al.Citation20 used T cells from healthy donors' blood samples that were in vitro expanded using anti-CD3/CD28 coated beads, we employed FL TILs either freshly isolated or left within the lymph node cell suspensions. Under our experimental conditions, the defect in T cell activation appears to be downstream of early TCR triggering and synapse formation. Accordingly, the observation that PMA/ion treatment, which bypasses TCR engagement, results in defective functional responses in TIM-3+ T cells (our results andCitation10) is compatible with a model of TIM-3 inhibition of T cell responses that acts downstream of the early TCR signaling. We also report a defect in ERK and MEK phosphorylation, suggesting that in CD8+TIM-3+ T cells, limited TCR-induced cytokine production by CD8+TIM-3+T cells and defective lytic granule secretion responses might reflect defective ERK signaling.Citation29-31
TIM-3-mediated exhaustion of CD8+ T cells is not limited to TILs being detected in reactive tissues such as tonsils and reactive lymph nodes, yet, the strong enrichment of TIM-3+ lymphoid cells in FL samples, as compared to tonsils, suggests that the FL microenvironment skews CD8+ T cells toward a TIM-3+ phenotype.
Our results also show that FL microenvironment harbored a rich infiltrate of TIM-3+ immune cells. Although IHC cannot allow us to appreciate the co-expression of TIM-3 and CD8+ on TILs, we observed that TIM-3 was predominantly expressed by lymphocytes, characterized by round to oval small nuclei and limited cytoplasm. However, some TIM-3+ macrophages, characterized by larger nuclei containing prominent nucleoli and an abundant cytoplasm, were also seen the FL microenvironment, but they were relatively rare when compared to TILs.
Further biological studies based on larger cohorts of patients are needed to confirm our results, specifically on the prognostic role of TIM-3 in FL. However, it should be noted that in our study we analyzed samples from 80 patients divided into two cohorts: an initial cohort of 46 FL patients and a validation cohort of 34 FL patients. In a previous study, Yang et al.Citation10 reported a significant correlation between TIM-3 expression by CD4+ T cells and PFS in a cohort of 33 FL patients. Taken together with the published study, our data strongly suggest that expression of TIM-3 in the FL microenvironment could be a prognostic marker of disease outcome. Moreover, in our study, we performed a combined score and reported that high TIM-3 expression plus low GrzB score is predictive of early relapse in the two cohorts. This last observation highlights the usefulness of combining immune checkpoints scores (such as TIM-3) with T cell activation markers scores (such as GrzB) to identify FL patients with high risk of early relapse.
Blockade of immune checkpoint molecules such as PD-1 or PD-L1 has already provided benefit in several cancer types, including melanoma, renal cell carcinoma, bladder cancer, non-small cell lung cancer, and hematologic malignancies such as Hodgkin lymphoma and FL.Citation32-35 The recent demonstration of the efficacy of targeting TIM-3 in various mouse tumor modelsCitation36-38 and in ex vivo melanoma studiesCitation12 suggests that TIM-3 might be a suitable target molecule in cancer immunotherapy. Accordingly, the use of a TIM-3 blocking antibody is currently under clinical investigation. Our results, by showing a high risk of early relapse in FL patients with low GrzB score and high TIM-3 staining, suggest that the use of these two markers can help to identify patients who might better profit of maintenance strategies after R-chemotherapy, with rituximab alone or in association with immune checkpoint inhibitors.
Material and methods
Patients
For flow cytometry analysis, lymph nodes were obtained from 33 FL patients who had not received prior therapy diagnosed between 2010 and 2014 according to the WHO classification in the Department of Hematology, IUCT France.Citation39 All patient clinical data are described in Table S1. Healthy specimens used for control conditions were obtained from tonsils (n = 29) or reactive lymph node (n = 10).
For IHC studies, 46 additional FL samples were used for immunostainings on whole tissue samples from a previously published FL cohort.Citation9 All patient clinical data are described in . Response to treatment based on Rituximab (R) combined to cyclophosphamide, doxorubicin, vincristine and prednisone (R-CHOP; n = 25); R combined to cyclophosphamide, vincristine, and prednisone (R-CVP; n = 6); and R combined to fludarabine, mitoxantrone (R-FM; n = 6) and R-CHOP with R maintenance (Rm, n = 9) was assessed according to the Cheson 1999 criteria.Citation40 We also analyzed a TMA from 34 FL patients treated with R-CHOP (n = 23); R-CVP (n = 2); R-bendamustine (n = 3) and R-CHOP with R maintenance (n = 6) (Table S2). Tissue samples were collected and processed following standard ethical procedures (Helsinki protocol), after obtaining written informed consent from each donor and approval for this study by the local ethical committee (Comité de Protection des Personnes Sud-Ouest et Outremer II).
Cell isolation and culture
Fresh tissues from lymph nodes or control lymphoid tissues were dissociated using the gentleMACS™ Octo Dissociator. Cell suspensions were frozen in 4% human albumin (VIALEBEX 40 mg/mL, LFB Biomedicaments)/10% DMSO until FL diagnosis.
Intracellular staining and flow cytometry staining protocols
Cells were stained with Abs directed against CD3 (clone UCHT1; BD Biosciences), CD4 (clone SK3; BD Biosciences), CD8 (clone SK1; BD Biosciences), CD56 (clone AF12-7H3; Miltenyi-Biotec), gamma 9 (clone B1; Biolegend), IFNγ (clone B27; BD Biosciences), TNFα (clone MAb11; BD Biosciences), GrzB (GB11; BD Biosciences), CD4 (clone SFCI12T4D11; Beckman Coulter), CD8 (clone B9.11; Beckman Coulter), CD19 (clone J3-119; Beckman Coulter), TIM-3 (clone 344823; R&D), and perforin (clone δg9; Biolegend). CD107a antibody (clone H4A3; BD Biosciences) was added to the culture during the stimulation.Citation41
For cytokine production and lytic machinery activation, FL cell suspensions or reactive lymphoid tissues were either treated with Phorbol 12-myristate 13-acetate (0.1 µg/mL, Sigma-Aldrich) and ionomycin (1 µg/mL, Sigma-Aldrich) (PMA/ion) or conjugated at a 1:1 ratio with EBV-transformed B cells previously pulsed or not with SAg cocktail (100 ng/mL TSST-1, SEC 1, SEB, SEE).
For phosphoflow analysis, FL cell suspensions were stained with antibodies directed against phosphorylated forms of AKT (pS473) (clone M89-61; BD Biosciences), AKT (pT308) (clone J1-223.371; BD Biosciences), ERK 1-2 (pT202/pY204) (clone 20A; BD Biosciences), and MEK 1-2 (pS218/pS222) (clone O24-836; BD Biosciences) and with total forms of ERK-2 (clone G263-7; BD Biosciences) and MEK-1 (clone 25/MEK1; BD Biosciences), as previously described.Citation42
Cell sorting and confocal microscopy
Cells from FL biopsies were stained with anti-CD3, anti-CD8, and anti-TIM-3 at 4°C in PBS-FCS. After exclusion of dead cells, CD3+CD8+TIM-3− and CD3+CD8+TIM-3+ cells were sorted using an FACS ARIA Sorp (BD Biosciences, cell purity >99%). TIM-3+ and TIM-3− cell populations were conjugated for 15 min at a 1:1 E/T ratio with Bodipy 630-stained EBV B cells. Cells were fixed, permeabilized, and stained with antibodies directed against α-tubulin (rabbit polyclonal; Abcam) or phosphorylated tyrosine (clone PY99; Santa Cruz Biotechnologies). Primary Abs were followed by goat anti-mouse isotype-specific Ab or goat anti-rabbit Ab labeled with Alexa 488, or Alexa 555 (Molecular Probes). The samples were mounted and analyzed as previously described.Citation43
Gene expression analysis
RNA was extracted from CD3+CD8+TIM-3+ and CD3+CD8+TIM-3− cells sorted from three FL lymph nodes. cDNA were prepared from 500 pg RNA per sample and hybridized on GeneChip Human Gene ST 2.0 Affymetrix microarrays (Affymetrix UK Ltd.), by the Lyon University genomic facility ProfileXpert-LCMT (Lyon, France) according to the manufacturer's protocol. Data are available on NCBI Gene Expression Omnibus website (http://www.ncbi.nlm.nih.gov/geo/): GEO dataset GSE84072. Raw data were RMA–normalized and collapsed to common protein-encoding genes (using the HUGO nomenclature). Gene expressions were analyzed and illustrated with heatmaps, using GSEA.Citation44
Immunohistochemistry analyses
Three μm-thick sections of formalin-fixed-paraffin-embedded (FFPE) FL lymph node whole tissues (n = 46) or FL's TMAs (n = 34 cores) were tested using Ventana Benchmark XT immunostainer (Ventana, Tucson, AZ). Samples were stained with TIM-3 antibody (goat polyclonal; R&D). Whole slides of FL lymph nodes and TMA were scanned using Pannoramic digital slide scanners (3DHISTECH.) as previously described.Citation45 The percentage of TIM-3 stained cells in the FL microenvironment was scored on digitalized slides by two pathologists (CL and CF) and categorized into two groups: high TIM-3 (≥10 % TIM-3 cells out of immune cells) and low TIM-3 (<10 %). GrzB scores were calculated as recently published.Citation9
Statistics
Statistical significance of difference between groups was evaluated by a Student's t-test for or by Wilcoxon signed-rank or Student's t-tests in and in Figs. S2–S6) using GraphPad Prism software. To compare clinical characteristics between patients exhibiting low or high TIM-3 staining, we performed a chi2 test for qualitative variables and a Student's t-test for quantitative variables ( and Table S2). For time-to-event analyses, primary end point for PFS analysis was defined as time from the end of R-chemotherapy to progression. For univariate analysis, we performed Kaplan–Meier curves and log-rank test to assess association of TIM-3 expression or GrzB score with progression (, and Fig. S7A and B). We used the same test to assess the cumulative effect of TIM-3 expression and GrzB scoreCitation9 on PFS, in the four groups as defined by high GrzB/low TIM-3 staining; high GrzB/high TIM-3 staining; low GrzB/low TIM-3 staining; and low GrzB/high TIM-3 staining ( and Fig. S7C). Cox proportional hazard model was performed to test the simultaneous influence of all covariates on PFS with a p-value<0.1 in the univariate analysis. A separate model was used to test the cumulative effect of TIM-3 expression and GrzB score, modeled as a proportional effect between subgroups. Final Cox model includes covariates with logrank p-value<0.05 after backward stepwise removal method: GrzB score, TIM-3 staining, and sex (). Analyses were performed using STATAVersion 11.
Disclosure of potential conflicts of interest
No potential conflicts of interest were disclosed.
Author contributions
PG, CF, CL collected and analyzed data; CD provided expert statistical analysis; PG, CF, SM and CL performed experiments; CL, PB, RDG, RK, LML, SH, FXF, LO, LY, MNC and GL provided patient samples and clinical information; CL and SV designed the research; PG, CL and SV wrote the paper.
KONI_A_1224044_supplementary_data.zip
Download Zip (1.6 MB)Acknowledgments
We thank Laurence Jalabert, Audray Benest and Gabrielle Perez for IHC experiments (IUCT). We thank the “plateau technique de cytométrie et de microscopie” INSERM UMR 1043. We thank the Imag'IN Platform (IUCT). We thank Loic Dupré for critical reading of the manuscript.
Funding
This work was supported by grants from Institut National du Cancer (contracts INCa PBLIO11-130 and INCa/DGOS 2012-054), the Laboratoire d'Excellence Toulouse Cancer (TOUCAN) (contract ANR11-LABX), Fondations Toulouse Cancer Santé & RITC (to SV), and from CAPTOR (contract ANR11-PHUC0001) and the Institut Carnot Lymphome (CALYM) (to CL). Pauline Gravelle is supported by CeVi_Collection project, from the CALYM Carnot Institute, funded by the French National Research Council (ANR).
References
- Marcus R, Imrie K, Belch A, Cunningham D, Flores E, Catalano J, Solal-Celigny P, Offner F, Walewski J, Raposo J et al. CVP chemotherapy plus rituximab compared with CVP as first-line treatment for advanced follicular lymphoma. Blood 2005; 105:1417-23; PMID:15494430; http://dx.doi.org/10.1182/blood-2004-08-3175
- Hiddemann W, Kneba M, Dreyling M, Schmitz N, Lengfelder E, Schmits R, Reiser M, Metzner B, Harder H, Hegewisch-Becker S et al. Frontline therapy with rituximab added to the combination of cyclophosphamide, doxorubicin, vincristine, and prednisone (CHOP) significantly improves the outcome for patients with advanced-stage follicular lymphoma compared with therapy with CHOP alone: results of a prospective randomized study of the German Low-Grade Lymphoma Study Group. Blood 2005; 106:3725-32; PMID:16123223; http://dx.doi.org/10.1182/blood-2005-01-0016
- Salles G, Mounier N, de Guibert S, Morschhauser F, Doyen C, Rossi JF, Haioun C, Brice P, Mahé B, Bouabdallah R et al. Rituximab combined with chemotherapy and interferon in follicular lymphoma patients: results of the GELA-GOELAMS FL2000 study. Blood 2008; 112:4824-31; PMID:18799723; http://dx.doi.org/10.1182/blood-2008-04-153189
- Alvaro T, Lejeune M, Salvadó MT, Lopez C, Jaén J, Bosch R, Pons LE. Immunohistochemical patterns of reactive microenvironment are associated with clinicobiologic behavior in follicular lymphoma patients. J Clin Oncol 2006; 24:5350-7; PMID:17135637; http://dx.doi.org/10.1200/JCO.2006.06.4766
- Dave SS, Wright G, Tan B, Rosenwald A, Gascoyne RD, Chan WC, Fisher RI, Braziel RM, Rimsza LM, Grogan TM et al. Prediction of survival in follicular lymphoma based on molecular features of tumor-infiltrating immune cells. N Engl J Med 2004; 351:2159-69; PMID:15548776; http://dx.doi.org/10.1056/NEJMoa041869
- Wahlin BE, Aggarwal M, Montes-Moreno S, Gonzalez LF, Roncador G, Sanchez-Verde L, Christensson B, Sander B, Kimby E. A unifying microenvironment model in follicular lymphoma: outcome is predicted by programmed death-1–positive, regulatory, cytotoxic, and helper T cells and macrophages. Clin Cancer Res 2010; 16:637-50; PMID:20068089; http://dx.doi.org/10.1158/1078-0432.CCR-09-2487
- Pagès F, Galon J, Dieu-Nosjean MC, Tartour E, Sautès-Fridman C, Fridman WH. Immune infiltration in human tumors: a prognostic factor that should not be ignored. Oncogene 2010; 29:1093-102; PMID:19946335; http://dx.doi.org/10.1038/onc.2009.416
- Wahlin BE, Sander B, Christensson B, Kimby E. CD8+ T-cell content in diagnostic lymph nodes measured by flow cytometry is a predictor of survival in follicular lymphoma. Clin Cancer Res 2007; 13:388-97; PMID:17255259; http://dx.doi.org/10.1158/1078-0432.CCR-06-1734
- Laurent C, Müller S, Do C, Al-Saati T, Allart S, Larocca LM, Hohaus S, Duchez S, Quillet-Mary A, Laurent G et al. Distribution, function, and prognostic value of cytotoxic T lymphocytes in follicular lymphoma: a 3-D tissue-imaging study. Blood 2011; 118:5371-9; PMID:21856865; http://dx.doi.org/10.1182/blood-2011-04-345777
- Yang ZZ, Grote DM, Ziesmer SC, Niki T, Hirashima M, Novak AJ, Witzig TE, Ansell SM. IL-12 upregulates TIM-3 expression and induces T cell exhaustion in patients with follicular B cell non-Hodgkin lymphoma. J Clin Invest 2012; 122:1271-82; PMID:22426209; http://dx.doi.org/10.1172/JCI59806
- Gao X, Zhu Y, Li G, Huang H, Zhang G, Wang F, Sun J, Yang Q, Zhang X, Lu B. TIM-3 expression characterizes regulatory T cells in tumor tissues and is associated with lung cancer progression. PLoS One 2012; 7:e30676; PMID:22363469; http://dx.doi.org/10.1371/journal.pone.0030676
- Fourcade J, Sun Z, Benallaoua M, Guillaume P, Luescher IF, Sander C, Kirkwood JM, Kuchroo V, Zarour HM. Upregulation of Tim-3 and PD-1 expression is associated with tumor antigen-specific CD8+ T cell dysfunction in melanoma patients. J Exp Med 2010; 207:2175-86; PMID:20819923; http://dx.doi.org/10.1084/jem.20100637
- Li H, Wu K, Tao K, Chen L, Zheng Q, Lu X, Liu J, Shi L, Liu C, Wang G et al. Tim-3/galectin-9 signaling pathway mediates T-cell dysfunction and predicts poor prognosis in patients with hepatitis B virus-associated hepatocellular carcinoma. Hepatology 2012; 56:1342-51; PMID:22505239; http://dx.doi.org/10.1002/hep.25777
- Anderson AC. Tim-3, a negative regulator of anti-tumor immunity. Curr Opin Immunol 2012; 24:213-6; PMID:22226204; http://dx.doi.org/10.1016/j.coi.2011.12.005
- Liu X, Gibbons RM, Harrington SM, Krco CJ, Markovic SN, Kwon ED, Dong H. Endogenous tumor-reactive CD8(+) T cells are differentiated effector cells expressing high levels of CD11a and PD-1 but are unable to control tumor growth. Oncoimmunology 2013; 2:e23972; PMID:23894697; http://dx.doi.org/10.4161/onci.23972
- Turnis ME, Andrews LP, Vignali DA. Inhibitory receptors as targets for cancer immunotherapy. Eur J Immunol 2015; 45(7):1892-905; PMID:26018646; http://dx.doi.org/10.1002/eji.201344413
- Wherry EJ, Ha SJ, Kaech SM, Haining WN, Sarkar S, Kalia V, Subramaniam S, Blattman JN, Barber DL, Ahmed R. Molecular signature of CD8+ T cell exhaustion during chronic viral infection. Immunity 2007; 27:670-84; PMID:17950003; http://dx.doi.org/10.1016/j.immuni.2007.09.006
- Crawford A, Wherry EJ. The diversity of costimulatory and inhibitory receptor pathways and the regulation of antiviral T cell responses. Curr Opin Immunol 2009; 21:179-86; PMID:19264470; http://dx.doi.org/10.1016/j.coi.2009.01.010
- Rodriguez-Manzanet R, DeKruyff R, Kuchroo VK, Umetsu DT. The costimulatory role of TIM molecules. Immunol Rev 2009; 229:259-70; PMID:19426227; http://dx.doi.org/10.1111/j.1600-065X.2009.00772.x
- Clayton KL, Haaland MS, Douglas-Vail MB, Mujib S, Chew GM, Ndhlovu LC, Ostrowski MA. T cell Ig and mucin domain-containing protein 3 is recruited to the immune synapse, disrupts stable synapse formation, and associates with receptor phosphatases. J Immunol 2014; 192:782-91; PMID:24337741; http://dx.doi.org/10.4049/jimmunol.1302663
- Ramsay AG, Clear AJ, Kelly G, Fatah R, Matthews J, Macdougall F, Lister TA, Lee AM, Calaminici M, Gribben JG. Follicular lymphoma cells induce T-cell immunologic synapse dysfunction that can be repaired with lenalidomide: implications for the tumor microenvironment and immunotherapy. Blood 2009; 114:4713-20; PMID:19786615; http://dx.doi.org/10.1182/blood-2009-04-217687
- Kabanova A, Sanseviero F, Veronica C, Gamberucci A, Gozzetti A, Campoccia G, Bocchia M, Baldari CT. Human Cytotoxic T Lymphocytes form dysfunctional immune synapses with B cells characterized by non-polarized lytic granule release. Cell Rep 2016; 15:9-18; PMID:27052167; http://dx.doi.org/10.1016/j.celrep.2016.02.084
- Valitutti S, Müller S, Dessing M, Lanzavecchia A. Different responses are elicited in cytotoxic T lymphocytes by different levels of T cell receptor occupancy. J Exp Med 1996; 183:1917-21; PMID:8666949; http://dx.doi.org/10.1084/jem.183.4.1917
- Jones RB, Ndhlovu LC, Barbour JD, Sheth PM, Jha AR, Long BR, Wong JC, Satkunarajah M, Schweneker M, Chapman JM et al. Tim-3 expression defines a novel population of dysfunctional T cells with highly elevated frequencies in progressive HIV-1 infection. J Exp Med 2008; 205:2763-79; PMID:19001139; http://dx.doi.org/10.1084/jem.20081398
- Ju Y, Hou N, Zhang XN, Zhao D, Liu Y, Wang JJ, Luan F, Shi W, Zhu FL, Sun WS et al. Blockade of Tim-3 pathway ameliorates interferon-gamma production from hepatic CD8+ T cells in a mouse model of hepatitis B virus infection. Cell Mol Immunol 2009; 6:35-43; PMID:19254478; http://dx.doi.org/10.1038/cmi.2009.5
- Golden-Mason L, Palmer BE, Kassam N, Townshend-Bulson L, Livingston S, McMahon BJ, Castelblanco N, Kuchroo V, Gretch DR, Rosen HR. Negative immune regulator Tim-3 is overexpressed on T cells in hepatitis C virus infection and its blockade rescues dysfunctional CD4+ and CD8+ T cells. J Virol 2009; 83:9122-30; PMID:19587053; http://dx.doi.org/10.1128/JVI.00639-09
- Sehrawat S, Reddy PB, Rajasagi N, Suryawanshi A, Hirashima M, Rouse BT. Galectin-9/TIM-3 interaction regulates virus-specific primary and memory CD8 T cell response. PLoS Pathog 2010; 6:e1000882; PMID:20463811; http://dx.doi.org/10.1371/journal.ppat.1000882
- Jin HT, Anderson AC, Tan WG, West EE, Ha SJ, Araki K, Freeman GJ, Kuchroo VK, Ahmed R. Cooperation of Tim-3 and PD-1 in CD8 T-cell exhaustion during chronic viral infection. Proc Natl Acad Sci U S A 2010; 107:14733-8; PMID:20679213; http://dx.doi.org/10.1073/pnas.1009731107
- Robertson LK, Mireau LR, Ostergaard HL. A role for phosphatidylinositol 3-kinase in TCR-stimulated ERK activation leading to paxillin phosphorylation and CTL degranulation. J Immunol 2005; 175:8138-45; PMID:16339552; http://dx.doi.org/10.4049/jimmunol.175.12.8138
- Metz PJ, Arsenio J, Kakaradov B, Kim SH, Remedios KA, Oakley K, Akimoto K, Ohno S, Yeo GW, Chang JT. Regulation of asymmetric division and CD8+ T lymphocyte fate specification by protein kinase Cζ and protein kinase Cλ/ι. J Immunol 2015; 194:2249-59; PMID:25617472; http://dx.doi.org/10.4049/jimmunol.1401652
- Dumont FJ, Staruch MJ, Fischer P, DaSilva C, Camacho R. Inhibition of T cell activation by pharmacologic disruption of the MEK1/ERK MAP kinase or calcineurin signaling pathways results in differential modulation of cytokine production. J Immunol 1998; 160:2579-89; PMID:9510155
- Laurent C, Charmpi K, Gravelle P, Tosolini M, Franchet C, Ysebaert L, Brousset P, Bidaut A, Ycart B, Fournié JJ et al. Several immune escape patterns in non-Hodgkin's lymphomas. Oncoimmunology 2015 Apr 2; 4(8):e1026530; PMID:26405585; PMCID:PMC4570141; http://dx.doi.org/10.1080/2162402X.2015.1026530
- Brahmer JR, Tykodi SS, Chow LQ, Hwu WJ, Topalian SL, Hwu P, Drake CG, Camacho LH, Kauh J, Odunsi K et al. Safety and activity of anti-PD-L1 antibody in patients with advanced cancer. N Engl J Med 2012; 366:2455-65; PMID:22658128; http://dx.doi.org/10.1056/NEJMoa1200694
- Page DB, Postow MA, Callahan MK, Allison JP, Wolchok JD. Immune modulation in cancer with antibodies. Annu Rev Med 2014; 65:185-202; PMID:24188664; http://dx.doi.org/10.1146/annurev-med-092012-112807
- Westin JR, Chu F, Zhang M, Fayad LE, Kwak LW, Fowler N, Romaguera J, Hagemeister F, Fanale M, Samaniego F et al. Safety and activity of PD1 blockade by pidilizumab in combination with rituximab in patients with relapsed follicular lymphoma: a single group, open-label, phase 2 trial. Lancet Oncol 2014; 15:69-77; PMID:24332512; http://dx.doi.org/10.1016/S1470-2045(13)70551-5
- Sakuishi K, Apetoh L, Sullivan JM, Blazar BR, Kuchroo VK, Anderson AC. Targeting Tim-3 and PD-1 pathways to reverse T cell exhaustion and restore anti-tumor immunity. J Exp Med 2010; 207:2187-94; PMID:20819927; http://dx.doi.org/10.1084/jem.20100643
- Koyama S, Akbay EA, Li YY, Herter-Sprie GS, Buczkowski KA, Richards WG, Gandhi L, Redig AJ, Rodig SJ, Asahina H et al. Adaptive resistance to therapeutic PD-1 blockade is associated with upregulation of alternative immune checkpoints. Nat Commun 2016; 7:10501; PMID:26883990; http://dx.doi.org/10.1038/ncomms10501
- Ngiow SF, Teng MW, Smyth MJ. Prospects for TIM3-Targeted Antitumor Immunotherapy. Cancer Res 2011; 71:6567-71; PMID:22009533; http://dx.doi.org/10.1158/0008-5472.CAN-11-1487
- Swerdlow SH, Campo E, Harris NL, Jaffe ES, Pileri SA, Stein H, Thiele J, Vardiman JW. WHO Classification of Tumours of Haematopoietic and Lymphoid Tissues, 4th Edition. In: IARC Presse L, ed., 2008:439
- Cheson BD, Horning SJ, Coiffier B, Shipp MA, Fisher RI, Connors JM, Lister TA, Vose J, Grillo-López A, Hagenbeek A et al. Report of an international workshop to standardize response criteria for non-Hodgkin's lymphomas. NCI Sponsored International Working Group. J Clin Oncol 1999; 17:1244; PMID:10561185
- Betts MR, Brenchley JM, Price DA, De Rosa SC, Douek DC, Roederer M, Koup RA. Sensitive and viable identification of antigen-specific CD8+ T cells by a flow cytometric assay for degranulation. J Immunol Methods 2003; 281:65-78; PMID:14580882; http://dx.doi.org/10.1016/S0022-1759(03)00265-5
- Irish JM, Czerwinski DK, Nolan GP, Levy R. Kinetics of B cell receptor signaling in human B cell subsets mapped by phosphospecific flow cytometry. J Immunol 2006; 177:1581-9; PMID:16849466; http://dx.doi.org/10.4049/jimmunol.177.3.1581
- Bertrand F, Müller S, Roh KH, Laurent C, Dupré L, Valitutti S. An initial and rapid step of lytic granule secretion precedes microtubule organizing center polarization at the cytotoxic T lymphocyte/target cell synapse. Proc Natl Acad Sci U S A 2013; 110:6073-8; PMID:23536289; http://dx.doi.org/10.1073/pnas.1218640110
- Subramanian A, Tamayo P, Mootha VK, Mukherjee S, Ebert BL, Gillette MA, Paulovich A, Pomeroy SL, Golub TR, Lander ES et al. Gene set enrichment analysis: a knowledge-based approach for interpreting genome-wide expression profiles. Proc Natl Acad Sci U S A 2005; 102:15545-50; PMID:16199517; http://dx.doi.org/10.1073/pnas.0506580102
- Laurent C, Guérin M, Frenois FX, Thuries V, Jalabert L, Brousset P, Valmary-Degano S. Whole-slide imaging is a robust alternative to traditional fluorescent microscopy for fluorescence in situ hybridization imaging using break-apart DNA probes. Hum Pathol 2013; 44:1544-55; PMID:23517924; http://dx.doi.org/10.1016/j.humpath.2012.12.009