
 ?Mathematical formulae have been encoded as MathML and are displayed in this HTML version using MathJax in order to improve their display. Uncheck the box to turn MathJax off. This feature requires Javascript. Click on a formula to zoom.
ABSTRACT
Mesenchymalization is a cellular and molecular program in which epithelial cells progressively lose their well-differentiated phenotype and adopt mesenchymal characteristics. Tumor mesenchymalization occurs during the progression of cancer to metastatic disease, and is also associated with resistance to multiple therapeutics, including killing by cytotoxic immune cells. Furthermore, tumor cells can evade immune destruction by upregulating the checkpoint molecule PD-L1, and emerging research has found higher PD-L1 expression in mesenchymalized tumors. Here, the association between TGF-β1-mediated mesenchymalization and PD-L1 was investigated in non-small cell lung cancer cells (NSCLC). TGF-β1 was found to upregulate PD-L1 gene transcription in a Smad2-dependent manner, and a positive association between PD-L1 and phosphorylated Smad2 was found in NSCLC tumors. The potential to target these 2 negative immune regulators with a single agent was investigated using M7824, a novel clinical-stage bifunctional agent that targets both PD-L1 and TGF-β. Treatment of NSCLC cells with M7824 in vitro and in vivo attenuated features of TGF-β1-mediated mesenchymalization, including mesenchymal marker expression, proliferation suppression, and chemoresistance. These findings demonstrate that upregulation of tumor cell PD-L1 is a novel mechanism of TGF-β1-induced immunosuppression in NSCLC, and that treatment with M7824 has the potential to simultaneously block both tumor mesenchymalization and PD-L1-dependent immunosuppression.
Introduction
The ongoing quest to develop improved therapies has now focused upon leveraging the patient's own immune system against tumor progression. In recent years, encouraging clinical results have been achieved in various tumor types using monoclonal antibodies that target immune checkpoints such as cytotoxic T lymphocyte associated protein-4 (CTLA-4), programmed cell death-1 (PD-1), and programmed cell death ligand-1 (PD-L1).Citation1-3 In particular, the PD-1/PD-L1 checkpoint has emerged as a critical inhibitory pathway that regulates the effector phase of T-cell activity within peripheral tissues. PD-1 is a receptor protein expressed by activated T cells that binds to the transmembrane proteins PD-L1 and PD-L2 expressed by antigen presenting cells, resulting in the inhibition of T-cell proliferation, survival, and effector functions.Citation4-6 In several malignancies, PD-L1 can become aberrantly overexpressed by tumor cells, leading to the suppression of infiltrating antigen-specific T cells and reduced host antitumor immune responses.Citation7,8
Lung cancer is the leading cause of cancer-related deaths in the United States, with about 1 in 4 cancer deaths attributed to this disease. Non-small cell lung cancer (NSCLC), which accounts for about 85% of cases,Citation9 has a 5-year survival rate of only 21%, far lower than that of other similarly prevalent cancers such as colon, breast, and prostate cancers.Citation10 Treatment of NSCLC includes various regimens of cytotoxic chemotherapy and molecularly-targeted therapies that inhibit specific oncogenic alterations such as EGFR mutation and ALK rearrangement. However, chemotherapy treatments lead to only modest improvements in patient survival, and targeted therapies inevitably result in recurrence with drug-resistant disease. Improved overall survival in patients who have progressed on platinum-based chemotherapy or targeted therapies led to the recent FDA approval of 2 anti-PD-1 checkpoint inhibitors, nivolumab and pembrolizumab, for the treatment of NSCLC.Citation11,12 Another checkpoint inhibitor, avelumab, is a fully human IgG1 anti-PD-L1 monoclonal antibody that also has the ability to mediate the lysis of human tumor cells expressing PD-L1 via the mechanism of antibody-dependent cellular cytotoxicity (ADCC).Citation13 Clinical studies with avelumabCitation14,15 have led to its recent approval for the treatment of Merkel cell carcinoma (MCC) and 2 indications in bladder cancer, with multiple Phase 3 clinical trials currently ongoing in various tumor types, including NSCLC. Interestingly, an association between PD-L1 expression by tumor cells and/or infiltrating immune cells and clinical response to PD-1/PD-L1-targeted therapies has been shown, yet this association is not flawless; only a minority of PD-L1-positive tumors respond to these treatments, and certain PD-L1-negative tumors are nevertheless responsive to treatment.Citation16-18 This raises the possibility that additional factors govern patient response to PD-1/PD-L1-targeted therapies, and that additional predictive biomarkers must be identified to improve the clinical use of these agents.
Epithelial-mesenchymal transition (EMT) is a process whereby epithelial cells lose their characteristic features and gain the qualities of a mesenchymal phenotype.Citation19 This mesenchymalization of tumor cells is recognized as a central mechanism in cancer progression that drives metastasis, stemness, and drug resistance.Citation20 Tumor cell mesenchymalization has also been shown to protect against host antitumor immune responses, by mediating resistance to killing by cytotoxic immune cells,Citation21-25 promoting resistance to complement-dependent cytotoxicity,Citation26 and inducing suppressive immune cell populations at the tumor site.Citation21,27 Recent advances have revealed that EMT may also suppress antitumor immunity through upregulation of PD-L1. In one such report, an intrinsic mechanism was demonstrated in which the EMT transcription factor ZEB1 repressed the expression of PD-L1-targeting miRNAs, resulting in elevated PD-L1 expression in human and murine lung cancer cells.Citation28 Similarly, the oncogenic C-terminal subunit of mucin 1, termed MUC1-C, has been shown to induce tumor EMT via activation of ZEB1 and, at the same time, to induce PD-L1 expression at the transcriptional level, thus integrating the induction of EMT with that of PD-L1 expression.Citation29 Other studies have determined that EMT induced by treatment with exogenous soluble factors yielded an increased level of PD-L1 expression in normal and cancerous cells.Citation30,31 Finally, an integrated analysis of independent human lung adenocarcinoma data sets revealed that tumor EMT status was strongly associated with elevation of multiple immune checkpoints, including PD-L1.Citation32
In the present study, we report the effect of TGF-β1, a pleiotropic cytokine known to induce EMT and suppress antitumor immunity,Citation33 on tumor PD-L1 expression in several epithelial NSCLC cell lines. The upregulation of PD-L1 in the context of TGF-β1-mediated mesenchymalization occurred at the transcriptional level via phosphorylation of Smad2, a key downstream effector of TGF-β signaling, and a positive association between PD-L1 expression and phosphorylated Smad2 was found in human NSCLC tumor samples. We also report here the use of a novel bifunctional fusion protein designated M7824, which consists of an α-PD-L1 antibody moiety based on avelumab linked to the extracellular domain of 2 TGFβRII molecules. M7824 recently demonstrated antitumor activity in preclinical studies (Lan et al., manuscript in preparation), as well as safety and evidence of clinical efficacy in a recent dose-escalation Phase I study, including a confirmed complete response in a cervical cancer patient and a durable partial response in a pancreatic cancer patientCitation34,35 (Strauss et al., manuscript in preparation). In the present study, M7824 reduced features of TGF-β1-dependent mesenchymalization in NSCLC cells. Moreover, TGF-β1-mediated upregulation of PD-L1 was found to enhance the susceptibility of NSCLC cells to ADCC mediated by M7824. These findings identify upregulation of PD-L1 as an additional mechanism of TGF-β1-induced suppression of antitumor immunity, and provide further rationale for using this novel agent, M7824, to treat patients with NSCLC and potentially other malignancies.
Results
TGF-β upregulates PD-L1 in NSCLC cells
Tumor cell EMT can be induced by a variety of factors, including loss of E-cadherin, oncogene activation, and growth factor stimulation.Citation36 To address the potential effect of tumor mesenchymalization on the expression of PD-L1, lung cancer cell lines (PC-9, H3255, A549 and HCC4006) were exposed to TGF-β1 in vitro and assessed for the expression of epithelial E-cadherin and occludin (CDH1 and OCLN, respectively) and mesenchymal N-cadherin, fibronectin, vimentin, snail, slug and the zinc finger E-box binding homeobox 1 (CDH2, FN1, VIM, SNAI1, SNAI2 and ZEB1, respectively). Compared to untreated cells, treatment with TGF-β1 induced characteristic EMT-related changes, including reduced epithelial gene expression in 2 cell lines (A549 and HCC4006) and increased mesenchymal gene expression in all 4 cell lines at the mRNA () and protein levels (). Analysis of surface PD-L1 levels revealed that TGF-β1 upregulated PD-L1 in all 4 cell lines to levels approaching or even exceeding those of IFN-γ stimulated cells (). Combination treatment with TGF-β1 and IFN-γ was found to enhance PD-L1 to a greater degree than either factor alone (). TGF-β1 also upregulated PD-L1 expression either alone or in combination with IFN-γ in NSCLC cell lines with constitutively high basal PD-L1 expression (H441, HCC827, HCC2935, and H226), albeit to a more modest degree (Fig. S1). Expression of PD-L2 (B7-DC), another ligand for the PD-1 receptor,Citation5 was also found to be upregulated by TGF-β1 treatment in PC-9, A549, and HCC4006 cells when given in combination with IFN-γ (Fig. S2A). At the mRNA level, TGF-β1 enhanced both CD274 (encoding PD-L1, ) and PDCD1LG2 (encoding PD-L2, Fig. S2B) expression in all 4 cell lines evaluated, an effect that was further increased with combination treatment of TGF-β1 and IFN-γ ( and Fig. S2B).
Figure 1. TGF-β1 induces EMT and PD-L1 expression in NSCLC cell lines. (A) qRT-PCR analysis and (B) immunoblot analysis of EMT marker expression in cells treated with TGF-β1 (2 ng/mL) for 72 h. *, p < 0.05 vs. untreated cells; [CDH1 (E-cadherin), OCLN (occludin), CDH2 (N-cadherin), FN1 (fibronectin), VIM (vimentin), SNAI1 (snail), SNAI2 (slug), ZEB1 (zinc finger E-box binding homeobox 1]. (C) Flow cytometry analysis of PD-L1 expression in cells treated −/+ TGF-β1 (2 ng/mL) for 72 h −/+ IFN-γ (20 ng/mL) for the final 24 h. Graphs below depict quantified values of PD-L1 expression (% PD-L1 positive x MFI) for each sample. (D) qRT-PCR analysis of CD274 (encoding for PD-L1) expression in cells treated −/+ TGF-β1 (2 ng/mL) for 72 h −/+ IFN-γ (20 ng/mL) for the final 24 h. *, p < 0.05.
![Figure 1. TGF-β1 induces EMT and PD-L1 expression in NSCLC cell lines. (A) qRT-PCR analysis and (B) immunoblot analysis of EMT marker expression in cells treated with TGF-β1 (2 ng/mL) for 72 h. *, p < 0.05 vs. untreated cells; [CDH1 (E-cadherin), OCLN (occludin), CDH2 (N-cadherin), FN1 (fibronectin), VIM (vimentin), SNAI1 (snail), SNAI2 (slug), ZEB1 (zinc finger E-box binding homeobox 1]. (C) Flow cytometry analysis of PD-L1 expression in cells treated −/+ TGF-β1 (2 ng/mL) for 72 h −/+ IFN-γ (20 ng/mL) for the final 24 h. Graphs below depict quantified values of PD-L1 expression (% PD-L1 positive x MFI) for each sample. (D) qRT-PCR analysis of CD274 (encoding for PD-L1) expression in cells treated −/+ TGF-β1 (2 ng/mL) for 72 h −/+ IFN-γ (20 ng/mL) for the final 24 h. *, p < 0.05.](/cms/asset/c755e6f6-0159-40bc-a9b8-d4fe70097ce9/koni_a_1349589_f0001_oc.gif)
TGF-β1 enhances PD-L1 gene transcription
To identify the mechanism of PD-L1 regulation by TGF-β1, A549 cells were first treated with TGF-β1 for various time points to perform a kinetic assessment of PD-L1 mRNA and protein expression. As shown in , both PD-L1 mRNA and protein levels increased at 24 h of treatment with TGF-β1, peaked at 48 h, and remained elevated up to the final 72 h time point. Next, PD-L1 levels were assessed in response to various doses of TGF-β1; a dose of 5 ng/mL was found to maximally stimulate PD-L1 mRNA production, while PD-L1 protein responded in a bell-shaped distribution where maximal stimulation occurred at 1–2 ng/mL (, right). Since PD-L1 expression was shown to be regulated by various micro-RNAs,Citation28,37,38 experiments were conducted to measure the stability of CD274 transcripts. Treatment with TGF-β1 resulted in no enhancement of CD274 transcript stability in either PC-9 or A549 cells (), implying that TGF-β1 must regulate PD-L1 gene transcription instead of mRNA stability.
Figure 2. TGF-β1 activates PD-L1 gene transcription via Smad2. (A) PD-L1 mRNA and protein levels from A549 cells treated with indicated doses of TGF-β1 for the indicated time points. Values were normalized to the level at the 0 h time point (left) or the 0 ng/mL dose (right). (B) CD274 mRNA expression in PC-9 and A549 cells pre-treated −/+ TGF-β1 (5 ng/mL) for 24 h followed by actinomycin D (10 μg/mL) for the indicated time points. (C) Diagram of the CD274 gene promoter region; bar graph, CD274 promoter luciferase assay of A549 cells treated −/+ TGF-β1 (5 ng/mL) −/+ IFN-γ (20 ng/mL) for 48 h. *, p < 0.05. (D) Diagram of the short CD274 gene promoter region; bar graphs, CD274 promoter luciferase assay of PC-9 and A549 cells treated −/+ TGF-β1 (2 ng/mL) for 48 hr −/+ IFN-γ (20 ng/mL) for the final 24 h. *, p < 0.05. (E) Immunoblot analysis of Smad2 and Smad3 levels in A549 cells transfected with the indicated siRNAs for 96 h. (F) qRT-PCR analysis of mRNAs encoding for PD-L1, E-cadherin and vimentin in A549 cells transfected with the indicated siRNAs for 72 h −/+ TGF-β1 (2 ng/mL) for the final 48 h. *, p < 0.05 for a comparison of Smad2/3 siRNA to control siRNA for the TGF-β1 treatment groups. (G) Flow cytometry analysis of PD-L1 expression in A549 cells transfected with the indicated siRNAs for 96 h and treated −/+ TGF-β1 (2 ng/mL) for the final 72 h. (H) Flow cytometry analysis of PD-L1 expression in A549 cells treated with TGF-β1 (2 ng/mL) −/+ the indicated inhibitor for 72 h. Graphs depict quantified values of PD-L1 expression (% PD-L1 positive x MFI) for each sample.
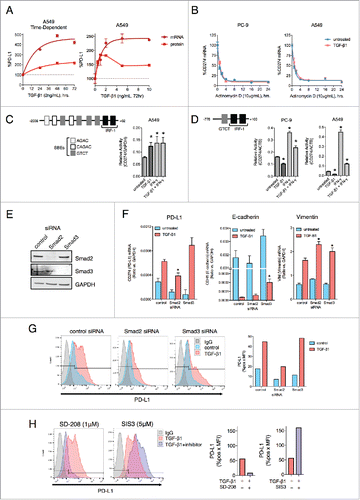
TGF-β signaling induces phosphorylation of R-Smad proteins (Smad2/3), which then form a complex with Smad4 to regulate the transcription of genes that contain Smad-binding elements (SBEs).Citation39 Analysis of the CD274 gene promoter revealed at least 7 regions that could potentially be bound by Smad proteins in a region -1000 to -2000bp upstream of the transcriptional start site (TSS), while IRF-1 sites known to be regulated by IFN-γ are in a region that is -250bp upstream of the TSSCitation40 (). Using a promoter reporter vector that encompassed the full region 2000bp upstream of the TSS of the CD274 gene, TGF-β1 and IFN-γ treatment were both able to increase promoter activity above the level observed with untreated cells (). In contrast, PC-9 and A549 cells that had been transfected with a reporter vector that only encompasses a region (-778 to +100 bp) with one putative SBE showed no transcriptional activation in response to TGF-β1 (), suggesting that TGF-β1 upregulates CD274 gene transcription in a manner that requires the sequence elements found within the -778 to -2000bp upstream of the TSS.
TGF-β1-mediated upregulation of PD-L1 depends upon Smad2
The contribution of canonical (Smad-dependent) versus non-canonical (Smad-independent) TGF-β1 signaling in the upregulation of PD-L1 was also assessed. To probe canonical signaling, siRNA-based knockdown of Smad2 or Smad3 in A549 cells was used (). Silencing of Smad2 was found to significantly block TGF-β1-mediated upregulation of PD-L1 mRNA () and PD-L1 protein expression (), yet silencing of Smad3 did not interfere with this enhancement. Unlike with PD-L1, silencing of Smad2 did not prevent the downregulation of E-cadherin or the upregulation of vimentin in response to TGF-β1 (). In contrast, silencing of Smad3 was associated with a partial reversal of TGF-β1-induced downregulation of E-cadherin. The contribution of Smad2 toward PD-L1 upregulation in response to TGF-β1 treatment was further confirmed using pharmacological approaches, in which treatment of A549 cells with TGF-β1 in combination with the TGF-βRI inhibitor SD-208 completely abrogated PD-L1 upregulation as expected. The addition of the Smad3 inhibitor SIS3, however, did not block but instead enhanced upregulation of PD-L1 (). Similar results were also observed using HCC4006 cells (Fig. S3A-C).
Next, small molecule inhibitors were used to determine the contribution of non-canonical TGF-β1 signaling to the upregulation of PD-L1. Combination treatment with TGF-β1 and the PI3K inhibitor wortmannin partially reduced PD-L1 upregulation in only A549 cells (Fig. S3D); and all other tested inhibitors (U0126, MEK1/2 inhibitor; SB203580, p38-MAPK inhibitor; BMS-345541, IKK-2 inhibitor; and S31–201, STAT3 inhibitor) failed to prevent the upregulation of PD-L1 in response to TGF-β1 in both A549 and HCC4006 cell lines. These results suggest that TGF-β1-mediated upregulation of PD-L1 occurs through a Smad2-dependent mechanism.
PD-L1 and phosphorylated Smad2 in human NSCLC tumor samples
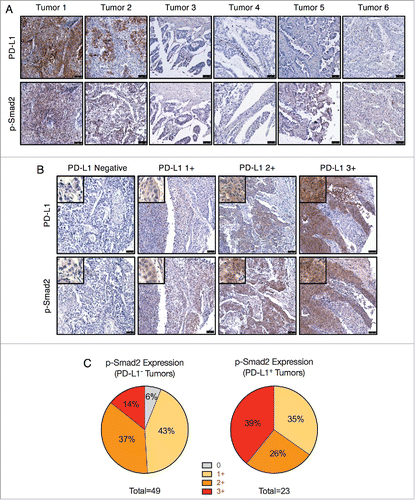
The connection between TGF-β signaling and PD-L1 expression was then assessed using human NSCLC tumor microarrays. Since TGF-β1-induced upregulation of PD-L1 was observed to be dependent upon Smad2, tumors were assessed for PD-L1 and phosphorylated Smad2 (p-Smad2) expression as an indicator of active TGF-β signaling. Immunohistochemical staining of a test array of 6 tumors revealed strong PD-L1 staining and moderate p-Smad2 staining in tumors 1 and 2 (). Of the 4 PD-L1-negative tumors, only tumor 5 had a low level of p-Smad2 staining (). These observations were then expanded to a larger array of 72 evaluable NSCLC tumor samples, of which 23 (31.9%) stained positive for PD-L1 at variable intensities (). Categorization of p-Smad2 staining intensity determined that about half (24/49, 48.9%) of PD-L1-negative tumors exhibited absent or low (1+) intensity p-Smad2 staining (). In contrast, none of the PD-L1-positive tumors were found to be p-Smad2-negative, and the majority (15/23, ∼65.2%) exhibited moderate (2+) or high (3+) intensity p-Smad2 staining (). Furthermore, the highest intensity p-Smad2 staining was substantially more enriched in the PD-L1 positive tumors (9/23, 39.1%) as opposed to the PD-L1 negative tumors (7/49, 14.3%) (). Altogether, these data provide in vivo evidence that PD-L1 protein expression may potentially be associated with active TGF-β/Smad2 signaling in human NSCLC tumors.
Figure 3. PD-L1 and phosphorylated Smad2 in NSCLC tumor samples. (A) IHC staining for PD-L1 and p-Smad2 in lung tumors (T047 microarray). Scale bar = 75 μm. (B) IHC staining of PD-L1 and p-Smad2 from matched samples of the LC819t tumor microarray. Images are representative of the indicated PD-L1 staining intensity category (0, 1+, 2+, 3+). Scale bar = 75 μm. Insets show an enlarged view of tumor cell staining. (C) Categorization of p-Smad2 staining intensity from PD-L1 negative and positive tumors.
TGF-β1-mediated upregulation of PD-L1 enhances NSCLC cell susceptibility to ADCC mediated by PD-L1-targeting agents
Since TGF-β1 was observed to upregulate PD-L1 expression, it is conceivable that TGF-β1 treatment may enhance tumor cell susceptibility to ADCC mediated by IgG1 antibodies targeting PD-L1, including avelumab and M7824. To investigate this potential mechanism, ADCC assays using donor-derived natural killer (NK) cells were performed on untreated A549 cells or cells pre-treated with TGF-β1, IFN-γ, or both. In these experiments, killing by NK cells alone or cells treated with a non-binding human IgG1 were used as controls. As shown in , treatment with avelumab (designated hereafter as α-PD-L1) in the assay mediated only a slight degree of ADCC killing at the highest tested dose in untreated A549 cells, which express relatively low levels of PD-L1 (). However, PD-L1 upregulation via treatment with either TGF-β1 or IFN-γ considerably increased the killing of A549 cells treated with α-PD-L1, and combination treatment with TGF-β1 and IFN-γ further improved ADCC killing beyond either treatment alone (). ADCC assays were also conducted using M7824, which incorporates an IgG1 antibody and is theorized to also mediate ADCC. M7824 was used at equimolar ratios compared with α-PD-L1, and it similarly mediated only a slight amount of ADCC killing in untreated A549 cells (). However, it substantially enhanced the killing of A549 cells treated with TGF-β1 at the highest dose tested, and combination treatment with TGF-β1 and IFN-γ improved M7824-mediated ADCC killing to the greatest extent ().
Figure 4. TGF-β1 treatment sensitizes NSCLC cells to ADCC by PD-L1-targeting agents. ADCC assay of A549 cells with no treatment (NK), control antibody treatment (IgG1), or α-PD-L1 (A) or M7824 (B) treatment at the indicated doses. Tables depict fold increased killing due to ADCC for each dose. Prior to the assay, cells were pre-treated −/+ TGF-β1 (2 ng/mL) for 72 h, IFN-γ (20 ng/mL) for 24 h, or TGF-β1 for 72 h + IFN-γ for the final 24 h. (C) Flow cytometry analysis of PD-L1 expression in H520 cells treated −/+ TGF-β1 (2 ng/mL) for 72 h −/+ IFN-γ (20 ng/mL) for the final 24 h. Graph to right depicts quantified values of PD-L1 expression (% PD-L1 positive × MFI) for each sample. (D) ADCC assay of H520 cells with no treatment (NK), control antibody treatment (IgG1), or α-PD-L1 treatment at the indicated doses. Table depicts fold increased killing due to ADCC for each dose. Prior to the assay, cells were pre-treated −/+ TGF-β1 (2 ng/mL) for 72 h, IFN-γ (20 ng/mL) for 24 h, or TGF-β1 for 72 h + IFN-γ for the final 24 h. *, p < 0.05.
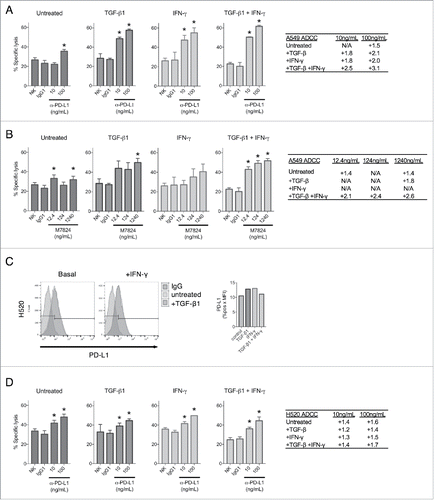
To determine whether PD-L1 upregulation was the primary reason for the observed increase in ADCC efficiency, assays were conducted using H520 cells, which were found to be largely defective in both TGF-β1- and IFN-γ-mediated upregulation of PD-L1 (). Treatment with α-PD-L1 in the assay resulted in only a slight amount of ADCC killing in untreated H520 cells (). In contrast to what was observed with A549 cells, treatment with TGF-β1, IFN-γ, or the combination failed to significantly enhance α-PD-L1-mediated ADCC above that observed in the untreated H520 cells (). These observations imply that TGF-β1 can improve ADCC of tumor cells primarily via target enrichment and not via increased intrinsic susceptibility to NK-mediated lysis. No ADCC killing was observed when M7824 was used with H520 cells untreated or treated with TGF-β1, IFN-γ, or the combination of both. However, it is important to point out that M7824 has been shown by others (Jochems et al., manuscript submitted) to mediate ADCC in the majority of human carcinoma cell lines evaluated. Taken together, these results suggest that TGF-β1-mediated upregulation of PD-L1 in tumor cells can be targeted by ADCC-competent α-PD-L1 agents.
M7824 blocks and reverts exogenous TGF-β1-induced mesenchymalization in NSCLC cells
In contrast to avelumab, the TGFβ-Trap portion of M7824 enables this molecule to inhibit signaling by TGF-β1, -β2 and -β3 (Lan et al., manuscript in preparation). Since TGF-β1 was found to enhance PD-L1 expression in NSCLC cells, it was hypothesized that M7824 may be able to uniquely exploit this phenomenon by targeting tumor cell PD-L1 to subsequently antagonize mesenchymalization driven by TGF-β signaling. This potential utility was first assessed by NanoString-based analysis of gene expression in NSCLC cells untreated vs. treated with TGF-β1 alone or in combination with α-PD-L1 or M7824 for 3 d (termed TGF-β1 blockade). Of the 770 genes profiled, TGF-β1 treatment was found to substantially alter the expression of 56 (7.3%) and 136 (17.7%) genes in PC-9 and A549 cells, respectively (). As expected, simultaneous treatment with α-PD-L1 prevented changes of gene expression in only a small fraction of genes modulated by TGF-β1 (10/56 and 33/136 in PC-9 and A549 cells, respectively) (). However, simultaneous treatment with M7824 was found to prevent the majority of changes induced by TGF-β1, in 43/56 (76.8%) and 121/136 (88.9%) genes in PC-9 and A549 cells, respectively ().
Figure 5. M7824 blocks and reverts exogenous TGF-β1-induced mesenchymal features in NSCLC cells. (A) Heatmap of gene expression analysis from PC-9 and A549 cells treated with TGF-β1 (2 ng/mL) −/+ α-PD-L1 or M7824 (200 ng/mL) for 72 h. Genes whose expression level increased or decreased ≥ 3-fold following treatment with TGF-β1 relative to untreated cells are depicted. (B, C) PC-9 and A549 cells were treated −/+ TGF-β1 (2 ng/mL) −/+ α-PD-L1 or M7824 (200ng/mL) as indicated and EMT markers were assessed by qRT-PCR (B) and immunoblot (C). “Blockade” refers to simultaneous treatment with TGF-β1 −/+ α-PD-L1 or M7824 for 72 h to prevent the induction of EMT. “Reversion” refers to pre-treatment with TGF-β1 for 72 h to induce EMT followed by treatment with TGF-β1 −/+ α-PD-L1 or M7824 for an additional 72 h to revert the established EMT. (D) Confluency assay with PC-9 and A549 cells pre-treated −/+ TGF-β1 (2 ng/mL) for 8 days, and then treated −/+ TGF-β1 −/+ M7824 (200 ng/mL) for the indicated time points. *, p < 0.05. (E) PC-9 cells were pre-treated −/+ TGF-β1 (2 ng/mL) −/+ α-PD-L1 or M7824 (200 ng/mL) for 72 h, and then treated −/+ TGF-β1 −/+ α-PD-L1 or M7824 plus increasing doses of docetaxel for 96 h. (F) PC-9 cells were pre-treated −/+ TGF-β1 (2 ng/mL) for 72 h, and then treated with −/+ TGF-β1 plus increasing doses of indicated chemotherapies for 96 h. “Blockade” refers to simultaneous treatment with TGF-β1 and M7824 (200 ng/mL) during the pre-treatment and during the assay to prevent the induction of EMT, whereas “reversion” refers to pre-treatment with TGF-β1 only and then simultaneous treatment with TGF-β1 and M7824 during the assay to revert the established EMT. Table depicts the IC50 values (ng/mL) for each drug and condition.
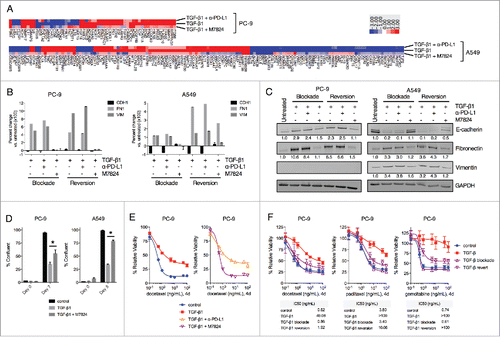
Next, these results were extended by using conventional qRT-PCR- and immunoblot-based approaches to assess phenotypic markers of mesenchymalization. As shown in , TGF-β1 depletion with M7824 was observed to prevent the induction of fibronectin and vimentin in both PC-9 and A549 cells, and prevent the loss of E-cadherin in A549 cells. Similarly, in cells that had already undergone 3 d of TGF-β1-induced EMT, simultaneous treatment with TGF-β1 and M7824 for a subsequent 3 d (termed TGF-β1 reversion) was found to decrease mesenchymal fibronectin and vimentin in both cell lines, and restore E-cadherin expression in A549 cells (). Comparable results were also obtained at the protein level (). In contrast, treatment with α-PD-L1 had no substantial effect on phenotypic marker expression in either the blockade or reversion treatment schemes ( and ). Analogous results were also obtained using HCC4006 cells (Fig. S4A and B). Analysis of expression of phosphorylated and total Smad2 and Smad3 in A549 cells untreated or treated with TGF-β1 alone or in combination with α-PD-L1 or M7824 demonstrated the ability of M7824 to markedly prevent activation of both Smad2 and Smad3 in response to TGF-β1 (Fig. S4C).
Finally, investigation of the functional characteristics of cells treated with TGF-β1 alone or in combination with M7824 was undertaken. TGF-β1 reversion with M7824 was found to rescue the decrease in cell proliferation induced by TGF-β1 alone in PC-9 and A549 cells (). Next, TGF-β1-treated PC-9 were found to be resistant to the cytotoxicity of the chemotherapy drug docetaxel (). Comparison between α-PD-L1 and M7824 revealed that only M7824 restored the sensitivity of TGF-β1-treated PC-9 cells to killing docetaxel (). M7824 treatment also proved very effective in blocking or reverting TGF-β1-induced resistance to killing by docetaxel, paclitaxel, and gemcitabine in PC-9 cells (), and to killing by docetaxel in A549 and HCC4006 cells (Fig. S4D). Altogether, these results suggest that M7824 can effectively antagonize TGF-β1-mediated phenotypic and functional changes in NSCLC cells.
M7824 antagonizes endogenous TGF-β1-induced mesenchymalization in NSCLC cells
The ability of M7824 to reduce mesenchymal features in the absence of exogenous TGF-β1 was also assessed. HCC4006 and H460 cell lines were chosen for these experiments as these lines were found to secrete their own TGF-β1 (). Treatment of these cells with M7824 was found to upregulate the epithelial marker OCLN at the mRNA level in both cell lines (). In HCC4006 cells, M7824 elicited a marked reduction in several mesenchymal-associated genes, including CDH2, FN1, VIM, SNAI1 and ZEB1 (encoding for N-cadherin, fibronectin, vimentin, snail and the zinc finger E-box binding homeobox 1), whereas H460 cells showed a more modest response with significant reductions in only CDH2 and FN1 transcripts (). Protein expression was also evaluated using M7824 and SD-208 (as a positive control for TGF-β signaling inhibition), and both agents provoked a substantial reduction of vimentin expression in HCC4006 cells and of fibronectin expression in H460 cells (). Further examination of HCC4006 cells showed that M7824 decreased vimentin expression in a dose-dependent manner, whereas treatment with α-PD-L1 had no effect (). HCC4006 cells also showed a modest increase and decrease of epithelial occludin and mesenchymal N-cadherin, respectively, and a reduction of snail in response to M7824 treatment (). Occludin and N-cadherin protein were undetectable in H460 cells, and the expression of snail did not change in response to M7824 ().
Figure 6. M7824 reverts endogenous TGF-β1-induced mesenchymal features in NSCLC cells. (A) ELISA for TGF-β1 protein secretion from HCC4006 and H460 cells. (B) qRT-PCR analysis of selected EMT markers from HCC4006 and H460 cells treated with M7824 (2 μg/mL) for 72 h. *, p < 0.05. (C) Immunoblot analysis of mesenchymal markers in HCC4006 and H460 cells treated with SD-208 (1 μM) or M7824 (2 μg/mL) for 72 h. (D) Immunoblot analysis of vimentin expression in HCC4006 cells treated with increasing doses of M7824 for 72 h. (E) Immunoblot analysis of indicated markers in HCC4006 and H460 cells treated with M7824 (2 μg/mL) for 72 h. (F) Gene expression analysis from a human EMT gene array of HCC4006 and H460 cells treated with α-PD-L1 or M7824 (2 μg/mL) for 72 h. Red and blue depict transcripts that were upregulated or downregulated ≥ 0.5-fold, respectively, by treatment with M7824 relative to α-PD-L1. *, genes that were upregulated or downregulated by M7824 in both cell lines.
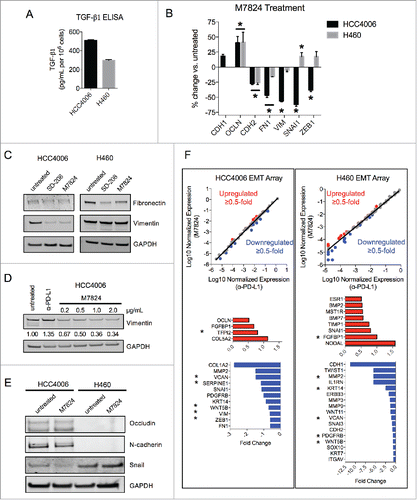
These observations were then broadened by sampling the expression of a panel of 84 EMT-related genes from an EMT gene expression array. As shown in , treatment with M7824 resulted in a differential gene expression pattern relative to treatment with α-PD-L1 in both HCC4006 and H460 cells, and more genes were found to be reduced than increased. Several mesenchymal-associated genes were downregulated by M7824 in the EMT array, including MMP2, SNAI1, VIM, ZEB1, FN1 in HCC4006 cells, and TWIST1, MMP2, MMP3, MMP9, and CDH2 in H460 cells (). Only 5 genes were reduced in both cell lines (, asterisks), indicating that gene expression in response to M7824 varies between cell lines. Collectively, these data suggest that M7824 antagonizes endogenous TGF-β1-induced mesenchymalization in NSCLC cells.
M7824 reduces mesenchymal features in NSCLC tumor xenografts
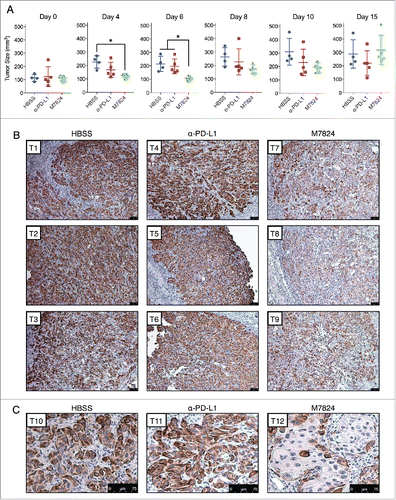
To determine the effects of M7824 upon tumor growth and phenotype in vivo, HCC4006 cell line xenografts were grown in C.B-17 SCID mice that lack adaptive immune cells (T and B cells) but still retain innate immunity. HCC4006 cells were chosen because these cells lost mesenchymal features in response to M7824 in the absence of exogenous TGF-β1 () and were found to express appreciable PD-L1 and vimentin in vivo (Fig. S4C). Tumor-bearing mice were dosed with either vehicle alone (HBSS), α-PD-L1, or M7824 for a period of 15 d. As shown in , M7824 induced a statistically significant suppression of tumor growth early in the study (days 4 and 6), an effect that was lost by the completion of the study (day 15). Although the reason for the transitory effect of M7824 is not known, the absence of an adaptive immune response in this model precludes any conclusions about the antitumor capacity of these agents. Instead, the model was used to evaluate tumor phenotype by immunohistochemical analysis. Vimentin expression was used as an indicator of tumor mesenchymalization because this marker was observed to be strongly downregulated in response to M7824 in the HCC4006 cells in vitro (). Immunohistochemistry (IHC) staining for vimentin revealed strong positivity in nearly every tumor cell of the HBSS- and α-PD-L1-treated tumors (). However, a substantial reduction in vimentin expression was observed in most of the tumor cells in the M7824-treated tumors, with some cells exhibiting nearly negative staining (). Vimentin staining also revealed striking alterations in the histological pattern of tumor growth; the HBSS- and α-PD-L1-treated tumors exhibited mostly clusters of variably-sized and irregularly-shaped tumor cells, with irregularly-shaped nuclei ( and ). In contrast, a sizeable portion of the M7824-treated tumor cells expressed lower levels of vimentin and appeared larger in size, with larger and more regularly-shaped nuclei, and a more organized tissue architecture reminiscent of a more-differentiated phenotype ( and ). These observations indicate that treatment with M7824, but not α-PD-L1, reduces tumor cell mesenchymalization in vivo.
Figure 7. M7824 reverts TGF-β1-induced mesenchymal features in vivo. (A) Measurements of tumor size for the HCC4006 xenografts at various time points. *, p < 0.05. (B) Representative IHC staining for vimentin expression from 3 tumors per treatment group. Scale bar = 75 μm. (C) Magnified view of representative IHC staining for vimentin expression from a fourth tumor from each treatment group. Scale bar = 75 μm.
Discussion
Plasticity in tumor cell phenotype has increasingly gained recognition as a central mechanism that drives cancer progression and therapy resistance. In recent years, multiple reports in various tumor types have described a connection between tumor cell mesenchymalization and PD-L1 expression,Citation30,41,42 particularly in lung cancer.Citation28,32,43,44 In the current study, a mechanistic basis for this connection was determined in the context of TGF-β signaling, in which treatment with TGF-β1 was found to simultaneously induce tumor cell EMT and elevate PD-L1 expression in several NSCLC cell lines.
TGF-β-mediated upregulation of PD-L1 was previously shown in dendritic cells,Citation45,46 CD8+ T cells,Citation47 and normal and cancerous breast cell lines.Citation30 The upregulation of PD-L1 by TGF-β has also been previously reported with 2 EGFR mutant NSCLC cell lines where TGF-β was used in combination with FGF-2.Citation31 The findings presented here have expanded upon these earlier observations by further characterizing this phenomenon in multiple NSCLC cell lines, including in KRAS and EGFR mutant cell lines. The data presented here also demonstrated that TGF-β1-mediated upregulation of PD-L1 can similarly take place in cell lines that harbor KRAS (A549, H441) or EGFR (PC-9, H3255, HCC4006, HCC827) mutations, thus implying that TGF-β1-mediated immunosuppression via upregulation of PD-L1 does not depend upon the presence or absence of these oncogenic mutations. Moreover, the present study demonstrates a novel functional synergy between TGF-β1 and IFN-γ in upregulating not only PD-L1 but also PD-L2 expression in NSCLC cells. It is important to point out that the results of our study differ from previously reported results in which normal murine renal tubular epithelial cells were shown to downregulate rather than upregulate PD-L1 expression in response to TGF-β.Citation48 Although the reason for this difference is not known at this time, it remains to be determined whether the use of murine vs. human cells, or the use of normal vs. cancerous epithelial cells could account for the different activity of TGF-β in the modulation of PD-L1.
Another novel aspect reported here relates to the mechanism of control of PD-L1 expression by TGF-β signaling, which was found to occur through transcriptional activation of the CD274 gene as opposed to increased mRNA stability. Investigations by others have reported the regulation of PD-L1 mRNA stability by miRNAs, including miR-200,Citation28 miR-34,Citation37 and miR-138–5p.Citation38 TGF-β has been shown to repress each of these miRNAs,Citation49–51 which would be predicted to stabilize PD-L1 mRNA; however, no enhancement in PD-L1 mRNA stability was observed in the studies reported here. These divergent results may be due to differences in the dose and/or duration of TGF-β treatment and/or due to cell line-dependent differences in the downstream events following TGF-β signaling. Whether a potential synergy exists between these 2 mechanisms of PD-L1 regulation remains to be investigated.
Sequence analysis identified at least 7 previously undescribed potential SBEs within a region 2kb upstream of the TSS, and the loss of these regulatory elements in a shorter promoter construct abrogated any transcriptional activation of the CD274 gene by TGF-β1, but not by IFN-γ. It is tempting to speculate that these 7 sequences are functional SBEs, but it remains possible that other sequences within this 2kb region are responsible for the upregulation of PD-L1 by TGF-β1. Nevertheless, these data suggest that TGF-β1 and IFN-γ can cooperate in activating the CD274 gene through different regulatory sites, and provide a basis for the observed synergistic upregulation of PD-L1 following treatment with both cytokines. In addition, TGF-β1-mediated activation of PD-L1 expression was remarkably dependent upon Smad2 activation, as neither Smad3 nor several non-canonical signaling pathways were found to play a role in the regulation of PD-L1. Both Smad2 and Smad3 oligomerize with Smad4 in response to TGF-β signaling, and both complexes bind to DNA at conserved SBEs. Previous reports, however, have determined that these Smads have both overlapping and nonoverlapping target gene binding specificities, which results in differential profiles of transcriptional activation.Citation52,53 To our knowledge, this is the first time that Smad2 has been reported to regulate PD-L1 expression in tumor cells. Interestingly, TGF-β1 was very recently found to upregulate PD-1 on antigen-specific T cells via a transcriptional mechanism in which Smad3 was found to bind to SBEs located within the PD-1 gene promoter.Citation54 When considered together with the data reported here, a model can be theorized in which TGF-β signaling in the lung tumor microenvironment induces PD-1 pathway-mediated immunosuppression by differentially driving both PD-1 expression (via Smad3) on antigen-specific T cells and PD-L1 expression (via Smad2) on tumor cells.
The studies reported here also indicate a potential association between elevated PD-L1 expression and active TGF-β signaling (p-Smad2) in some human tumor samples. However, it should be noted that this association was imperfect, most likely due to the known phenotypic and genotypic heterogeneity of human tumors. For example, we observed that a proportion of PD-L1-negative tumors nevertheless exhibited appreciable staining for p-Smad2, implying that other factors may play a role in disrupting the control of PD-L1 by TGF-β signaling. Conversely, certain PD-L1-positive tumors stained only weakly for p-Smad2, thereby highlighting the well-known potential for other factors (e.g., IFN-γ signaling,Citation40 EGFR activation,Citation55 etc.) to predominate in regulating PD-L1 expression. Future studies incorporating the analysis of large numbers of human tumor samples will be undertaken to further validate these notions.
As a fusion protein, M7824 was engineered to be uniquely capable of antagonizing both PD-1/PD-L1 interaction and TGF-β signaling. Though originally developed to inhibit TGF-β-induced immunosuppression, M7824 has also attenuated NSCLC mesenchymalization driven by TGF-β; this novel attribute has been identified in the studies reported here. Tumor cell mesenchymalization via TGF-β is associated with enhanced expression of mesenchymal genes, slower progression through the cell cycle, and enhanced therapy resistance.Citation56 M7824 was found to prevent mesenchymal gene expression in tumor cells treated with exogenous TGF-β1, and it reverted established EMT characteristics from both exogenous and endogenously produced TGF-β1. M7824 also impeded the functional effects of TGF-β signaling by enhancing cell proliferation and restoring tumor cell sensitivity to various chemotherapy drugs. This finding agrees with a previous report in which TGF-β signaling inhibition resulted in chemosensitization of NSCLC cells.Citation57 Finally, evaluation in a partially immunocompromised NSCLC xenograft model in vivo revealed that M7824 reduced mesenchymal vimentin protein expression and altered tumor histology to appear more like epithelial tissue. Future studies should be undertaken to evaluate M7824 in combination with other antineoplastic agents.
In addition to describing the regulatory control of PD-L1 by TGF-β signaling, it was determined that this mechanism can be exploited by PD-L1-targeting agents to kill tumor cells through ADCC. Experiments conducted here found that upregulation of PD-L1 by TGF-β1 and/or IFN-γ led to enhanced ADCC mediated by M7824. At present, avelumab has been approved for the treatment of MCC and 2 indications of bladder cancer, and is undergoing several Phase 3 clinical trials in multiple tumor types. M7824 was recently evaluated in the dose escalation part of a Phase I clinical trialCitation34 (Strauss et al., manuscript in preparation) and is currently being evaluated in various indications. Investigations now indicate that M7824 possesses at least 4 antitumor attributes, including (1) the ability to block the immunosuppressive PD-1/PD-L1 checkpoint; (2) the potential for direct killing of tumor cells by ADCC; (3) the ability to inhibit TGF-β-induced suppression of immune cells; and (4) the ability to disrupt TGF-β-induced tumor cell mesenchymalization, whereas avelumab possesses only the first 2 qualities. Since M7824 inhibits TGF-β signaling, our data on the association between TGF-β signaling and PD-L1 expression also suggest that prolonged exposure to M7824 could subsequently reduce PD-L1 expression. Though this may initially appear counterintuitive from the point of view of using this bifunctional agent, it must be noted that from a clinical perspective, expression of PD-L1 in a tumor by itself is a detrimental factor in that PD-L1 could suppress an antitumor T-cell immune response. Thus, reducing PD-L1 expression by TGF-β trapping, as reported with M7824, may well be clinically beneficial to the patient as it would alleviate PD-L1-dependent immune suppression.
Interestingly, evaluation of TGF-β small molecule inhibitors in the past has resulted in toxicity in patients,Citation58 yet M7824 was reported to have an acceptable toxicity profile in a Phase I study, where the maximum tolerated dose was not reachedCitation34,35 (Strauss et al., manuscript in preparation). While the use of systemic inhibitors of TGF-β could lead to toxicities, it is plausible that preferential tumor localization of M7824 via the anti-PD-L1 portion of this molecule could lead to minimized systemic toxicity while also reducing tumor TGF-β levels to enhance local antitumor immune responses.
In summary, this investigation has demonstrated that TGF-β1 serves as a molecular link between tumor cell mesenchymalization and elevated PD-L1 expression in NSCLC, suggesting that upregulation of tumor cell PD-L1 is a novel mechanism of TGF-β1-induced immunosuppression in NSCLC. In addition, this phenomenon was exploited to kill tumor cells using ADCC-inducing agents that target PD-L1. Finally, tumor cell mesenchymalization was effectively antagonized using M7824, a bifunctional agent that targets both PD-L1 and TGF-β signaling, but not α-PD-L1. These findings provide supporting rationale for the development of M7824 for patients with NSCLC, and potentially other malignancies, including patients who have progressed on PD-L1 or PD-1 inhibitors.
Materials and methods
Cell culture
The following human NSCLC cell lines were obtained from the American Type Culture Collection (ATCC, Manassas, VA): A549, H226, H441, H520, HCC827, and HCC2935. PC-9, H3255, and HCC4006 cells were kindly provided by Dr. Udayan Guha (NCI, NIH, Bethesda, MD). All cell lines were cultured in RPMI supplemented with 10% fetal bovine serum, and were used within 6 months of receipt or authenticated by STR profiling (Biosynthesis, Lewisville, TX). The following cytokines were obtained commercially: human recombinant IFN-γ (PeproTech, Rocky Hill, NJ), human platelet-derived TGF-β1 and recombinant human TGF-β1 (R&D Systems, Minneapolis, MN). The 2 sources of TGF-β1 induced identical responses in treated cells.
Reagents
Avelumab (designated as α-PD-L1) and M7824 were generously provided by EMD Serono (Billerica, MA). The following inhibitors were used: actinomycin D (RNA synthesis inhibitor, Sigma-Aldrich, St. Louis, MO), SD-208 (TGF-βRI inhibitor, R&D Systems), SIS3 (Smad3 inhibitor, Tocris Bioscience, Bristol, UK), wortmannin (PI3K inhibitor, EMD Millipore, Darmstadt, Germany), U0126 (MEK1/2 inhibitor, Cell Signaling Technology, Danvers, MA), SB203580 (p38 MAPK inhibitor, Selleckchem, Houston, TX), BMS-345541 (NF-κB inhibitor, Sigma-Aldrich), and S31–201 (STAT3 inhibitor, Sigma-Aldrich). The following chemotherapy drugs were used: docetaxel (Sanofi-Aventis, Paris, France), paclitaxel (Bristol-Myers Squibb, New York, NY), and gemcitabine (Tocris Bioscience).
Quantitative real-time PCR
Total RNA was prepared using the PureLink RNA Mini Kit (Thermo Fisher Scientific, Waltham, MA) and reverse transcribed with the XLAScript cDNA MasterMix (WordWide Life Sciences, Hamilton, NJ). The resulting cDNA (10 ng) was amplified in triplicate using FastStart Universal Probe Master (Rox) reaction mix (Roche, Basel, Switzerland) in an Applied Biosystems 7500 Real-Time PCR System (Thermo Fisher Scientific) with the following TaqMan human gene expression assays (Thermo Fisher Scientific): CDH1 (Hs01013959_m1), OCLN (Hs00170162_m1), CDH2 (Hs00983062_m1), FN1 (Hs00415006_m1), VIM (Hs00958116_m1), SNAI1 (Hs00195591_m1), SNAI2 (Hs00161904_m1), ZEB1 (Hs00232783_m1), CD274 (Hs01125301_m1), PDCD1LG2 (Hs01057777_m1), and GAPDH (4326317E). Expression of each target gene relative to GAPDH was calculated as 2−[Ct(GAPDH) – Ct(target gene)].
Expression of a large panel of 770 genes related to EMT, angiogenesis, extracellular matrix, and metastasis was evaluated in purified RNA samples from indicated tumor cells using the nCounter PanCancer Progression Panel and nSolver Analysis Software (NanoString Technologies, Seattle, WA). To measure the expression of a smaller panel of 84 EMT-related genes, cDNA (3ng) was aliquoted into the wells of a RTCitation2 Profiler PCR Array (Qiagen, Germantown, MD) plate for the Human EMT PCR Array and amplified using SYBR Green reagent (Roche) in an Applied Biosystems 7500 Real-Time PCR System (Thermo Fisher Scientific).
Immunoblot analysis
Protein lysates from cell lines were prepared with RIPA lysis buffer (Santa Cruz Biotechnology, Santa Cruz, CA) supplemented with 1mM phenylmethanesulfonyl fluoride (Sigma-Aldrich). Lysates (25 μg) were resolved by SDS-PAGE and transferred to nitrocellulose membranes using standard techniques. Membranes were incubated overnight at 4°C with the following primary antibodies: E-cadherin, vimentin, fibronectin (BD Biosciences, East Rutherford, NJ); Smad2, Smad3 (Cell Signaling Technology); pan-actin (clone Ab-5, Thermo Fisher Scientific); GAPDH (Santa Cruz Biotechnology). Membranes were then incubated with appropriate secondary antibodies conjugated with IRDye and imaged using the Odyssey Infrared Imaging System (LI-COR Biosciences, Lincoln, NE). Quantification was performed using ImageJ (NIH, Bethesda, MD).
Flow cytometry
Cells were stained with isotype control IgG antibody, APC-conjugated anti-PD-L1 antibody (CD274, B7-H1; BD Biosciences) or PE-conjugated anti-PD-L2 antibody (CD273, B7-DC, Thermo Fisher Scientific) diluted in 1X PBS for 30 min at 4°C. Cells were then washed, and fluorescence was measured using a FACSCalibur or FACSVerse cell analyzer (BD Biosciences). Data analysis was performed using FlowJo single cell analysis software (Tree Star, Ashland, OR). Normalized mean fluorescent intensity (nMFI) was computed per the following equation:
Promoter reporter assay
Cells were transfected with 0.5 μg of pEZX-PG02 plasmid (GeneCopoeia, Rockville, MD) encoding Gaussia luciferase fused to either the control human GAPDH or the human CD274 gene promoter (-2039 to +62 relative to the TSS) using 1.5 μL of FuGENE HD (Promega, Madison, WI) transfection reagent, or with 0.5 μg of LightSwitch Promoter Reporter GoClone plasmids (SwitchGear Genomics, Menlo Park, CA) encoding Renilla luciferase fused to either the control human ACTB or the human CD274 gene promoter (-778 to +100 relative to the TSS) using 1.5 μL of FuGENE HD (Promega) transfection reagent. Cells were incubated for 24 h, and were then seeded in quadruplicate into white-walled 96-well culture plates to perform the promoter assay. An identical plate of cells was seeded in triplicate to perform cell number normalization. Cells were treated with −/+ TGF-β1 for 48 h and −/+ IFN-γ for the final 24–48 h before use. On the day of the assay, promoter luminescence was measured using the Secrete-Pair Gaussia Luciferase Assay Kit (GeneCopoeia) or the Renilla-Glo luciferase assay system (Promega), and cell number was measured using the CellTiter-Glo assay (Promega) per the manufacturer's instructions. Promoter measurements were corrected for background, normalized to the CellTiter-Glo signal, and then CD274 promoter activity was normalized to the average GAPDH or ACTB promoter activity for each corresponding treatment group.
RNA interference
For siRNA knockdown experiments, 1.0 × 10⁵ cells/well were seeded into 6-well plates and were transfected with 100nM of ON-TARGETplus SMARTpool siRNAs (GE Healthcare, Little Chalfont, UK) specific for Smad2, Smad3, or a non-targeting control using 4 μL DharmaFECT 2 transfection reagent (GE Healthcare) per transfection according to the manufacturer's instructions. Cells were incubated overnight, and then treated with TGF-β1 for 3 d before use.
Immunohistochemistry
For microarray staining, lung tumor arrays T047 and LC819t were purchased from US Biomax (Rockville, MD). For xenograft staining, formalin-fixed paraffin-embedded samples of tumor xenografts were prepared using routine procedures. Staining for PD-L1 was accomplished using the SP142 antibody (Spring Bioscience, Pleasanton, CA) following a previously published procedure.Citation59 Staining for phosphorylated Smad2 (p-Smad2) used the 44–244G antibody (Thermo Fisher Scientific), and staining for vimentin used the SP20 antibody (GeneTex, Irvine, CA). Briefly, slides were baked at 65°C for 40–60 min, deparaffinized with xylene, and rehydrated with a graded ethanol series. For PD-L1 and vimentin antigen retrieval, tissue sections were immersed in a Tris-EDTA buffer (10 mM Tris base, 1mM EDTA, and 0.05% Tween20) adjusted to pH 9 at 90–100°C for 12 min. For p-Smad2 antigen retrieval, tissue sections were immersed in Antigen Unmasking Solution (pH 6, Vector Laboratories, Burlingame, CA) at 90°C for 20 min. After cooling, slides were subjected to peroxide blocking (1% peroxide for 5 min for PD-L1, 3% peroxide for 5–20 min for p-Smad2 and vimentin), permeabilization with 0.1% TritonX-100 (p-Smad2 and vimentin only), and protein serum blocking (1% goat serum + 4% BSA for 5 min for PD-L1, 100% horse serum for 30 min for p-Smad2 and vimentin). Tissue sections were then incubated with primary antibody diluted 1:100 (PD-L1, p-Smad2) or 1:250 (vimentin) in their respective blocking buffers for 90 min. Detection was enabled by incubating slides with ImmPRESS HRP-labeled anti-rabbit IgG peroxidase polymer detection kit (Vector Laboratories, Burlingame, CA) for 30 min, incubation with DAB peroxidase substrate (Vector Laboratories) for <5 min, and counterstaining with hematoxylin. Staining was imaged for each sample using a DMI4000 B microscope (Leica Biosystems, Wetzlar, Germany). For the LC819t tumor array, each tissue section was evaluated for estimated percent tumor cell positivity (0–33%, 34–66%, 67–100%) and tumor cell intensity (0, 1+, 2+, 3+) by 2 independent investigators.
ADCC assay
For ADCC assays, cells were pre-treated −/+ TGF-β1 (2 ng/mL) for 72 h −/+ IFN-γ for the final 24 h before use. On the day of the assay, peripheral blood from healthy donors was obtained from the NIH Blood Bank (Bethesda, MD) under the appropriate Institutional Review Board approval and informed consent. NK cells were isolated using human CD56+ MicroBeads (Miltenyi Biotec, Bergisch Gladbach, Germany). Target cells were labeled with 10 μM calcein AM (Thermo Fisher Scientific), seeded in triplicate at 4.0 × 10³ cells/well into black-walled 96-well culture plates, treated with a control non-binding α-PD-L1 mutant IgG1 (100 ng/mL) or with various doses of α-PD-L1 or M7824, and co-cultured with effector NK cells at a 5:1 effector-to-target ratio. Following 16 h incubation, 2 μg/mL propidium iodide (PI) was added to each well, plates were visualized using a Celigo S Cell Imaging Cytometer (Nexcelom Bioscience, Lawrence, MA), and live target cells (calcein AM+/PtdIns-) were counted for each well. Specific lysis was calculated as follows: % specific lysis = 100 − [(average live target countexperimental / average live target countcontrol) × 100].
Proliferation confluency assay
Cells were pretreated −/+ TGF-β1 for 8 d before use. On the day of the assay, 1000 cells/well were seeded in 6 replicates into 96-well plates and then treated with −/+ TGF-β1 −/+ M7824 (200 ng/mL) for an additional 5–7 d. Cell culture media with respective treatments was replenished every 3–4 d. Percent cell confluency was measured using a Celigo S Cell Imaging Cytometer (Nexcelom Bioscience, Lawrence, MA).
Chemotherapy viability assay
For blockade experiments, cells were pretreated with TGF-β1 (2 ng/mL) −/+ α-PD-L1 or M7824 (200 ng/mL) for 72 h before use. For reversion experiments, cells were pretreated with TGF-β1 (2 ng/mL) alone for 72 h before use. On the day of the assay, cells were seeded in triplicate at 2.0 × 10³ cells/well in white-walled 96-well plates and treated with increasing doses of chemotherapy drug −/+ TGF-β1 −/+ α-PD-L1 or M7824 for 4 d. Cell viability was assessed using the CellTiter-Glo luminescent viability assay (Promega) per the manufacturer's instructions.
ELISA
Cells (1.0 × 10⁶) were seeded into the wells of a 12-well plate and grown for 24 h in serum-free media. Culture supernatants were collected and assayed in duplicate for TGF-β1 levels using the Human TGF-β1 Quantikine ELISA Kit (R&D Systems, Minneapolis, MN) per the manufacturer's instructions.
Xenograft antitumor assay
All experimental studies were performed under approval of the NIH Intramural Animal Care and Use Committee. All mice were housed and maintained in microisolator cages under specific pathogen-free conditions and in accordance with the Association for Assessment and Accreditation of Laboratory Animal Care (AAALAC) guidelines. To establish subcutaneous tumors, 6-week old female C.B-17 SCID mice (Taconic Biosciences, Hudson, NY) were inoculated with a suspension of HCC4006 cells (4.0 × 10⁶ per mouse) in 100 μL of Hank's balanced salt solution (1X HBSS) admixed with Matrigel 50% (v/v). Tumors grew for 6 d before randomizing into control (HBSS) or drug (α-PD-L1 or M7824) groups of 4–5 mice per group with an average initial tumor volume of ∼100 mmCitation3 in each group. α-PD-L1 and M7824 were diluted in 1X HBSS and dosed at equimolar ratios (400 and 492 μg per mouse, respectively). After randomizing (day 0), mice were dosed with 100 μL vehicle or drug by intraperitoneal injection on days 0, 2, 4, 6, 8, 10, and 14. Tumor sizes were measured using calipers and recorded before each injection. Tumor volumes were estimated using the formula (length × widthCitation2) / 2, where length was the longer of the 2 measurements. Upon completion of the study on day 15, mice were killed and tumors were harvested and prepared for immunohistochemical analysis.
Statistical analysis
Data were analyzed using GraphPad Prism (GraphPad Software, La Jolla, CA), and p < 0.05 was considered significant. Comparisons between 2 values were conducted by T-test. Non-linear regressions were compared by 2-way ANOVA. Graphs depict the mean ± SD from one representative experiment performed in triplicate.
Disclosure of potential conflicts of interest
NIH authors have declared that no conflict of interest exists.
Authors contribution
JMD designed research studies, conducted experiments, acquired and analyzed data, and wrote the manuscript. CD and KKM conducted experiments, acquired and analyzed data. JLG and JS provided reagents and wrote the manuscript. CP designed and supervised studies, analyzed data, and wrote the manuscript.
KONI_A_1349589_s02.pptx
Download MS Power Point (7.2 MB)Acknowledgments
The authors gratefully acknowledge their financial support from the Intramural Research Program of the Center for Cancer Research, National Cancer Institute (NCI), National Institutes of Health, and from a Cooperative Research and Development Agreement (CRADA) between the NCI and EMD Serono, Inc. The authors thank Debra Weingarten for her editorial assistance in the preparation of this manuscript.
Funding
This research was supported by the Intramural Research Program of the Center for Cancer Research, National Cancer Institute (NCI), National Institutes of Health, and by a Cooperative Research and Development Agreement (CRADA) between the NCI and EMD Serono, Inc.
References
- Lynch TJ, Bondarenko I, Luft A, Serwatowski P, Barlesi F, Chacko R, Sebastian M, Neal J, Lu H, Cuillerot JM, et al. Ipilimumab in combination with paclitaxel and carboplatin as first-line treatment in stage IIIB/IV non-small-cell lung cancer: results from a randomized, double-blind, multicenter phase II study. J Clin Oncol 2012; 30(17):2046-2054; PMID:22547592; https://doi.org/10.1200/JCO.2011.38.4032
- Topalian SL, Hodi FS, Brahmer JR, Gettinger SN, Smith DC, McDermott DF, Powderly JD, Carvajal RD, Sosman JA, Atkins MB, et al. Safety, activity, and immune correlates of anti-PD-1 antibody in cancer. N Engl J Med 2012; 366(26):2443-2454; PMID:22658127; https://doi.org/10.1056/NEJMoa1200690
- Brahmer JR, Tykodi SS, Chow LQ, Hwu WJ, Topalian SL, Hwu P, Drake CG, Camacho LH, Kauh J, Odunsi K, et al. Safety and activity of anti-PD-L1 antibody in patients with advanced cancer. N Engl J Med 2012; 366(26):2455-2465; PMID:22658128; https://doi.org/10.1056/NEJMoa1200694
- Freeman GJ, Long AJ, Iwai Y, Bourque K, Chernova T, Nishimura H, Fitz LJ, Malenkovich N, Okazaki T, Byrne MC, et al. Engagement of the PD-1 immunoinhibitory receptor by a novel B7 family member leads to negative regulation of lymphocyte activation. J Exp Med 2000; 192(7):1027-1034; PMID:11015443; https://doi.org/10.1084/jem.192.7.1027
- Latchman Y, Wood CR, Chernova T, Chaudhary D, Borde M, Chernova I, Iwai Y, Long AJ, Brown JA, Nunes R, et al. PD-L2 is a second ligand for PD-1 and inhibits T cell activation. Nat Immunol 2001; 2(3):261-268; PMID:11224527; https://doi.org/10.1038/85330
- Selenko-Gebauer N, Majdic O, Szekeres A, Hofler G, Guthann E, Korthauer U, Zlabinger G, Steinberger P, Pickl WF, Stockinger H, et al. B7-H1 (programmed death-1 ligand) on dendritic cells is involved in the induction and maintenance of T cell anergy. J Immunol 2003; 170(7):3637-3644; PMID:12646628; https://doi.org/10.4049/jimmunol.170.7.3637
- Dong H, Strome SE, Salomao DR, Tamura H, Hirano F, Flies DB, Roche PC, Lu J, Zhu G, Tamada K, et al. Tumor-associated B7-H1 promotes T-cell apoptosis: a potential mechanism of immune evasion. Nat Med 2002; 8(8):793-800; PMID:12091876
- Konishi J, Yamazaki K, Azuma M, Kinoshita I, Dosaka-Akita H, Nishimura M. B7-H1 expression on non-small cell lung cancer cells and its relationship with tumor-infiltrating lymphocytes and their PD-1 expression. Clin Cancer Res 2004; 10(15):5094-5100; PMID:15297412; https://doi.org/10.1158/1078-0432.CCR-04-0428
- Chen Z, Fillmore CM, Hammerman PS, Kim CF, Wong KK. Non-small-cell lung cancers: a heterogeneous set of diseases. Nat Rev Cancer 2014; 14(8):535-546; PMID:25056707; https://doi.org/10.1038/nrc3775
- Miller KD, Siegel RL, Lin CC, Mariotto AB, Kramer JL, Rowland JH, Stein KD, Alteri R, Jemal A. Cancer treatment and survivorship statistics, 2016. CA Cancer J Clin 2016; 66(4):271-289; PMID:27253694; https://doi.org/10.3322/caac.21349
- Borghaei H, Paz-Ares L, Horn L, Spigel DR, Steins M, Ready NE, Chow LQ, Vokes EE, Felip E, Holgado E, et al. Nivolumab versus docetaxel in advanced nonsquamous non-small-cell lung cancer. N Engl J Med 2015; 373(17):1627-1639; PMID:26412456; https://doi.org/10.1056/NEJMoa1507643
- Paz-Ares L, Horn L, Borghaei H, Spigel DR, Steins M, Ready N, Chow LQ, Vokes EE, Felip E, Holgado E, Barlesi F, et al. Phase III, randomized trial (CheckMate 057) of nivolumab (NIVO) versus docetaxel (DOC) in advanced non-squamous cell (non-SQ) non-small cell lung cancer (NSCLC). J Clin Oncol 2015; 33(18_suppl):LBA109; PMID:28147722; https://doi.org/10.1200/jco.2015.33.18_suppl.lba109
- Boyerinas B, Jochems C, Fantini M, Heery CR, Gulley JL, Tsang KY, Schlom J. Antibody-dependent cellular cytotoxicity activity of a novel Anti-PD-L1 antibody Avelumab (MSB0010718C) on human tumor cells. Cancer Immunol Res 2015; 3(10):1148-1157; PMID:26014098; https://doi.org/10.1158/2326-6066.CIR-15-0059
- Gulley JL, Rajan A, Spigel DR, Iannotti N, Chandler J, Wong DJ, Leach J, Edenfield WJ, Wang D, Grote HJ, et al. Avelumab for patients with previously treated metastatic or recurrent non-small-cell lung cancer (JAVELIN Solid Tumor): dose-expansion cohort of a multicentre, open-label, phase 1b trial. Lancet Oncol 2017; 18(5):599-610; PMID:28373005; https://doi.org/10.1016/S1470-2045(17)30240-1
- Heery CR, O'Sullivan-Coyne G, Madan RA, Cordes L, Rajan A, Rauckhorst M, Lamping E, Oyelakin I, Marte JL, Lepone LM, et al. Avelumab for metastatic or locally advanced previously treated solid tumours (JAVELIN Solid Tumor): a phase 1a, multicohort, dose-escalation trial. Lancet Oncol 2017; 18(5):587-598; PMID:28373007; https://doi.org/10.1016/S1470-2045(17)30239-5
- Taube JM, Klein A, Brahmer JR, Xu H, Pan X, Kim JH, Chen L, Pardoll DM, Topalian SL, Anders RA. Association of PD-1, PD-1 ligands, and other features of the tumor immune microenvironment with response to anti-PD-1 therapy. Clin Cancer Res 2014; 20(19):5064-5074; PMID:24714771; https://doi.org/10.1158/1078-0432.CCR-13-3271
- Tumeh PC, Harview CL, Yearley JH, Shintaku IP, Taylor EJ, Robert L, Chmielowski B, Spasic M, Henry G, Ciobanu V, et al. PD-1 blockade induces responses by inhibiting adaptive immune resistance. Nature 2014; 515(7528):568-571; PMID:25428505; https://doi.org/10.1038/nature13954
- Herbst RS, Soria JC, Kowanetz M, Fine GD, Hamid O, Gordon MS, Sosman JA, McDermott DF, Powderly JD, Gettinger SN, et al. Predictive correlates of response to the anti-PD-L1 antibody MPDL3280A in cancer patients. Nature 2014; 515(7528):563-567; PMID:25428504; https://doi.org/10.1038/nature14011
- Kalluri R, Weinberg RA. The basics of epithelial-mesenchymal transition. J Clin Invest 2009; 119(6):1420-1428; PMID:19487818; https://doi.org/10.1172/JCI39104
- David JM, Dominguez C, Palena C. Pharmacological and immunological targeting of tumor mesenchymalization. Pharmacol Ther 2017; 170:212-225; PMID:27916651; https://doi.org/10.1016/j.pharmthera.2016.11.011
- Kudo-Saito C, Shirako H, Takeuchi T, Kawakami Y. Cancer metastasis is accelerated through immunosuppression during Snail-induced EMT of cancer cells. Cancer Cell 2009; 15(3):195-206; PMID:19249678; https://doi.org/10.1016/j.ccr.2009.01.023
- Akalay I, Janji B, Hasmim M, Noman MZ, Andre F, De Cremoux P, Bertheau P, Badoual C, Vielh P, Larsen AK, et al. Epithelial-to-mesenchymal transition and autophagy induction in breast carcinoma promote escape from T-cell-mediated lysis. Cancer Res 2013; 73(8):2418-2427; PMID:23436798; https://doi.org/10.1158/0008-5472.CAN-12-2432
- Hamilton DH, Huang B, Fernando RI, Tsang KY, Palena C. WEE1 inhibition alleviates resistance to immune attack of tumor cells undergoing epithelial-mesenchymal transition. Cancer Res 2014; 74(9):2510-2519; PMID:24626094; https://doi.org/10.1158/0008-5472.CAN-13-1894
- Akalay I, Tan TZ, Kumar P, Janji B, Mami-Chouaib F, Charpy C, Vielh P, Larsen AK, Thiery JP, Sabbah M, et al. Targeting WNT1-inducible signaling pathway protein 2 alters human breast cancer cell susceptibility to specific lysis through regulation of KLF-4 and miR-7 expression. Oncogene 2015; 34(17):2261-2271; PMID:24931170; https://doi.org/10.1038/onc.2014.151
- David JM, Hamilton DH, and Palena C. MUC1 upregulation promotes immune resistance in tumor cells undergoing brachyury-mediated epithelial-mesenchymal transition. Oncoimmunology 2016; 5(4):e1117738; PMID:27141403; https://doi.org/10.1080/2162402X.2015.1117738
- Goswami MT, Reka AK, Kurapati H, Kaza V, Chen J, Standiford TJ, Keshamouni VG. Regulation of complement-dependent cytotoxicity by TGF-beta-induced epithelial-mesenchymal transition. Oncogene 2016; 35(15):1888-1898; PMID:26148233; https://doi.org/10.1038/onc.2015.258
- Kudo-Saito C, Shirako H, Ohike M, Tsukamoto N, Kawakami Y. CCL2 is critical for immunosuppression to promote cancer metastasis. Clin Exp Metastasis 2013; 30(4):393-405; PMID:23143679; https://doi.org/10.1007/s10585-012-9545-6
- Chen L, Gibbons DL, Goswami S, Cortez MA, Ahn YH, Byers LA, Zhang X, Yi X, Dwyer D, Lin W, et al. Metastasis is regulated via microRNA-200/ZEB1 axis control of tumour cell PD-L1 expression and intratumoral immunosuppression. Nat Commun 2014; 5:5241; PMID:25348003; https://doi.org/10.1038/ncomms6241
- Bouillez A, Rajabi H, Jin C, Samur M, Tagde A, Alam M, Hiraki M, Maeda T, Hu X, Adeegbe D, et al. MUC1-C integrates PD-L1 induction with repression of immune effectors in non-small-cell lung cancer. Oncogene 2017; 36(28):4037-4046, Mar 13 [ Epub ahead of print]; PMID:28288138; https://doi.org/10.1038/onc.2017.47
- Alsuliman A, Colak D, Al-Harazi O, Fitwi H, Tulbah A, Al-Tweigeri T, Al-Alwan M, Ghebeh H. Bidirectional crosstalk between PD-L1 expression and epithelial to mesenchymal transition: significance in claudin-low breast cancer cells. Mol Cancer 2015; 14:149; PMID:26245467; https://doi.org/10.1186/s12943-015-0421-2
- Kurimoto R, Iwasawa S, Ebata T, Ishiwata T, Sekine I, Tada Y, Tatsumi K, Koide S, Iwama A, Takiguchi Y. Drug resistance originating from a TGF-beta/FGF-2-driven epithelial-to-mesenchymal transition and its reversion in human lung adenocarcinoma cell lines harboring an EGFR mutation. Int J Oncol 2016; 48(5):1825-1836; PMID:26984042; https://doi.org/10.3892/ijo.2016.3419
- Lou Y, Diao L, Cuentas ER, Denning WL, Chen L, Fan YH, Byers LA, Wang J, Papadimitrakopoulou VA, Behrens C, et al. Epithelial-Mesenchymal Transition Is Associated with a Distinct Tumor Microenvironment Including Elevation of Inflammatory Signals and Multiple Immune Checkpoints in Lung Adenocarcinoma. Clin Cancer Res 2016; 22(14):3630-3642; PMID:26851185; https://doi.org/10.1158/1078-0432.CCR-15-1434
- Pickup M, Novitskiy S, Moses HL. The roles of TGFbeta in the tumour microenvironment. Nat Rev Cancer 2013; 13(11):788-799; PMID:24132110; https://doi.org/10.1038/nrc3603
- Strauss J, Heery CR, Schlom J, Madan RA, Lamping E, Marte J, Cordes L, Lan Y, Mahnke L, Helwig C, et al. A phase I trial of M7824 (MSB0011359C), a bifunctional fusion protein targeting PD-L1 and TGF-β, in advanced solid tumors (abstr). TGF-ß Immunity Inflammation Cancer Keystone Symposia. Mol Cell Biol 2017
- Gulley JL, Heery CR, Schlom J, Madan RA, Cao L, Lamping E, Marte JL, Cordes LM, Christensen O, Helwig C, et al. Preliminary results from a phase 1 trial of M7824 (MSB0011359C), a bifunctional fusion protein targeting PD-L1 and TGF-β, in advanced solid tumors. J Clin Oncol 2017; 35:15_suppl, 3006-3006. https://doi.org/10.1200/JCO.2017.35.15_suppl.3006
- Grunert S, Jechlinger M, Beug H. Diverse cellular and molecular mechanisms contribute to epithelial plasticity and metastasis. Nat Rev Mol Cell Biol 2003; 4(8):657-665; PMID:12923528; https://doi.org/10.1038/nrm1175
- Cortez MA, Ivan C, Valdecanas D, Wang X, Peltier HJ, Ye Y, Araujo L, Carbone DP, Shilo K, Giri DK, et al. PDL1 Regulation by p53 via miR-34. J Natl Cancer Inst 2016; 108(1); pii:djv303; PMID:26577528; https://doi.org/10.1093/jnci/djv303
- Zhao L, Yu H, Yi S, Peng X, Su P, Xiao Z, Liu R, Tang A, Li X, Liu F, et al. The tumor suppressor miR-138-5p targets PD-L1 in colorectal cancer. Oncotarget 2016; 7(29):45370-45384; PMID:27248318; https://doi.org/10.18632/oncotarget.9659
- Brown KA, Pietenpol JA, Moses HL. A tale of two proteins: differential roles and regulation of Smad2 and Smad3 in TGF-beta signaling. J Cell Biochem 2007; 101(1):9-33; PMID:17340614; https://doi.org/10.1002/jcb.21255
- Lee SJ, Jang BC, Lee SW, Yang YI, Suh SI, Park YM, Oh S, Shin JG, Yao S, Chen L, et al. Interferon regulatory factor-1 is prerequisite to the constitutive expression and IFN-gamma-induced upregulation of B7-H1 (CD274). FEBS Lett 2006; 580(3):755-762; PMID:16413538; https://doi.org/10.1016/j.febslet.2005.12.093
- Mak MP, Tong P, Diao L, Cardnell RJ, Gibbons DL, William WN, Skoulidis F, Parra ER, Rodriguez-Canales J, Wistuba II, et al. A patient-derived, pan-cancer EMT signature identifies global molecular alterations and immune target enrichment following epithelial-to-mesenchymal transition. Clin Cancer Res 2016; 22(3):609-620; PMID:26420858; https://doi.org/10.1158/1078-0432.CCR-15-0876
- Ock CY, Kim S, Keam B, Kim M, Kim TM, Kim JH, Jeon YK, Lee JS, Kwon SK, Hah JH, et al. PD-L1 expression is associated with epithelial-mesenchymal transition in head and neck squamous cell carcinoma. Oncotarget 2016; 7(13):15901-15914; PMID:26893364; https://doi.org/10.18632/oncotarget.7431
- Kim S, Koh J, Kim MY, Kwon D, Go H, Kim YA, Jeon YK, Chung DH. PD-L1 expression is associated with epithelial-to-mesenchymal transition in adenocarcinoma of the lung. Hum Pathol 2016; 58:7-14; PMID:27473266; https://doi.org/10.1016/j.humpath.2016.07.007
- Shimoji M, Shimizu S, Sato K, Suda K, Kobayashi Y, Tomizawa K, Takemoto T, Mitsudomi T. Clinical and pathologic features of lung cancer expressing programmed cell death ligand 1 (PD-L1). Lung Cancer 2016; 98:69-75; PMID:27393509; https://doi.org/10.1016/j.lungcan.2016.04.021
- Ni XY, Sui HX, Liu Y, Ke SZ, Wang YN, Gao FG. TGF-beta of lung cancer microenvironment upregulates B7H1 and GITRL expression in dendritic cells and is associated with regulatory T cell generation. Oncol Rep 2012; 28(2):615-621; PMID:22614805; https://doi.org/10.3892/or.2012.1822
- Song S, Yuan P, Wu H, Chen J, Fu J, Li P, Lu J, Wei W. Dendritic cells with an increased PD-L1 by TGF-beta induce T cell anergy for the cytotoxicity of hepatocellular carcinoma cells. Int Immunopharmacol 2014; 20(1):117-123; PMID:24606770; https://doi.org/10.1016/j.intimp.2014.02.027
- Baas M, Besancon A, Goncalves T, Valette F, Yagita H, Sawitzki B, Volk HD, Waeckel-Enee E, Rocha B, Chatenoud L, et al. TGFbeta-dependent expression of PD-1 and PD-L1 controls CD8(+) T cell anergy in transplant tolerance. Elife 2016; 5:e08133; PMID:26824266; https://doi.org/10.7554/eLife.08133
- Starke A, Wuthrich RP, and Waeckerle-Men Y. TGF-beta treatment modulates PD-L1 and CD40 expression in proximal renal tubular epithelial cells and enhances CD8 cytotoxic T-cell responses. Nephron Exp Nephrol 2007; 107(1):e22-29; PMID:17671397; https://doi.org/10.1159/000106506
- Gregory PA, Bracken CP, Smith E, Bert AG, Wright JA, Roslan S, Morris M, Wyatt L, Farshid G, Lim YY, et al. An autocrine TGF-beta/ZEB/miR-200 signaling network regulates establishment and maintenance of epithelial-mesenchymal transition. Mol Biol Cell 2011; 22(10):1686-1698; PMID:21411626; https://doi.org/10.1091/mbc.E11-02-0103
- Siemens H, Jackstadt R, Hunten S, Kaller M, Menssen A, Gotz U, Hermeking H. miR-34 and SNAIL form a double-negative feedback loop to regulate epithelial-mesenchymal transitions. Cell Cycle 2011; 10(24):4256-4271; PMID:22134354; https://doi.org/10.4161/cc.10.24.18552
- Liu X, Wang C, Chen Z, Jin Y, Wang Y, Kolokythas A, Dai Y, Zhou X. MicroRNA-138 suppresses epithelial-mesenchymal transition in squamous cell carcinoma cell lines. Biochem J 2011; 440(1):23-31; PMID:21770894; https://doi.org/10.1042/BJ20111006
- Miguez DG, Gil-Guinon E, Pons S, Marti E. Smad2 and Smad3 cooperate and antagonize simultaneously in vertebrate neurogenesis. J Cell Sci 2013; 126(Pt 23):5335-5343; PMID:24105267; https://doi.org/10.1242/jcs.130435
- Liu L, Liu X, Ren X, Tian Y, Chen Z, Xu X, Du Y, Jiang C, Fang Y, Liu Z, et al. Smad2 and Smad3 have differential sensitivity in relaying TGFbeta signaling and inversely regulate early lineage specification. Sci Rep 2016; 6:21602; PMID:26905010; https://doi.org/10.1038/srep21602
- Park BV, Freeman ZT, Ghasemzadeh A, Chattergoon MA, Rutebemberwa A, Steigner J, Winter ME, Huynh TV, Sebald SM, Lee SJ, et al. TGFbeta1-mediated SMAD3 enhances PD-1 expression on Antigen-Specific T cells in cancer. Cancer Discov 2016; 6(12):1366-1381; PMID:27683557; https://doi.org/10.1158/2159-8290.CD-15-1347
- Akbay EA, Koyama S, Carretero J, Altabef A, Tchaicha JH, Christensen CL, Mikse OR, Cherniack AD, Beauchamp EM, Pugh TJ, et al. Activation of the PD-1 pathway contributes to immune escape in EGFR-driven lung tumors. Cancer Discov 2013; 3(12):1355-1363; PMID:24078774; https://doi.org/10.1158/2159-8290.CD-13-0310
- Singh A, Settleman J. EMT, cancer stem cells and drug resistance: an emerging axis of evil in the war on cancer. Oncogene 2010; 29(34):4741-4751; PMID:20531305; https://doi.org/10.1038/onc.2010.215
- Larocca C, Cohen JR, Fernando RI, Huang B, Hamilton DH, Palena C. An autocrine loop between TGF-beta1 and the transcription factor brachyury controls the transition of human carcinoma cells into a mesenchymal phenotype. Mol Cancer Ther 2013; 12(9):1805-1815; PMID:23783250; https://doi.org/10.1158/1535-7163.MCT-12-1007
- Herbertz S, Sawyer JS, Stauber AJ, Gueorguieva I, Driscoll KE, Estrem ST, Cleverly AL, Desaiah D, Guba SC, Benhadji KA, et al. Clinical development of galunisertib (LY2157299 monohydrate), a small molecule inhibitor of transforming growth factor-beta signaling pathway. Drug Des Devel Ther 2015; 9:4479-4499; PMID:26309397; https://doi.org/10.2147/DDDT.S86621
- Scognamiglio G, De Chiara A, Di Bonito M, Tatangelo F, Losito NS, Anniciello A, De Cecio R, D'Alterio C, Scala S, Cantile M, et al. Variability in immunohistochemical detection of programmed death ligand 1 (PD-L1) in cancer tissue types. Int J Mol Sci 2016; 17(5); pii:E790; PMID:27213372; https://doi.org/10.3390/ijms17050790