
ABSTRACT
Oncolytic immunotherapy using oncolytic viruses (OV) has been shown to stimulate the antitumor immune response by inducing the release of tumor-associated antigens (TAA) and danger signals from the dying infected tumor cells. In this study, we sought to determine if the lysis of tumor cells induced by different OV: measles virus, vaccinia virus, vesicular stomatitis virus, herpes simplex type I virus, adenovirus or enterovirus, has consequences on the capacity of tumor cells to present TAA, such as NY-ESO-1. We show that the co-culture of NY-ESO-1neg/HLA-DP4pos melanoma cells with NY-ESO-1pos/HLA-DP4neg melanoma cells infected and killed by different OV induces an intercellular transfer of NY-ESO-1 that allows the recognition of NY-ESO-1neg/HLA-DP4pos tumor cells by an HLA-DP4/NY-ESO-1(157–170)-specific CD4+ cytotoxic T cell clone, NY67. We then confirmed this result in a second model with an HLA-DP4+ melanoma cell line that expresses a low amount of NY-ESO-1. Recognition of this cell line by the NY67 clone is largely increased in the presence of OV productive infection. Altogether, our results show for the first time another mechanism of stimulation of the anti-tumor immune response by OV, via the loading of tumor cells with TAA that sensitizes them for direct recognition by specific effector CD4+ T cells, supporting the use of OV for cancer immunotherapy.
Introduction
Oncolytic immunotherapy is based on the use of oncolytic viruses (OV) for the treatment of cancer. OV are non-pathogenic replicative viruses that have been attenuated, selected and/or modified to infect and kill preferentially or exclusively tumor cells without harming healthy cells Citation(1). Furthermore, infection of tumor cells by OV results in immunogenic cell death that can initiate or reinforce the antitumor immune response (Citation2–4). Indeed, the combination of damage-associated molecular patterns (DAMP), pathogen-associated molecular patterns (PAMP), tumor-associated antigens (TAA) and possibly type I interferon (IFN) and other pro-inflammatory cytokines released by the dying tumor cell following productive infection by OV activates antigen-presenting cells such as dendritic cells (DC) that become able to initiate anti-tumor T cell responses by presentation of TAA from dying tumor cells.
Numerous TAA expressed by tumor cells and recognized by T cells have been identified since the middle of the 1990s Citation(5). They have been classified in several families: mutated, tumor-specific, differentiation, overexpressed and aberrantly expressed. Tumor-specific TAA, also known as cancer-germline antigens, share with mutated neo-antigens interesting properties for cancer immunotherapy, such as a specific expression by tumor cells and specific T cell repertoires of high functional avidities, not impacted by negative selection. Besides these properties their expression is shared by a variety of tumors, reinforcing their interest. Among the tumor-specific TAA, New York esophageal squamous cell carcinoma 1 antigen (NY-ESO-1) has been shown to be expressed in several types of cancer such as melanoma. This TAA holds great promises for immunotherapy, as it is one of the most immunogenic and can be spontaneously recognized in patients not only by cytotoxic CD8+ T lymphocytes, but also by CD4+ T cells and B lymphocytes (Citation6,Citation7). For instance, it has been reported that the adoptive transfer of an autologous HLA-DP4/NY-ESO-1(157–170) specific CD4+ T cell clone in a metastatic melanoma patient led to rejection of tumors associated with the emergence of other tumor-specific T cells suggesting an induction of “antigen spreading” Citation(8). Furthermore, the adoptive transfer of T cells expressing a transgenic T cell receptor against NY-ESO-1 allows clinical benefits in cancer patients (Citation9,Citation10). Thus, all strategies aiming at increasing the presentation of this TAA by DC and tumor cells should be envisaged to stimulate the antitumor immune response.
Recently, we used an HLA-DP4/NY-ESO-1(157-170)-specific CD4+ cytotoxic T cell clone, NY67, to elucidate how NY-ESO-1, a cytoplasmic protein, can generate the NY-ESO-1(157-170) peptide that is presented by the HLA-DP4 molecule on the surface of melanoma cells Citation(11). Contrary to other endogenous antigens that reach the HLA class II presentation pathway by autophagy Citation(12), we showed that NY-ESO-1 reaches the classical exogenous HLA class II presentation pathway by intercellular transfer after being released and then recaptured by tumor cells Citation(11). Indeed, we used an allogeneic model composed of an NY-ESO-1pos/HLA-DP4neg melanoma cell line as NY-ESO-1 donor and an NY-ESO-1neg/HLA-DP4pos melanoma cell line as presenting cell line. These cells are not recognized by the NY67 clone when they are cultured separately, but induce IFN-γ production by NY67 when they are cultured together. Activation of the NY67 clone, which demonstrates presentation of the NY-ESO-1(157-170) peptide by the HLA-DP4 molecule, can be increased if the presenting cells are co-cultured with a lysate of donor cells that favors intercellular transfer of NY-ESO-1 from donor to presenting cells. This presentation is dependent of a functional rab7, thus dependent of fusion of late endosome with lysosomes.
In this study, we sought to determine if the release of a TAA, such as NY-ESO-1, by tumor cells that are killed following a productive OV infection has consequences on recognition of tumor cells by T cells such as the NY-ESO-1-specific NY67 clone. We studied six different OV: measles virus (MV), vaccinia virus (VV), vesicular stomatitis virus (VSV), herpes simplex type I virus (HSV), adenovirus (AdV) and enterovirus (EV). In the allogeneic model, we show that when the donor cells are sensitive to an OV, NY-ESO-1 is released and captured by presenting cells that become able to present the NY-ESO-1(157–170) peptide to NY67. Then, we confirmed this result with an autologous model using an HLA-DP4+ melanoma cell line that expresses NY-ESO-1 at a low level. This cell line is weakly recognized by the NY67 clone. When this cell line is co-cultured with autologous tumor cells that were previously lysed by an OV, the recognition of NY-ESO-1 by NY67 is strongly increased. Finally, we show that this intercellular transfer of NY-ESO-1 sensitizes HLA-DP4+ tumor cells for cytotoxic activity of the NY67T cell clone. Altogether, these results show for the first time that OV have a positive effect, not only on the initiation phase of the antitumor immune response, but also on its effector phase by favoring the presentation of antigens by HLA class II molecules and thus the recognition of tumor cells by cytotoxic CD4+ T cells.
Results
Expression of NY-ESO-1 and HLA-DP by melanoma tumor cell lines.
Recently, using an allogeneic model, we showed that the HLA-DP4neg A549 lung adenocarcinoma cell line transfected with a plasmid that encodes NY-ESO-1 (NY-ESO-1 donor cell line) releases NY-ESO-1 proteins that can be captured by the HLA-DP4pos M199 melanoma cell line (presenting cell line). This cell line can then present the NY-ESO-1(157-170) peptide by the HLA-DP4 molecule to an HLA-DP4/NY-ESO-1(157–170)-specific CD4+ T cell clone, NY67 Citation(11).
To assess if the Schwarz strain of measles virus (MV) or other OV can influence this intracellular transfer of TAA and their presentation by tumor cells, we used a different allogeneic model composed of the HLA-DP4neg melanoma cell line M18 as NY-ESO-1 donor and two HLA-DP4pos melanoma cell lines M88 and M199 as presenters (). We measured the expression of HLA-DP molecules by these three melanoma cell lines using a pan-HLA-DP specific monoclonal antibody that recognizes all variant of HLA-DP ( and ). M18 and M199 expressed HLA-DP molecules at a low level and M88 at a moderate level. HLA-DP expression was greatly increased on the three cell lines by a treatment with gamma interferon (IFN-γ). Then we measured NY-ESO-1 expression by RT-PCR (). M18 expressed spontaneously high levels of NY-ESO-1, whereas M88 and M199 expressed low levels.
Table 1. HLA-DPB1 allelic typing of melanoma cell lines.
Figure 1. HLA-DP and NY-ESO-1 expression by melanoma cell lines. (A) The melanoma cell lines were cultured for 24 h in the absence or presence of 500IU/mL IFN-γ and then labeled with an IgG1 isotype control antibody (grey) or a monoclonal antibody directed against HLA-DP (white) followed by a staining with a fluorescent secondary antibody. Fluorescence was analyzed by flow cytometry. RMFI is shown on histograms. (B) Results are expressed as the mean ± SEM of RMFI of three independent HLA-DP staining experiments. (C) The melanoma cell lines were cultured for 24 h in the absence or presence of 500IU/ml of IFN-γ. Relative expression of the CTAG1B gene that encodes NY-ESO-1 was measured by RT-qPCR and determined with RPLPO gene expression used as reference. Indicated values are means ± SEM of relative expression of three independent experiments.
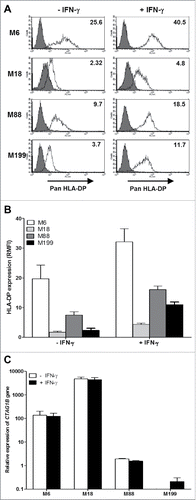
In addition to this allogeneic model, we also set up an autologous model in which the melanoma cell line M6 was at the same time the NY-ESO-1 donor and presenting cell line. Indeed, M6 expressed the HLA-DP protein on its surface that can be increased by exposure of the tumor cells to IFN-γ (, and ). By RT-PCR, we measured that this cell line expressed moderate levels of NY-ESO-1 compared to the other cell lines ().
Recognition of melanoma cell lines by the NY67 CD4+ T cell clone
To determine if the four melanoma cell lines are able to present the NY-ESO-1(157-170) peptides on the HLA-DP4 molecules, we used the human CD4+ T cell clone NY67. We first checked that NY67 obtained by limiting dilution cloning is actually clonal by sequencing the complementarity determining regions 3 (CDR3) of the two chains α and β of the T cell receptor (TCR). We found only one CDR3 region for each chain (). This result confirms that NY67 is clonal.
Figure 2. IFN-γ response of the CD4+ T cell clone NY67. (A) Nucleotide and amino acid sequences of the CDR3 of the beta and alpha chains of the TCR of the T cell clone NY67. (B) Melanoma cell lines were cultured in the presence or absence of IFN-γ and then loaded or not with the NY-ESO-1(157-170) peptide and washed. They were then cultured for 5 h with the CD4+ T cell clone NY67. IFN-γ response of the clone was measured by flow cytometry after CD4/IFN-γ staining. (C) Results are expressed as the mean ± SEM of the percentage of IFN-γ producing CD4+ T cells obtained from three independent experiments.
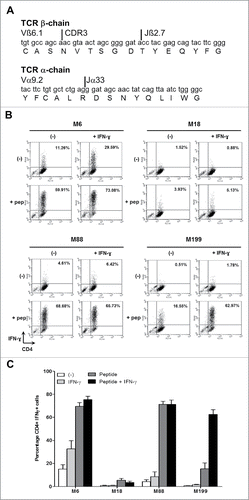
We then measured the capacity of the four melanoma cell lines to present the NY-ESO-1(157-170) peptide to the NY67 clone. In absence of exogenous peptide, only M6 was recognized by a small fraction (15.12% +/−4.1% of CD4+IFN-γ+ cells) of the NY67 CD4+ T cell clone ( and ). This recognition can be enhanced (32.75% +/−7.5% of CD4+IFN-γ+ cells), if the M6 tumor cell line was previously exposed to IFN-γ to increase expression of the HLA-DP molecules. M88, which expresses moderate level of HLA-DP and low levels of NY-ESO-1, failed to activate more than 10% of the clone in absence of peptide, even when pretreated with IFN-γ. M18 and M199 cell lines were also not spontaneously recognized by the NY67 clone.
When the tumor cells were pre-incubated 1 h with the NY-ESO-1(157-170) peptide and washed, the NY67 clone was able to recognize the two HLA-DP4pos melanoma cell lines M6, M88 and to a lower extent M199 ( and ). Indeed, M6 and M88, whether pretreated or not with IFN-γ, were strongly recognized by NY67. IFN-γ-pretreated M199 subsequently loaded with the NY-ESO-1(157-170) peptide was also well recognized by the clone ( and ). The low recognition of untreated M199 was probably due to the weak expression of HLA-DP in that condition ( and ). Untreated or IFN-γ treated HLA-DP4neg M18 cell line pulsed with the NY-ESO-1(157-170) peptide was recognized by less than 10% of NY67.
Sensitivity of NY-ESO-1 donor melanoma cell lines to oncolytic activity of MV
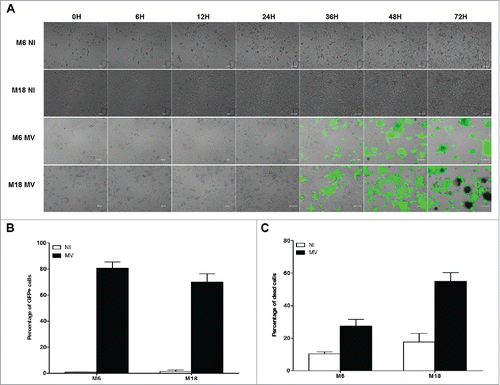
In the next experiment, we measured the sensitivity of the two NY-ESO-1 donor melanoma cell lines M6 and M18 to the oncolytic activity of MV. First, we followed by microscopy for four days cultures of uninfected M6 and M18 (supplemental videos 1 and 2) or cultures of M6 and M18 in presence of MV encoding the enhanced green fluorescent protein (MV-eGFP) at a multiplicity of infection (MOI) of 2 (supplemental videos 3 and 4). Images from this experiment are presented in . At 24 h post infection, both NY-ESO-1 donor melanoma cell lines became eGFP+. After 36 h, formation of syncytia was observed with both cell lines. After 48 h, both tumor cell lines started to detach from the support and to die. After 72 h, 80.7% and 69.9% of M6 and M18 cells, respectively, were eGFP+ (), and 27.5% and 55.1% of M6 and M18 cells, respectively, were positive for cell death staining by annexinV and/or PI (). Interestingly, after 48 h, a part of the MV-infected cells dies, bursts and releases their content, including eGFP, in the extracellular environment (supplemental videos 3 and 4).
Figure 3. Melanoma cell lines are sensitive to the oncolytic activity of MV. (A) M6 and M18 melanoma lines were cultured alone (NI, not infected) or infected by MV-eGFP at an MOI of 2 (MV). Pictures were taken every 6 h during the next 72 h. (B) M6 and M18 cell lines were cultured alone (NI) or infected by MV-eGFP at MOI of 2 (MV). After 72 h, the percentage of GFP+ cells was measured by flow cytometry. Indicated value are means ± SEM of three independent experiments. (C) M6 and M18 cell lines were cultured alone (NI) or infected by MV at MOI of 2 (MV). After 72 h cells were labeled with Annexin V-APC and propidium iodide (PI). Percentage of Annexin V+ and/or PI+ cells was measured by flow cytometry. Indicated values are means ± SEM of three independent experiments.
Co-culture of the NY-ESO-1 donor cell lines killed by MV with presenting tumor cell lines induces IFN-γ production by the NY-ESO-1 specific CD4+ T cell clone NY67.
Firstly, we used the allogeneic model to determine the effects of oncolytic MV on the presentation of endogenous NY-ESO-1 by the HLA-DP4 molecules. The HLA-DP4pos/NY-ESO-1neg presenting cell lines M88 and M199 were not recognized by the NY67 CD4+ T cell clone whether it was pretreated with IFN-γ or not, with less than 10% of the CD4+ T cells expressing IFN-γ (, and ). The NY67 clone also failed to recognize the HLA-DP4neg/NY-ESO-1pos donor cell line M18 whether it was alive, lysed by 3 freeze/thaw (FT) cycles or lysed by a 72 h MV infection at MOI = 2. IFN-γ pretreatment of M18 alive, or lysed by FT cycles or MV infection did not allow recognition by NY67 (data not shown). When the presenting cell lines M88 and M199 were co-cultured with the living NY-ESO-1 donor M18, we observed a weak activation of NY67 only in response to M88 co-cultured with M18 and IFN-γ with 23.56% +/−12.1% of NY67 producing IFN-γ. When M88 and M199 were co-cultured with M18 lyzed by FT cycles or MV infection, we observed a stronger activation of NY67 than in response to the presenting or donor cell lines alone, or the presenting cell lines co-cultured with the living donor cells. These results show that the lysis induced by MV infection, or FT cycles, allows the release of NY-ESO-1 from the donor cells that can be captured, processed and presented by presenting cell lines to the HLA-DP4/NY-ESO-1(157-170)-specific T cell clone NY67.
Figure 4. MV infection of the NY-ESO-1 donor cell lines sensitizes presenting cell lines to recognition by the NY-ESO-1-specific CD4+ T cell clone NY67. (A-E) NY-ESO-1 donor cell lines, M6 or M18, were cultured alone, infected for 3 days with MV at an MOI of 2, or underwent 3 freeze/thaw cycles (FT). They were then cultured for 24 h alone or with presenting cell lines in the presence or absence of IFN-γ. The NY-ESO-1-specific CD4+ T cell clone NY67 was added to these cultures in presence of brefeldin A. 5 h later, IFN-γ response of the clone was measured by flow cytometry after CD4/IFN-γ staining. (A) Example of CD4/IFN-γ staining of the clone NY67 obtained in one experiment where M18 is the NY-ESO-1 donor cell line and M88 and M199 are the presenting cells lines. (B and C) Results are expressed as mean ± SEM of the percentage of IFN-γ-producing CD4+ T cells obtained from three independent experiments with M88 (B) or M199 (C) as presenting cell lines, respectively. (D) Example of CD4/IFN-γ staining of the clone NY67 obtained in one experiment where M6 is the NY-ESO-1 donor and also the presenting cell line. (E) Results are expressed as mean ± SEM of the percentage of IFN-γ-producing CD4+ T cells obtained from three independent experiments with M6.
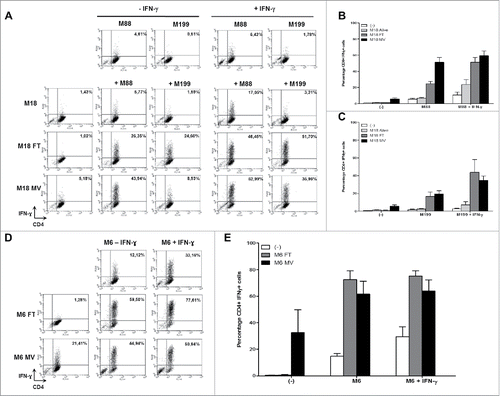
Secondly, we wanted to confirm this result in an autologous model in which the NY-ESO-1pos/HLA-DP4pos melanoma cell line M6 is at the same time the NY-ESO-1 donor and presenting cell line ( and ). In absence of IFN-γ pretreatment, this cell line was not well recognized by the NY67 clone, since it allowed production of IFN-γ by only 14.75% (+/−3.47%) of the CD4+ T cells. With IFN-γ pretreatment, recognition of M6 by NY67 was improved with 29.44% (+/−12.89%) of the clone producing IFN-γ (). When the NY67 clone was cultured with lysate of M6 obtained by FT cycles, no activation of NY67 was observed, since there was no remaining living cells to present HLA-DP4/NY-ESO-1(157-170) complexes. On the opposite, there were still some living M6 cells able to present HLA-DP4/NY-ESO-1(157-170) complexes when NY67 was cultured with a lysate of M6 obtained by MV infection (supplemental video 3). This activation was superior to what was observed in response to M6 alive. Finally, the coculture of M6 cell line with M6 cells lyzed by FT cycles or MV infection allowed a strong presentation of HLA-DP4/NY-ESO-1(157-170) complexes, with more than 50% of the NY67 clone producing IFN-γ in these conditions (). We thus confirmed with the autologous model that the release of NY-ESO-1 following killing of tumor cells by MV infection allows intercellular transfer of this TAA that sensitizes alive neighboring tumor cells to recognition by NY-ESO-1-specific CD4+ T cells.
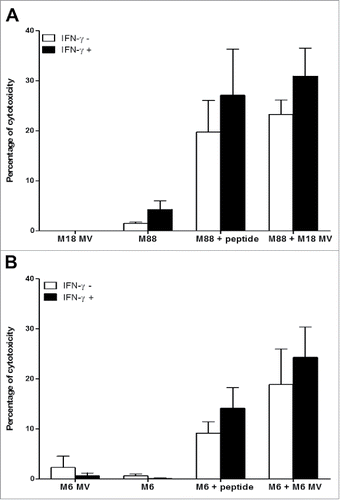
The NY67 clone develops a cytotoxic activity when stimulated. With a 51Chromium release assay, we measured if activation of NY67 by presenting cells that have captured NY-ESO-1 released by donor cells killed with MV led to the lysis of presenting cells by the clone. We found that the intercellular transfer of NY-ESO-1 induced by MV sensitizes presenting tumor cells to the cytotoxic activity of the NY67 T cell clone in both models: the allogeneic model using M18 as NY-ESO-1 donor and M88 as presenting tumor cell line () and the autologous model using the M6 tumor cell line ().
Figure 5. MV infection of the NY-ESO-1 donor cell lines sensitizes presenting cell lines to cytotoxic activity of the NY-ESO-1-specific CD4+ T cell clone NY67. NY-ESO-1 donor cell line (M6 or M18) were cultured alone or infected for 3 days with MV at an MOI of 2 (MV). Donor cells were then cultured 24 h alone or with the presenting cell lines (M6 or M88) in the presence or absence of IFN-γ. A part of the presenting cells were pulsed with the NY-ESO-1(157-170) peptide. Cells were then loaded with 51Cr and exposed for 4 h to the NY-ESO-1-specific CD4+ T cell clone NY67. Then, supernatants were harvested and analyzed for the presence of 51Cr. (A) results obtained using M18 as donor cell line and M88 as presenting cell line. (B) Results obtained using M6 donor and presenting cell line. Results are expressed as mean ± SEM of percent of cytotoxicity obtained from three independent experiments.
MV-infected M18 tumor cells release NY-ESO-1
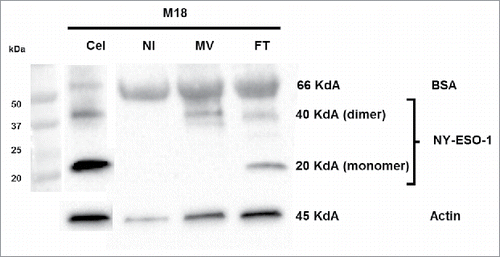
We measured by western blot the amount of NY-ESO-1 protein that is released in the culture supernatants of MV infected tumor cells and tumor cells lyzed by freeze/thaw (FT) cycles. For M18 we observed monomers and dimers of NY-ESO-1 protein at 20 Kd and 40 kd respectively in the supernatants of FT M18 tumor cells (). We observed only the dimers of NY-ESO-1 in the supernatants of MV-infected M18 tumor cells. The quantity of NY-ESO-1 released by MV infected and FT M18 tumor cells was inferior to the total quantity of NY-ESO-1 protein from M18 cellular lysate, suggesting that a part stays with cellular debris. In the culture supernatant of non-infected M18 tumor cells there is only one band for bovine serum albumin that comes from the FCS used in culture medium and that catches non-specifically the NY-ESO-1 specific monoclonal antibody. For M6 tumor cell line that expresses lower level of NY-ESO-1 than M18 as measured by RT-PCR (), we were only able to observe a week band of NY-ESO-1 in the M6 cellular lysate, but not in culture supernatants of MV-infected and FT M6 tumor cells (data not shown). Altogether these results suggest that small amounts of NY-ESO-1 released by MV-infected and FT tumor cells are sufficient to load the class II presentation pathway of neighboring tumor cells.
Figure 6. Release of NY-ESO-1 by MV-infected M18 tumor cells. M18 tumor cells were cultured alone (NI), infected by MV or lyzed by freeze/thaw (FT) cycles. NY-ESO-1 was measured in M18 cellular lysate (20 μg protein deposit) and supernatants of NI, MV or FT M18 tumor cells (50 μg protein deposit). NY-ESO-1 appears as a monomer (band at 20kD) or dimer (band at 40kD).
Sensitivity of NY-ESO-1 donor tumor cell lines to oncolytic activity of five other OV
Then, we tested if other OV beside MV are able to induce intercellular transfer of NY-ESO-1 to favor HLA class II presentation of this TAA. We studied five other OV: a Copenhagen vaccinia virus (VV) deleted of its thymidine kinase and ribonucleotide reductase genes and that encodes GFP Citation(13). The VSVdelta51 (VSV) that has been developed with a mutation in the M protein making the virus sensitive to interferon secretion, specific to tumor environment, and has shown promising efficacy against various type of tumor models (Citation14,Citation15); the rQNestin34.5v.1 Herpes simplex type I virus (HSV) that encodes GFP and that is modified by insertion of a nestin promoter driving expression of HSV1 ICP34.5 and GFP in the context of a deletion of ICP6 and both endogenous copies of ICP34.5 Citation(16); oncolytic adenovirus Ad-TD-RFP (AdV) is a new generation adenovirus in which the E1ACR2,E1B19 K and E3gp19 K genes of human adenovirus type 5 were deleted and the RFP open reading frame was inserted into the E3gp19 K region; and the Rigvir (EV) that is a native enterovirus of ECHO 7 type isolated from human feces and adapted and selected for melanomas Citation(17). VV, VSV and HSV express GFP and the AdV expresses red fluorescent protein (RFP).
Firstly, we exposed the NY-ESO-1 donor cell lines M6 and M18 to the four different OV that encode fluorescent proteins and we made pictures and movies during the next 72 h to 96 h ( A and supplemental videos 5 to 12). With VV (supplemental videos 5 and 6) and VSV (supplemental videos 7 and 8), we observed the first GFP+ tumor cells after 8 h and 16 h, respectively. The fluorescence spread and by 24 h, a majority of cells were GFP+. Then cells started to detach from the support and died. Later, a part of the cells lost their green fluorescence by releasing the GFP in the medium. With HSV (supplemental videos 9 and 10), we observed a first wave of GFP+ infected cells after 12 h for M6 and 33 h for M18, but we failed to detect further waves of infection. However, we observed the spreading of a cytopathic effect on the GFP- neighboring cells that detached from the support and died, especially with M6. With AdV, we failed to see RFP+ cells at MOI under 10 (data not shown). When we used an MOI of 100 (supplemental videos 11 and 12), we observed rare RFP+ cells after 32 h for M6 and 24 h with M18 and the infection did not spread to other cells. After 72 h, a majority of M6 cells were still attached to the plastic and look alive, while M18 cells started detaching and got a round shape after 24 h with some of them presenting an apoptotic morphology characterized by the formation of large vacuoles. We then quantified the cell fluorescence by flow cytometry after 72 h of exposition to the five OV encoding fluorescent proteins (). The results correlate with observations by microscopy. With MV, VV and VSV, a large majority of cells were fluorescent 72 h after infection, whereas a smaller fraction of cells were fluorescent with HSV (55.74% +/−5.7% for M6 and 25.40% +/−5.6% for M18) and less than 16% with AdV.
Figure 7. Sensitivity of NY-ESO-1 donor melanoma cell lines M6 and M18 to six different OV. M6 and M18 melanoma cell lines were infected with VV (MOI = 0.1), VSV (MOI = 0.01), HSV (MOI = 1), AdV (MOI = 100) during 72 h. (A) Pictures were taken every 6 h. (B) 72 h later, the percentage of GFP+ cells for MV-eGFP, VV, VSV and HSV, or RFP+ cells for AdV was measured by flow cytometry. (C and D) M6 and M18 melanoma cell lines were infected with EV (MOI = 5). 72 h later, cells were stained with an antibody against VP-1 of EV and an Alexa-488 secondary antibody. Fluorescence was measured by flow cytometry. (C) Histogram plots of control (grey) and VP1 (white) stainings. (D) Results are expressed as mean ± SEM of three independent VP1 stainings. (E) M6 and M18 cell lines were infected with MV-eGFP (MOI = 2), VV (MOI = 0.1), VSV (MOI = 0.01), HSV (MOI = 1), AdV (MOI = 100) and EV (MOI = 5). 72 h later, cells were labeled with TO-PRO®-3. TO-PRO®-3+ cells were measured by flow cytometry. Indicated value are means ± SEM of three independent experiments.
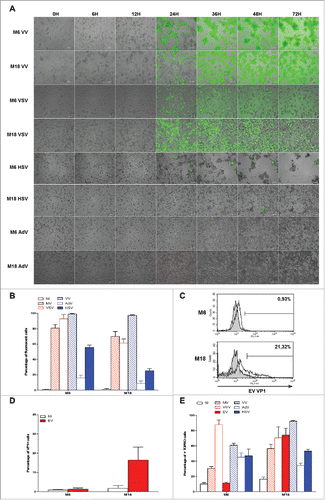
We also measured the sensitivity of both NY-ESO-1 donor cell lines to EV Rigvir. This virus does not encode a fluorescent protein. To measure viral protein production after 72 h of infection, we stained the cells with a monoclonal antibody against the viral protein 1 (VP1) of EV ( and ). We found that M18 was permissive to EV infection with around 20% of VP1+ cells after 72 h of infection, whereas M6 was not sensitive to EV infection, with less than 1% of VP1+ cells.
Then, we measured cell death of both NY-ESO-1 donor cell lines induced by the six different OV after 72 h, by staining dead cells that had lost membrane permeability with TO-PRO®-3 (). We found that all OV except EV induced a significant level of death of M6 tumor cell line, whereas all viruses induced cell death of M18. Surprisingly, we noticed that despite a relative resistance of M6 and M18 to infection by AdV, a relatively high level of TO-PRO®-3+ cells was present after 72 h. It is all the more surprising that M6 tumor cells infected with AdV looked in good shape after 72 h (supplemental video 11). Interestingly, we observed that despite a relatively low fraction of tumor cells expressing high levels of GFP 72 h after HSV infection, about half of the cells were TO-PRO®-3+, thus confirming the cytopathic effect observed by videomicroscopy (supplemental videos 9 and 10).
MV, VV, VSV, HSV and EV induce intercellular transfer of NY-ESO-1 that sensitizes tumor cells to recognition by the NY-ESO-1-specific CD4+ T cell clone NY67
First, we used the allogeneic model with M18 as NY-ESO-1 donor cell line and M88 as presenting cell line to determine if the different OV are able to induce the intercellular transfer and the presentation of NY-ESO-1 by HLA class II molecules (, supplemental figure 1). M18 alive or exposed to the different OV, in absence or presence of IFN-γ, was never recognized by the NY67 clone. When M88 was co-cultured with M18 alive, a low level of activation of NY67 (inferior to 20% of CD4+IFN-γ+ cells) was observed, especially when IFN-γ was present in the co-culture. When M18 was infected with the different OV, all viruses except AdV were able to induce the intercellular transfer of NY-ESO-1 and the recognition of the presenting cell M88 by NY67.
Figure 8. OV infection of the NY-ESO-1 donor cell lines sensitizes presenting cell lines to recognition by the NY-ESO-1-specific CD4+ T cell clone NY67. (A) The NY-ESO-1 donor cell line M18 was cultured alone, infected for 3 days with MV (MOI = 2), VSV (MOI = 0.01), EV (MOI = 5), VV (MOI = 0.1), AdV (MOI = 100), HSV (MOI = 1) or underwent 3 freeze/thaw cycles (FT). Cells were then cultured 24 h alone or with the presenting cell line M88 in the presence or absence of IFN-γ. The NY-ESO-1-specific CD4+ T cell clone NY67 was added to the culture in presence of brefeldin A. 5 h later, IFN-γ response of the clone was measured by flow cytometry after CD4/IFN-γ staining. (B) The NY-ESO-1 donor cell line M6 was cultured alone, infected for 72 h with MV (MOI = 2), VSV (MOI = 0.01), EV (MOI = 5), VV (MOI = 0.1), AdV (MOI = 100), HSV (MOI = 1) or underwent 3 FT cycles. Cells were then cultured 24 h alone or with the autologous presenting cell line M6 in the presence or absence of IFN-γ. The NY-ESO-1-specific CD4+ T cell clone NY67 was added to the culture in presence of brefeldin A. 5 h later, IFN-γ response of the clone was measured by flow cytometry after CD4/IFN-γ staining. Results are expressed as mean ± SEM of three independent experiments.
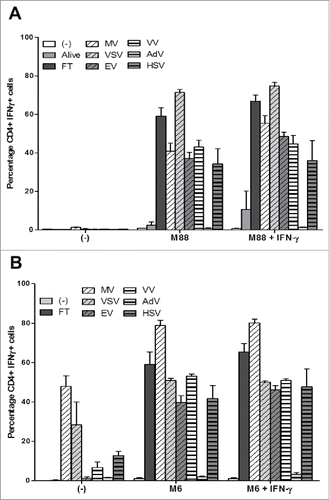
We then confirmed this result using the autologous model with M6 as NY-ESO-1 donor and presenting cell line ( and supplemental figure 2). M6 alone or pretreated with IFN-γ was not recognized by the NY67 clone at the difference of the previous series of experiments presented on and , where it was weakly recognized. Nonetheless, when M6 was co-cultured with M6 that had been infected with the different OV, like with the allogeneic model we observed a strong activation of the NY67 clone, except in the condition where M6 was co-cultured with M6 infected by AdV. It was surprising that EV was able to induce the intercellular transfer of NY-ESO-1, since we failed to observe an oncolytic activity of this virus on M6 (). We also observed that M6 infected three days with MV, VSV and to a lesser extent VV and HSV, can be directly recognized by the NY67 clone, which was probably due to a variable fraction of alive M6 cells still present in the culture and able to present NY-ESO-1 after the 3-day infection by the different OV.
Altogether these results show that lysis of tumor cells following productive infection by an OV is able to induce the release of TAA that can reach the exogenous HLA class II pathway of tumor cells for recognition by TAA-specific CD4+ T cell.
Discussion
In this study, we show for the first time that MV and other OV, VV, VSV, HSV and EV, when they productively infect human melanoma cells, are able to induce the release of TAA such as NY-ESO-1. These TAA can then be captured by living neighboring tumor cells, in which they reach the classical exogenous HLA class II presentation pathway through the endo-lysosomal compartment. We failed to show this capacity for oncolytic adenovirus, since this OV was poorly infecting both NY-ESO-1 donor tumor cell lines. However, this OV may probably also induce the release of NY-ESO-1 when it is able to productively infect a tumor cell. Interestingly, the HLA-DP4/NY-ESO-1(157-170)-specific human CD4+ T cell clone NY67 that we used in this study develops a cytotoxic activity when activated. It allowed us to show that the intercellular transfer of NY-ESO-1 induced during tumor cell lysis by OV sensitizes tumor cells to the cytotoxic activity of the NY67 clone. This result is of great interest since it is the first demonstration that OV favor the antitumor immune response at the level of the effector phase by loading tumor cells with TAA that allow a better recognition and lysis by cytotoxic T cells.
At the difference of other OV used in this study, MV induces syncitia formation (supplemental video 3 and 4). It is thus possible that a part of NY-ESO-1 transfer is made by cell-cell fusion with MV. However, NY-ESO-1 will be transferred from one cytoplasm to another where it should fail to reach the class II presentation pathway by autophagy as we demonstrated in our previous study Citation(11). It is likely that NY-ESO-1 has to go out the cell and then be endocytosed to reach the HLA class II presentation pathway to be presented.
It is now recognized that cancer virotherapy using OV not only relies on the killing of tumor cells following productive infection, but also on the induction of antitumor immune response due to the nature of tumor cell death induced by OV (Citation18,Citation19). That recently led the field to rename antitumor virotherapy as oncolytic immunotherapy. Indeed OV productive infection leads to an immunogenic cell death that induces the activation of antigen-presenting cells such as dendritic cells (DC), which can initiate the antitumor immune response. The mechanisms of this positive effect of OV on the initiation phase of the immune response against tumor cells have been well described in vitro by us and other with MV as a model (Citation20–23). MV productive infection leads to the lysis of tumor cells that release TAA, but also some danger signals of both viral origin, such as the single strand RNA of MV, and cellular origin, such as the HMGB1 protein. These danger signals can activate DC that become able to cross-present TAA to cytotoxic CD8+ T lymphocytes, whereas cross-presentation of TAA is not observed when non immunogenic apoptosis of tumor cells is induced with UV-B irradiation. This adjuvant effect of MV on the antitumor immune response has also been observed during a phase I clinical trial Citation(24). Indeed the group of Evanthia Galanis reported the induction of T cell responses against ovarian tumor antigens after treatment of ovarian cancer patients by oncolytic Edmonston MV injected in the peritoneal cavity. In other more advanced clinical trials such as the phase II that evaluated an oncolytic vaccinia virus, the Pexastimogene devacirepvec or Pexa-Vec, for the treatment of hepatocarcinoma Citation(25) or the recent phase III that evaluated an oncolytic herpes simplex type I virus, the Talimogene laherparepvec or T-vec, for the treatment of metastatic melanoma Citation(26), evidence of the stimulation of an antitumor immune response by the OV are reported and explain the regression of metastases that are distant from the site of OV injection. These adjuvant effects that favor the initiation phase of the antitumor immune response are not limited to this phase, but also extend to the effector phase by helping the loading of tumor cells with TAA.
NY-ESO-1 is one of the most promising TAA due to the fact that it induces a broad antitumor immune response with recognition by monoclonal antibodies and CD4+ and CD8+ T cells. Furthermore, clinical trials with adoptive T cell transfer targeting this antigen show a certain degree of efficacy in absence of immunomodulators such as the checkpoint inhibitors that are expected to increase it (Citation6,Citation8–10). Furthermore, OV-mediated increase of NY-ESO-1 epitope presentation at the surface of tumor cells to cognate T cells is particularly relevant knowing that expression of NY-ESO-1 is often very heterogeneous inside the tumor Citation(27). Indeed, it is rare that all cancer cells express NY-ESO-1 in a tumor. Thus OV may represent a way to load tumor cells with NY-ESO-1 that fail to express this TAA, potentially allowing to make all the tumor cells sensitive to NY-ESO-1-specific T cell recognition in the tumor.
Oncolytic immunotherapy met its first success with the approval of T-Vec (Imlygic® from Amgen) by the US Food and Drug Administration and the European Medicines Agency for the treatment of metastatic melanoma. Several phase III clinical trials combining Imlygic with immune checkpoint inhibitors (iCPI) are on the way, since it is likely that this OV would increase efficacy of iCPI due to its stimulatory properties on the antitumor immune response. Thus, Imlygic is combined with pembrolizumab, an anti-PD-1, for treatment of unresectable stage IIIB to IVM1 c melanoma (NCT02263508) and of recurrent metastatic squamous cell carcinoma of the head and neck (NCT02626000). Imlygic is also combined with ipilimumab (anti-CTLA-4) for treatment of unresectable stage IIIB to IVM1 c melanoma (NCT01740297). The first clinical results obtained with a combination of Imlygic and ipilimumab support this idea with better clinical responses induced by the combination than each component used alone Citation(28). It is thus essential to better understand how OV influence the different phases of the antitumor immune response to optimize oncolytic immunotherapy.
Materials and methods
Cell culture
Human melanoma cell lines, M6, M18, M88 and M199 were established from fragments of metastatic tumors and registered in the Biocollection PCU892-NL (CHU Nantes, France) with informed consent from patients. Allelic typing of the HLA-DPB1 chain of melanoma cell lines was performed by the “Etablissement Francais du Sang” (Nantes) by PCR. All cell lines were maintained in RPMI-1640 medium supplemented with 10% heat-inactivated fetal calf serum (FCS), 100U/mL penicillin, 100μg/mL streptomycin and 2 mM L-glutamine (Gibco-Invitrogen) and cultured at 37°C in a 5% CO2 atmosphere. Cells were routinely checked for Mycoplasma contamination (PlasmoTestTM, InvivoGen).
The NY-ESO-1-specific CD4+ T cell clone NY67 was obtained as previously described Citation(29). The clone is cultured and maintained in RPMI-1640 medium supplemented with 8% pooled human serum, 150U/ml IL-2 (Proleukin, Prometheus Laboratories Inc), 100U/mL penicillin, 100μg/mL streptomycin and 2 mM L-glutamine.
Real-time RT-qPCR
Melanoma cell lines were seeded in 6-well plates with 0.5 × 10⁶ cells/well with or without 500IU/mL IFN-γ (Eurobio). 24 h later, total cell RNA was extracted using the Nucleospin® RNA II kit (Macherey-Nagel) and 0.5μg total RNA was reverse transcribed using MMLV reverse transcriptase (Invitrogen). PCR reactions were performed using QuantiTect primer assays (Qiagen) and Maxima SYBR Green/ROX qPCR Master Mix (Fisher Scientific) according to the manufacturer's instructions and was run on the Stratagene MX4000P thermocycler and analyzed with MxPro software. Gene expression was analyzed using QuantiTect primer pairs for CTAG1B (coding for NY-ESO-1). Results are presented relatively to the expression of a housekeeping gene that encodes the human large ribosomal protein (RPLPO).
Sequencing of the CDR3 region of the T cell receptor alpha and beta chains of the NY67 clone
RNA from 5 × 10⁶ cells from the NY67 T cell clone was extracted with RNable reagent (Eurobio) according to the supplier's instructions and dissolved in water. Reverse transcription, PCR amplification and sequencing were performed as previously described Citation(30). We followed the TCR nomenclature established by Arden et al Citation(31).
Oncolytic viruses
The live-attenuated Schwarz vaccine strain of measles virus (MV) and MV recombinant for the enhanced green fluorescent protein (MV-eGFP) were produced as previously described Citation(32). Attenuated recombinant vaccinia virus (VV) was derived from the Copenhagen strain and was deleted in the thymidine kinase and ribonucleotide reductase genes and is recombinant for the GFP. VV was propagated and titrated in chicken embryo fibroblasts as previously described Citation(13). Delta51 vesicular stomatitis virus (VSV) recombinant for the GFP was produced as described (Citation14,Citation33). rQNestin34.5v.1 is an Herpes simplex type I virus (HSV) recombinant for the eGFP also expresses the viral ICP34.5 gene under control of a nestin promoter/enhancer element in the background of an ICP6 deletion and endogeneous ICP34.5 gene deletions Citation(16). Oncolytic adenovirus Ad-TD-RFP (AdV) is a new generation adenovirus in which the E1ACR2,E1B19 K and E3gp19 K genes of human adenovirus type 5 were deleted and the RFP open reading frame was inserted into the E3gp19 K region. Rigvir (Ltd Latima, Riga, Latvia) is native enterovirus of ECHO 7 type isolated from human feces and adapted and selected for melanomas (EV) Citation(17). EV was propagated and titrated in human fibroblast Hs68 cells (ATCC-CRL-1635). In brief, monolayers of human fibroblast Hs68 cells were infected with EV at an MOI of 5 and virus was harvested by centrifugation at 3220 g for 30 min. Virus stocks were titrated on Hs68 cells by phage assay.
Videomicroscopy
One day before infection, melanoma cells were seeded in 24-well plates with 105 cells/well. Cells were then infected with MV-eGFP (MOI = 2), VV (MOI = 0.1), VSV (MOI = 0.01), HSV (MOI = 1), AdV (MOI = 100) and EV (MOI = 5). The time-lapse videomicroscopy was performed using a Leica DMI6000B microscope with a 10x objective. Images were acquired every 15 or 20 minutes for 3 to 4 days. We used MetaMorph® Microscopy Automation & Image Analysis Software (version 7.8) and Fiji Software for acquisition and analysis Citation(34).
Infection of tumor cells with OV
NY-ESO-1 donor cell lines M6 and M18 were seeded in 6-well plates with 0.5 × 10⁶ cells/well and infected with MV or MV-eGFP (MOI = 2), VV (MOI = 0.1), VSV (MOI = 0.01), HSV (MOI = 1), AdV (MOI = 100) and EV (MOI = 5). After 72 h of infection, M6 and M18 were harvested for measurement of cell death and of infection by flow cytometry or for co-culture with presenting tumor cell lines M6 or M88 and M199, respectively.
Intracellular staining of IFN-γ
Presenting tumor cell lines M88 and M199 were cultured 24 h with or without 500IU/ml IFN-γ, alone or with M18 infected by the different OV or with M18 previously lyzed by 3 freeze/thaw cycles. Presenting tumor cell line M6 was cultured 24 h with or without IFN-γ, alone, with M6 cells that had been infected with different OV or M6 previously lyzed by 3 freeze/thaw cycles.
After 24 h, they were then used to stimulate the NY-ESO-1-specific CD4+ T cell clone NY67. A part of the presenting cells cultured alone were pulsed with 10 μM NY-ESO-1(157–170) peptide, SLLMWITQCFLPVF (Eurogentech) during 1 h and washed three times. 105 presenting tumor cells were co-cultured with 105 T cells in presence of 10 μg/ml of brefeldin A (Sigma-Aldrich). After 5 h, cells were fixed by PBS 4% paraformaldehyde (Electron Microscopy Sciences) 10 min at room temperature and washed. Cells were stained with a FITC-conjugated anti-CD4 antibody (BD Pharmingen, clone RPA-T4) and a PE-conjugated anti-IFN-γ antibody (BD Pharmingen, clone B27) for 30 min in PBS containing 0.1% BSA (bovine serum albumin) and 0.1% saponin (Sigma-Aldrich). Fluorescence was measured by flow cytometry on a FACS Calibur (BD Biosciences) and analyzed using the BD CellQuest™ Pro software.
Measurement of HLA-DP expression, cell death and infection by flow cytometry
To measure HLA-DP expression on the cell surface, tumor cells were stained with an anti-HLA-DP primary monoclonal antibody (produced by the recombinant protein platform P2R–SFR François Bonamy, Nantes, clone B7.21) or an IgG1 isotype control (BD Pharmingen) and then with a secondary DyLight™ 488 Goat anti-mouse IgG antibody (BioLegend). Relative mean of fluorescence intensity (RMFI) was calculated as follow: mean fluorescence intensity obtained from staining with anti-HLA-DP antibody divided by mean fluorescence intensity obtained from staining with the isotype control antibody.
To measure the percentage of cell death of MV-infected cells, cells were labeled with an annexinV-APC/ propidium iodide (IP) labeling kit (BD Pharmingen) according to manufacturer instructions. To measure the percentage of cell death of MV-eGFP, VV, VSV, HSV, AdV and EV infected cells, cells were labeled with TO-PRO®-3 iodide (Thermo Fisher Scientific) according to manufacturer instructions. In parallel of the TO-PRO®-3 iodide assay, the percentage of infected cells was measured using GFP fluorescence for infection with MV-eGFP, VV, VSV and HSV and using RFP fluorescence for the AdV. The percentage of EV infection was determined separately by intracellular staining of the VP1 protein of EV with a specific monoclonal antibody (anti-enterovirus, clone 5-D8/1, Dako) followed by a staining with a DyLight™488-conjugated goat anti-mouse IgG (BioLegend).
Na251CrO4 cytotoxic assay
Tumor cell lines were incubated with Na251CrO4 (PerkinElmer) for 1 h at 37°C. 103 tumor cells (target) were then washed and co-cultured with NY67-specific CD4+ T cell clone (effector) in a 96-well plate for 4 h at 37°C in quadruplicate. Effector:target (E:T) ratio was 10:1. After a 4 h incubation at 37°C, 25 µl of each supernatant were collected and added to 100 µl scintillation liquid cocktail (OptiPhase “Supermix”, PerkinElmer) before liquid scintillation counting. The percentage of specific lysis was calculated as follows: (experimental release – spontaneous release)/(maximum release – spontaneous release)x100. The spontaneous release of 51Cr was determined from target cells cultured alone. The maximum release of 51Cr was obtained from target cells which were lyzed in media containing 1%Triton X-100 (Sigma-Aldrich).
Western blotting
M18 tumor cells were infected by MV and lyzed by freeze/thaw cycles in medium with 0.1% FCS. Supernatant of NI, MV and FT conditions were collected and cells from NI condition were lysed in a RIPA buffer containing Protease Inhibitor Cocktail (Sigma). The samples were sonicated for 3 cycles of 10 seconds and supernatant samples were concentrated on filter (Vivaspin turbo 4, 3000 MWCO, Sartorius). After denaturation at 95°C for 5 min in Laemmli buffer with 10% beta-mercaptoethanol, 20 μg of proteins for cellular lysate or 50 μg for supernatants were separated by SDS-polyacrylamide gel electrophoresis on 10% gels and transferred to PVDF membranes. Blots were incubated with NY-ESO-1 or actin primary antibodies (cell signaling), followed by incubation with HRP-coupled secondary antibodies. Proteins were revealed using Enhanced Chemiluminescence Detection ECL (BioRad).
supp_material_videos.zip
Download Zip (66.8 MB)Acknowledgments
We thank Philippe Hulin and the cellular and tissular core facility of Nantes University (MicroPiCell) for their expertise in video microscopy. We thank Juliette Desfrançois and the core facility of flow cytometry (Cytocell).
Disclosure statement
FT, MG and JFF are authors of patents on MV. YW is author of a patent on adenovirus. The other authors do not have conflict of interest.
Additional information
Funding
References
- Russell SJ, Peng KW, Bell JC. Oncolytic virotherapy. Nat Biotechnol. 2012;30(7):658–70. doi:10.1038/nbt.2287.
- Lichty BD, Breitbach CJ, Stojdl DF, Bell JC. Going viral with cancer immunotherapy. Nat Rev Cancer. 2014;14(8):559–67. doi:10.1038/nrc3770.
- Bartlett DL, Liu Z, Sathaiah M, Ravindranathan R, Guo Z, He Y, Guo ZS. Oncolytic viruses as therapeutic cancer vaccines. Mol Cancer. 2013;12(1):103. doi:10.1186/1476-4598-12-103.
- Workenhe ST, Mossman KL. Oncolytic virotherapy and immunogenic cancer cell death: sharpening the sword for improved cancer treatment strategies. Mol Ther. 2014; 22(2):251–6. doi:10.1038/mt.2013.220.
- Coulie PG, Van den Eynde BJ, van der Bruggen P, Boon T. Tumour antigens recognized by T lymphocytes: at the core of cancer immunotherapy. Nat Rev Cancer. 2014;14(2):135–46. doi:10.1038/nrc3670.
- Wang RF, Wang HY. Immune targets and neoantigens for cancer immunotherapy and precision medicine. Cell research. 2017;27(1):11–37. doi:10.1038/cr.2016.155.
- Jager E, Chen YT, Drijfhout JW, Karbach J, Ringhoffer M, Jager D, Arand M, Wada H, Noguchi Y, Stockert E, et al. Simultaneous humoral and cellular immune response against cancer-testis antigen NY-ESO-1: definition of human histocompatibility leukocyte antigen (HLA)-A2-binding peptide epitopes. J Exp Med. 1998;187(2):265–70. doi:10.1084/jem.187.2.265.
- Hunder NN, Wallen H, Cao J, Hendricks DW, Reilly JZ, Rodmyre R, Jungbluth A, Gnjatic S, Thompson JA, Yee C, et al. Treatment of metastatic melanoma with autologous CD4+ T cells against NY-ESO-1. N Engl J Med. 2008;358(25):2698–703. doi:10.1056/NEJMoa0800251.
- Rapoport AP, Stadtmauer EA, Binder-Scholl GK, Goloubeva O, Vogl DT, Lacey SF, Badros AZ, Garfall A, Weiss B, Finklestein J, et al. NY-ESO-1-specific TCR-engineered T cells mediate sustained antigen-specific antitumor effects in myeloma. Nat Med. 2015;21(8):914–21. doi:10.1038/nm.3910.
- Robbins PF, Kassim SH, Tran TL, Crystal JS, Morgan RA, Feldman SA, Yang JC, Dudley ME, Wunderlich JR, Sherry RM, et al. A pilot trial using lymphocytes genetically engineered with an NY-ESO-1-reactive T-cell receptor: long-term follow-up and correlates with response. Clin Cancer Res. 2015;21(5):1019–27. doi:10.1158/1078-0432.CCR-14-2708.
- Fonteneau JF, Brilot F, Munz C, Gannage M. The Tumor Antigen NY-ESO-1 Mediates Direct Recognition of Melanoma Cells by CD4+ T Cells after Intercellular Antigen Transfer. J Immunol. 2016;196(1):64–71. doi:10.4049/jimmunol.1402664.
- Munz C. Autophagy proteins in antigen processing for presentation on MHC molecules. Immunological reviews. 2016;272(1):17–27. doi:10.1111/imr.12422.
- Foloppe J, Kintz J, Futin N, Findeli A, Cordier P, Schlesinger Y, Hoffmann C, Tosch C, Balloul JM, Erbs P. Targeted delivery of a suicide gene to human colorectal tumors by a conditionally replicating vaccinia virus. Gene Ther. 2008;15(20):1361–71. doi:10.1038/gt.2008.82.
- Stojdl DF, Lichty BD, tenOever BR, Paterson JM, Power AT, Knowles S, Marius R, Reynard J, Poliquin L, Atkins H, et al. VSV strains with defects in their ability to shutdown innate immunity are potent systemic anti-cancer agents. Cancer cell. 2003;4(4):263–75. doi:10.1016/S1535-6108(03)00241-1.
- Le Boeuf F, Diallo JS, McCart JA, Thorne S, Falls T, Stanford M, Kanji F, Auer R, Brown CW, Lichty BD, et al. Synergistic interaction between oncolytic viruses augments tumor killing. Mol Ther. 2010;18(5):888–95. doi:10.1038/mt.2010.44.
- Kambara H, Okano H, Chiocca EA, Saeki Y. An oncolytic HSV-1 mutant expressing ICP34.5 under control of a nestin promoter increases survival of animals even when symptomatic from a brain tumor. Cancer Res. 2005;65(7):2832–9. doi:10.1158/0008-5472.CAN-04-3227.
- Venskus D, Kalvins I, Pjanova D, Petrovska R, Auzins J. Genetically stable oncolytic RNA virus, method of manufacturing and use thereof. European patent EP2826856. 2013 July 16.
- Coffin RS. From virotherapy to oncolytic immunotherapy: Where are we now? Curr Opin Virol. 2015;13:93–100. doi:10.1016/j.coviro.2015.06.005.
- Fonteneau JF, Achard C, Zaupa C, Foloppe J, Erbs P. Oncolytic immunotherapy: The new clinical outbreak. Oncoimmunology. 2015;5(1). e1066961. doi:10.1080/2162402X.2015.1066961.
- Achard C, Boisgerault N, Delaunay T, Tangy F, Grégoire M, Fonteneau JF. Induction of immunogenic tumor cell death by attenuated oncolytic measles virus. J Clin Cell Immunol. 2015;6:291.
- Donnelly OG, Errington-Mais F, Steele L, Hadac E, Jennings V, Scott K, Peach H, Phillips RM, Bond J, Pandha H, et al. Measles virus causes immunogenic cell death in human melanoma. Gene Ther. 2013 Jan;20(1):7–15. doi:10.1038/gt.2011.205.
- Gauvrit A, Brandler S, Sapede-Peroz C, Boisgerault N, Tangy F, Gregoire M. Measles virus induces oncolysis of mesothelioma cells and allows dendritic cells to cross-prime tumor-specific CD8 response. Cancer Res. 2008;68(12):4882–92. doi:10.1158/0008-5472.CAN-07-6265.
- Guillerme JB, Boisgerault N, Roulois D, Menager J, Combredet C, Tangy F, Fonteneau JF, Gregoire M. Measles virus vaccine-infected tumor cells induce tumor antigen cross-presentation by human plasmacytoid dendritic cells. Clin Cancer Res. 2013;19(5):1147–58. doi:10.1158/1078-0432.CCR-12-2733.
- Galanis E, Atherton PJ, Maurer MJ, Knutson KL, Dowdy SC, Cliby WA, Haluska P Jr, Long HJ, Oberg A, Aderca I, et al. Oncolytic measles virus expressing the sodium iodide symporter to treat drug-resistant ovarian cancer. Cancer Res. 2015;75(1):22–30.. doi:10.1158/0008-5472.CAN-14-2533.
- Heo J, Reid T, Ruo L, Breitbach CJ, Rose S, Bloomston M, Cho M, Lim HY, Chung HC, Kim CW, et al. Randomized dose-finding clinical trial of oncolytic immunotherapeutic vaccinia JX-594 in liver cancer. Nat Med. 2013;19(3):329–36. doi:10.1038/nm.3089.
- Andtbacka RH, Ross M, Puzanov I, Milhem M, Collichio F, Delman KA, Amatruda T, Zager JS, Cranmer L, Hsueh E, et al. Patterns of Clinical Response with Talimogene Laherparepvec (T-VEC) in Patients with Melanoma Treated in the OPTiM Phase III Clinical Trial. Annals of surgical oncology. 2016;23(13):4169–77. doi:10.1245/s10434-016-5286-0.
- Vaughan HA, Svobodova S, Macgregor D, Sturrock S, Jungbluth AA, Browning J, Davis ID, Parente P, Chen YT, Stockert E, et al. Immunohistochemical and molecular analysis of human melanomas for expression of the human cancer-testis antigens NY-ESO-1 and LAGE-1. Clin Cancer Res. 2004;10(24):8396–404. doi:10.1158/1078-0432.CCR-04-0809.
- Puzanov I, Milhem MM, Minor D, Hamid O, Li A, Chen L, Chastain M, Gorski KS, Anderson A, Chou J, et al. Talimogene Laherparepvec in Combination With Ipilimumab in Previously Untreated, Unresectable Stage IIIB-IV Melanoma. J Clin Oncol. 2016;34(22):2619–26. doi:10.1200/JCO.2016.67.1529.
- Fonteneau JF, Larsson M, Somersan S, Sanders C, Munz C, Kwok WW, Bhardwaj N, Jotereau F. Generation of high quantities of viral and tumor-specific human CD4+ and CD8+ T-cell clones using peptide pulsed mature dendritic cells. Journal of immunological methods. 2001;258(1-2):111–26. doi:10.1016/S0022-1759(01)00477-X.
- Davodeau F, Difilippantonio M, Roldan E, Malissen M, Casanova JL, Couedel C, Morcet JF, Merkenschlager M, Nussenzweig A, Bonneville M, et al. The tight interallelic positional coincidence that distinguishes T-cell receptor Jalpha usage does not result from homologous chromosomal pairing during ValphaJalpha rearrangement. EMBO J. 2001;20(17):4717–29. doi:10.1093/emboj/20.17.4717.
- Arden B, Clark SP, Kabelitz D, Mak TW. Human T-cell receptor variable gene segment families. Immunogenetics. 1995;42(6):455–500.
- Combredet C, Labrousse V, Mollet L, Lorin C, Delebecque F, Hurtrel B, McClure H, Feinberg MB, Brahic M, Tangy F. A molecularly cloned Schwarz strain of measles virus vaccine induces strong immune responses in macaques and transgenic mice. J Virol. 2003;77(21):11546–54. doi:10.1128/JVI.77.21.11546-11554.2003.
- Diallo JS, Le Boeuf F, Lai F, Cox J, Vaha-Koskela M, Abdelbary H, MacTavish H, Waite K, Falls T, Wang J, et al. A high-throughput pharmacoviral approach identifies novel oncolytic virus sensitizers. Mol Ther. 2010;18(6):1123–9. doi:10.1038/mt.2010.67.
- Schindelin J, Arganda-Carreras I, Frise E, Kaynig V, Longair M, Pietzsch T, Preibisch S, Rueden C, Saalfeld S, Schmid B, et al. Fiji: An open-source platform for biological-image analysis. Nature methods. 2012;9(7):676–82. doi:10.1038/nmeth.2019.