
ABSTRACT
Mannan binding lectin (MBL), initially known to activate the complement lectin pathway and defend against infection, was recently shown to be potentially involved in the development of several types of cancer; however, its exact role in cancers, especially its effect on tumor microenvironment remain largely unknown. Here, using a murine hepatocellular carcinoma (HCC) model, we showed that MBL was a component of liver microenvironment and MBL-deficient (MBL–/–) mice exhibited an enhanced tumor growth compared with wild-type (WT) mice. This phenomenon was associated with elevation of myeloid derived suppressed cells (MDSCs) in tumor tissue of MBL–/– mice. MBL deficiency also resulted in an increase of activated hepatic stellate cells (HSCs), which showed enhanced cyclooxygenase-2 (COX-2) expression and prostaglandin E2 (PGE2) production. Pharmacological inhibition of COX-2 in vivo partially abrogated the MBL deficiency-promoted tumor growth and MDSC accumulation. Mechanistic studies revealed that MBL could interact directly with HSCs and inhibit HCC-induced HSCs activation via downregulating the extracellular signal-regulated kinase (ERK)/COX-2/PGE2 signaling pathway. Furthermore, MBL-mediated suppression of HCC is validated by administration of MBL-expressing, liver-specific adeno-associated virus (AAV), which significantly inhibited HCC progression in MBL–/– mice. Taken together, these data reveal that MBL may impact on tumor development by shaping the tumor microenvironment via its interaction with the local stromal cells, and also suggests its potential therapeutic use for the treatment of HCC.
Introduction
The tumor microenvironment (TME), consists of the stromal cells (immune cells, mesenchymal cells), the extracellular matrix (ECM) and the molecules they secrete, plays a critical role in the onset and progression of cancer.Citation1 Understanding the regulatory mechanisms that influence the TME could reveal novel avenues for cancer treatment.Citation2 Emerging evidence indicates that the components of innate immune system serve as important players present in the TME and possess dual functions in disease progression.Citation3 Early studies demonstrated that the innate immune system could recognize and eliminate tumor cells preceding to development of adaptive antitumor immune responses, thereby playing a critical role in tumor immunosurveillance.Citation4 Recently, accumulating evidence suggests that innate immune system within the TME can also exert a tumor-promoting function.Citation5
The functional roles of humoral components of innate immunity, including complement, collectins, ficolins, and pentraxins in the TME play an important role in tumor development.Citation3,Citation6 For example, the complement initiator C1q, is deposited in the TME of several human cancers and exerts tumor-promoting functions unrelated to complement activation.Citation7 The tumor-promoting roles of C3 and C5a in the TME have also been documented.Citation8,Citation9 Moreover, the surfactant proteins A (SP-A), a member of collectin family mainly present in lungs that is highly homologous to MBL, was found to suppress lung cancer progression.Citation10
Mannan (or mannose)-binding lectin (MBL), as a major initiator of the lectin pathway of complement, is instrumental in the innate immune system that mediates phagocytosis and triggers complement cascades by binding to carbohydrate motifs.Citation11 Additionally, our recently studies showed that MBL could exert its immunomodulatory function apart from complement activation.Citation12–Citation15 Although most previous studies were focused on the contribution of MBL to infectious diseases and autoimmune diseases,Citation16 accumulating evidence suggests that MBL is also involved in development of several cancer types.Citation17 However, the effect of MBL on tumor development, especially its role in the TME remains unclear.
Emerging evidence shows that polymorphisms of MBL gene were linked to HCC (hepatocellular carcinoma) susceptibility and some gene variants can influence the progression and prognosis of HCC.Citation18–Citation21 Additionally, as a liver-specific protein that is strongly expressed in the liver microenvironment of HCC, MBL is considered to be one of the putative biomarkers for HCC.Citation22 Collectively, these data suggest that MBL in the liver microenvironment may affect the initiation and progression of HCC. However, the functional role of MBL in HCC remains to be addressed.
In this study, we utilize the MBL deficient mice and AAV-mediated rescue of hepatic MBL expression in a murine HCC model to investigate the potential role of MBL in HCC development. Our results show that, for the first time to our knowledge, MBL can suppress HCC growth by shaping the TME via regulation of the activation of tumor-associated HSCs (hepatic stellate cells).
Results
MBL deficiency promotes tumor growth in a murine HCC model
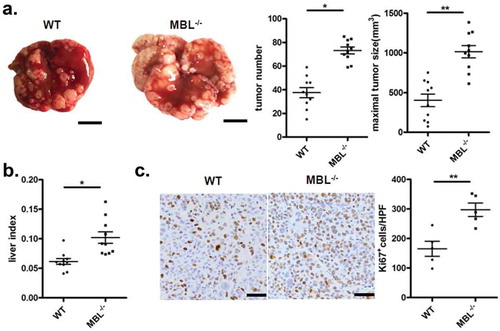
Tumor developed following the implantation of hepatoma cells in immunocompetent mice share features with naturally occurring HCC and sometimes is preferable for studying the complex tumor-host interactions for HCC.Citation23 To address the role of MBL in HCC development, we initially investigated the tumor growth in C57BL/6 WT and MBL–/– mice in a murine HCC model established by tail vein injection of Hepal-6 cells. In this model, MBL–/– mice developed about twice as many as visible tumor nodules and notable larger maximal sizes of tumors in the liver than WT mice (). Evaluating the liver: body weight ratio (liver index) showed that tumor burden was markedly higher in MBL–/– mice as compared to that in WT mice (). In addition, MBL deficiency significantly increased the proliferation of tumor cells, as determined by immunohistochemistry staining of liver Ki67 (). Similar results were observed in a DEN-induced HCC model (supplementary Figure S1). Thus, these data indicate that MBL is involved in regulation of HCC progression.
Figure 1. MBL deficiency promotes tumor growth in a murine HCC model.
WT (n = 10) and MBL–/– mice (n = 10) received a tail vein intravenously injection of 2 × 10⁶ Hepal-6 cells. After 3 weeks, mice were sacrificed and the visible liver tumor nodules, maximal tumor size (a) and liver index (b) were examined. Scale bars, 1 cm. (c) Analysis of Ki67 positive cells in tumor tissues by immunohistochemistry (each dot represents the average of 10 HPFs). Scale bars, 50 μm. Data are presented as means ± SEM (horizontal lines). HPFs, high-power fields; *, P < 0.05; **, P < 0.01.
MBL deficiency causes elevation of tumor-infiltrating MDSCs
In human, the MBL genetic system comprises one functional gene (MBL2) which encoded MBL2, whereas the rodents have two MBL isomers (Mbl1 and Mbl2) that encode MBL-A and MBL-C, respectively.Citation24 Additionally, the single human MBL gene is considered to be closely related to rodent Mbl2 rather than rodent Mbl1.Citation25 Moreover, we revealed the prevalence of MBL-C expression but not MBL-A in the liver of the WT mice by immunohistochemistry analysis (supplementary Figure S2). So we focused on the MBL-C (mice) and MBL2 (human) and used MBL to indicate both of them in the present study.
To understand the underlying mechanisms contributing to the enhanced HCC development in mice with MBL deficiency, we initially asked whether MBL might have a direct effect on tumor cells. Firstly, we observed that MBL and its mRNA expression were hardly detected in hepatoma cell line (). The immunohistochemistry analysis also showed expression of MBL in liver tissues but not in intra-tumoral region of mice with HCC or HCC patients (). Additionally, in vitro experiments revealed that MBL does not affect the proliferation and viability of HCC cells (). These results led us to consider the possibility of potential effect of MBL on the tumor microenvironment. Given that MDSCs play a crucial role in the progression of HCC through suppressing anti-tumor immune responses in the tumor microenvironment,Citation26 we focused on MDSCs in the tumor tissues of the two mice groups. Flow cytometric analysis showed that the frequency of CD11b+Gr1+ MDSCs in tumor mass of MBL–/– mice strikingly increased compared with that in the WT littermates (). Moreover, the marked elevation of CD11b+Ly6G+Ly6Clow G-MDSCs and CD11b+Ly6G−Ly6Chigh M-MDSCs was observed in tumor tissues of MBL–/– mice compared to those of WT controls (). This was also confirmed by immunohistochemical staining of Gr1 in tumor tissues from MBL–/– mice (). However, the percentage of MDSCs and their two subgroups were comparable in the liver from tumor-free WT and MBL–/– mice (supplementary Figure S3).
Figure 2. MBL does not directly affect tumor cell biology.
(a) MBL expression in mouse liver tissue, Hepal-6 cells and HepG2 cells was detected by immunoblotting analyses. (b) mRNA expression of MBL in Hepal-6 cells was determined by RT-PCR. (c) Representative images of immunohistochemistry staining of MBL in tumor tissues from mice bearing HCC or HCC patients. Scale bars, 50 μm. HepG2 cells were cultured with 0 µg/ml (blank bar), 5 µg/ml (grey bar) and 20µg/ml (black bar) MBL and then the cell proliferation (d) and apoptosis (e) was analyzed by CCK8 assay and flow cytometry, respectively. The percentages represent the frequency of the cells undergoing early apoptosis (Annexin-V+7-AAD−) or late apoptosis (Annexin-V+7-AAD+). Data from at least three independent experiments are presented as mean± SEM.
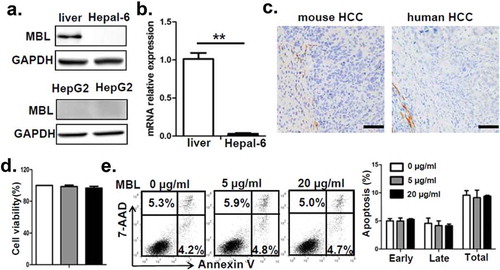
Figure 3. MBL deficiency causes elevation of MDSCs in tumor tissue.
Representative plots (left panel) and statistical analysis (right panel) of (a) MDSCs (CD11b+Gr-1+), (b) G-MDSCs (CD11b+Ly6ClowLy6G+) and M-MDSCs (CD11b+Ly6ChighLy6G−) frequency in tumor tissue of WT or MBL–/– mice were analyzed by flow cytometry. (c) Analysis of Gr-1 positive MDSCs in tumor tissues by immunohistochemistry (each dot represents the average of 10 HPFs). Scale bars, 50 μm. The percentages represent the cell frequency in CD45+ cells. The percentages of (d) IFN-γ+CD8+ cells gated on CD3+CD8+ T cells and (e) Tregs (CD25+Foxp3+ cells) frequency gated on CD4+ cell in tumor tissues of tumor-bearing mice were analyzed by flow cytometry. (f) Representative histogram showed immue-checkpoint molecule PD-L1 expression on MDSCs and PD-1 expression on CD3+CD8+ T cells and Tregs in tumor tissue of WT or MBL–/– mice. The numerical values represent the mean fluorescence intensity (MFI, WT/MBL–/–). Data are presented as means ± SEM (horizontal lines). *, P < 0.05; **, P < 0.01. The data representative of three independent experiments with similar results are shown.
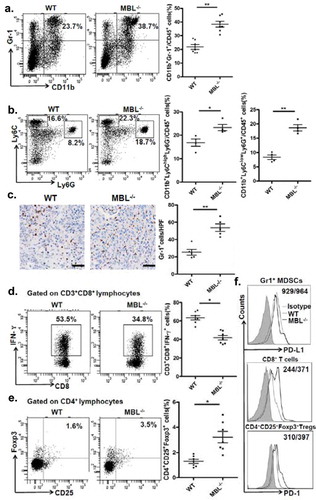
MDSCs are known to suppress anti-tumor immune responses by inhibition of CD8+ T-cell responses and/or induction of regulatory T cells (Tregs).Citation26 We therefore subsequently examined the IFN-γ+CD8+ T cells and Tregs population in tumor-bearing mice. We found that the percentage of IFN-γ+CD8+ T cells was decreased, whereas the Tregs frequency was elevated in tumor tissue of MBL–/– mice compared with that of the WT mice (). In addition, the immune checkpoint molecule PD-1 expression on CD8+ T cells and Tregs from tumor mass of MBL–/– mice were increased compared with that of the WT littermates, whereas the PD-L1 expression on MDSCs from the two mice groups are comparable (). Collectively, these data suggest that MBL absence caused more tumor-infiltrating MDSCs associated with increased immune suppression in the liver may result in enhanced tumor growth in the murine HCC model.
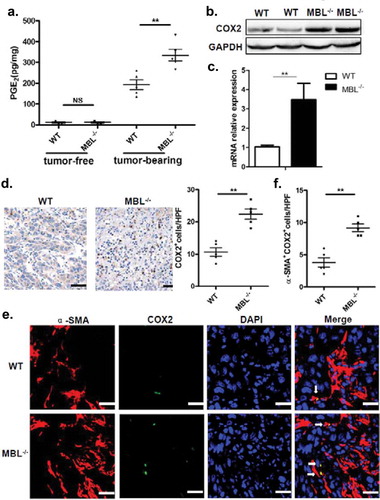
MBL deficiency was associated with increased frequency of activated HSCs accompanied by increased COX-2 expression and PGE2 production
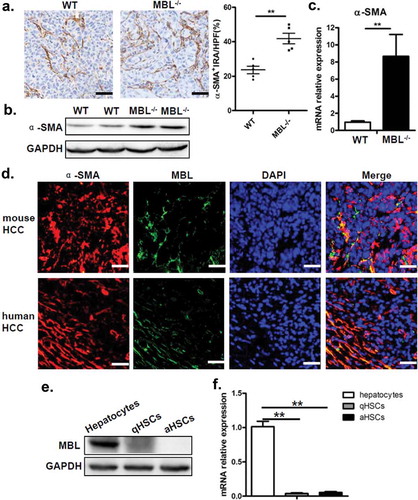
MBL effect on the accumulation of MDSCs prompted us to investigate the interaction of MBL and MDSCs in tumor tissues. Since MDSCs were not associated with MBL staining in the tumor tissue (supplementary Figure S4), we sought to explore other elements capable of affect MDSCs in the liver tumor microenvironment. Recent evidence has shown that activation of HSCs, which are the major subtype of stromal cells in the tumor microenvironment of liver cancer, was required for accumulation of MDSCs through the COX-2-PGE2 pathway.Citation27 Therefore, we subsequently assessed whether the activation status of HSCs and COX-2/PGE2 expression in tumor tissues were altered by MBL deficiency. We performed immunohistochemical staining of α-SMA to evaluate the activation of HSCs and noted that the density of activated HSCs in tumor tissues was strikingly higher in MBL–/– mice compared to that in WT mice (). Whereas, the frequency of quiescent HSCs, which characterized by desmin staining, was comparable in these two mice groups (supplementary Figure S5). Also, levels of α-SMA protein and its mRNA expression were dramatically higher in tumor tissues of MBL–/– mice than that of WT mice (). Interestingly, we observed that MBL was colocalized with α-SMA in the peri-tumor region of mice with HCC and that of HCC patients (), although MBL protein and its mRNA expression was hardly detected in HSCs from mice and human HSC cell line LX-2 ().
Figure 4. MBL deficiency is associated with an increase of activated HSCs.
(a) Analysis of activated HSCs (α-SMA+ immunoreactive area, IRA) in tumor tissue of tumor-bearing WT and MBL–/– mice. Scale bars, 50 μm. α-SMA (b) and its mRNA expression (c) in liver tissue were analyzed by immunoblot assay and RT-PCR, respectively. (d) Immunofluorescence analysis of co-localization of MBL (green) andα-SMA (red) in situ in tumor tissues of WT mice and HCC patients. Scale bars, 25 μm. Quiescent HSCs (qHSCs) were separated from the normal WT mouse liver as described in Materials and Methods. Activated HSCs (aHSCs) were obtained by culture qHSCs with Hepal-6-CM. MBL (e) and its mRNA expression (f) in qHSCs and aHSCs were analyzed by immunoblotting and quantitative RT-PCR, respectively. Hepatocytes served as a positive control. The data representative of more than three independent experiments with similar results are shown.
PGE2 levels in tumor tissues of MBL–/– mice were notably increased compared to that of WT counterparts (). In addition, as a key regulator of PGE2 synthesis, COX-2 protein and its mRNA expression were all markedly elevated in tumor tissue from MBL–/– mice than that from the WT mice (). Also, immunohistochemical staining showed the increased frequency of COX-2-expressing cells in tumor tissues of MBL–/– mice compared to that of WT mice (). Moreover, we observed that COX-2 was predominantly expressed by activated HSCs in tumor tissues (). Collectively, these results suggest that increased frequency of activated HSCs with COX-2/PGE2 overexpression might contribute to the enhanced HCC development in MBL deficient mice.
Figure 5. MBL deficiency correlates with elevated COX-2 expression and PGE2 production.
(a) The liver homogenate was collected to detect the PGE2 production by ELISA. COX-2 protein (b) and its mRNA expression (c) in tumor tissues were analyzed by immunoblotting and quantitative RT-PCR, respectively. (d) Analysis of COX-2 positive cells in tumor tissues by immunohistochemistry (each dot represents the average of 10 HPFs). (e) Immunofluorescence double staining of COX-2 (green) and α-SMA+ cells (red) and (f) quantification of α-SMA+ cells with COX-2 overexpression (white arrow) in tumor tissues of tumor-bearing mice. Nuclei were counterstained with DAPI (blue). Scale bars, 25 μm. Each dot represents the average percentages of cells indicated by arrow on 10 HPFs. Data are presented as means ± SEM (horizontal lines). *, P < 0.05; **, P < 0.01. The data representative of more than three independent experiments with similar results are shown.
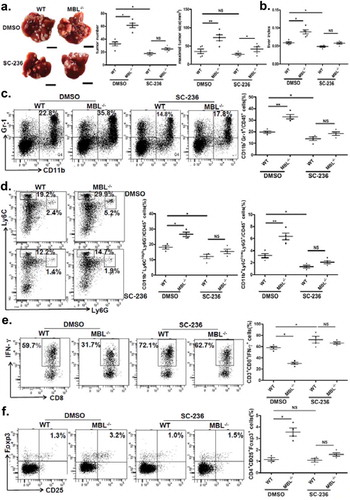
The COX-2/PGE2 pathway was involved in MBL deficiency-promoted tumor growth
The results described earlier, together with the previous study showing that COX-2/PGE2 expression promotes HCC progression by facilitating MDSC accumulation in tumor,Citation27 suggested that the COX-2/PGE2 pathway might be involved in elevation of tumor-infiltrating MDSCs and accelerated HCC development in the absence of MBL. Indeed, we showed the alteration of MDSCs accumulation and tumor growth upon use of selective COX-2 inhibitor, SC-236. As expected, it did inhibit the COX-2 expression and the PEG2 production in liver (supplementary Figure S6). Even though SC-236 treatment could suppress tumor growth, there were no significant differences of tumor burden and numbers of visible tumor nodules between MBL–/– mice and WT mice after SC-236 treatment, and the maximal sizes of tumor nodules were still moderately higher in MBL–/– mice than that in control mice (). We also found that the levels of CD11b+Gr1+ MDSCs as well as G-MDSCs or M-MDSCs, the percentages of IFN-γ+CD8+ cells in CD3+CD8+ T cells and Tregs (CD25+Foxp3+ cells) gated on CD4+ cells in tumor tissues were comparable between the two mice groups that received SC-236 treatment (). Whereas, it seems that COX2 inhibition does not affect MDSCs, Tregs and IFN-γ+CD8+ T cell frequency in the liver of tumor-free mice (supplementary Figure S7). These data demonstrated that inhibition of COX-2 partially abrogated the MBL deficiency-promoted tumor growth and the differences of MDSCs, IFN-γ+CD8+ T cells and Tregs levels in tumor. Together, these results indicate that COX-2/PGE2 pathway is involved in MBL-deficiency augmenting MDSCs and Tregs accumulation as well as tumor growth, which accompanied by the decreased IFN-γ+CD8+ cell level.
Figure 6. COX-2 inhibition abrogates the MBL deficiency-promoted tumor growth and MDSC accumulation.
Mice received daily intraperitoneal injections of either selective COX-2 inhibitor SC-236 or vehicle (DMSO) throughout 21 days of HCC model establishment. Mice were then sacrificed. The liver tumor nodules and maximal tumor size (a) as well as liver index (b) were examined. Scale bars, 1 cm. Representative plots and statistical analysis of (c) MDSCs (Gr-1+CD11b+), (d) G-MDSCs (CD11b+Ly6ClowLy6G+) and M-MDSCs (CD11b+Ly6ChighLy6G−) frequency in CD45+ cells in tumor tissue of the two mice groups. The percentages of (e) IFN-γ+CD8+ cells gated on CD8+ T cells and (f) Tregs (CD25+Foxp3+ cells) frequency gated on CD4+ T cell in tumor tissues of tumor-bearing mice were analyzed by flow cytometry. Data are presented as means ± SEM (horizontal lines). NS, not significant. *, P < 0.05; **, P < 0.01. The data representative of at least three independent experiments with similar results are shown.
MBL regulates ERK-mediated alteration of COX-2/PGE2 in the HSCs
Since MBL was colocalized with activated HSCs with high expression of COX-2, we next examined the effect of MBL on HSCs as well as the COX-2/PGE2 expression in HCC. Our pilot experiments showed that MBL was not expressed in human HSC line LX-2, but could bind to the surface of these cells (). LX-2 cells were cultured with or without HepG2-CM (conditioned medium from HepG2 cells) in the presence of MBL or not. HepG2-CM induced the activation of LX-2 cells, indicated by elevation of SMA (), and increased their COX-2 expression () and PGE2 production (), which was suppressed after MBL treatment. As HSCs transdifferentiate into myofibroblast-like cells during their activation via the p44/42MAPK (ERK1/2) pathway-induced COX-2 overexpression,Citation28 we also investigated whether the ERK pathway was involved in MBL-mediated inhibition of COX-2 overexpression in LX-2 cells. Western blot analysis showed that MBL reduced HepG2-CM-induced ERK phosphorylation (). Moreover, pretreatment with U0126, an inhibitor of phosphorylation of ERK, abrogated the differences of α-SMA or COX-2 expression and PGE2 production between MBL treated or untreated cells, despite their reduced expression after the treatment (). Together, these data indicate that MBL interacts with HSCs directly and downregulates HCC-induced HSCs activation via ERK-mediated COX-2/PGE2 alteration.
Figure 7. MBL regulates the ERK-mediated alteration of COX-2/PGE2 in the HSCs.
(a) Analysis of MBL expression in LX-2 cells by immunoblotting. (b) LX2 cells were incubated with biotin-labeled MBL or not, then stained with avidin-FITC. The levels of cell-bound MBL were determined by flow cytometry. LX-2 cells were cultured with HepG2-CM and/or MBL for 24h, subsequently the α-SMA, COX2, P38, ERK1/2, phosphor-P38 and phosphor-ERK1/2 levels were measured by immunoblotting (c); α-SMA and COX2 mRNA expression in these cells were confirmed by RT-PCR (d). α-SMA, COX2, ERK1/2 and phosphor-ERK1/2 levels in HepG2-CM activated LX-2 cells cultured with MBL and pretreated with U0126, an inhibitor of phosphorylation of ERK, were assayed by immunoblotting analysis (e). (f) PGE2 production in the culture supernatant was determined by ELISA. For all immunoblotting assays, GAPDH was included as the internal loading control. Data are presented as means ± SEM (horizontal lines). NS, not significant. *, P < 0.05; **, P < 0.01. The data representative of at least three independent experiments with similar results are shown.
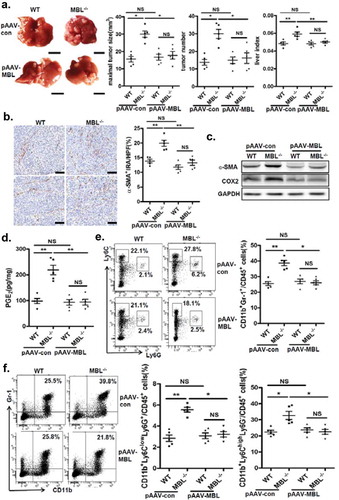
Restoration of hepatic MBL expression in MBL deficient mice abrogates the HCC growth
To determine whether restoration of hepatic MBL expression could reduce tumor growth in MBL deficient mice, we generated an Mbl2-expressing AAV. Tail vein injection of pAAV-MBL into MBL–/– mice restored MBL expression in liver (supplementary Figure S8). We next examined the tumor features in WT and MBL–/– mice that were treated with control AAV (pAAV-con) or pAAV-MBL 4 weeks before the tumor cell injection. Similar to the results shown in , MBL–/– mice after pAAV-con pretreatment developed more visible tumor nodules and notable larger maximal sizes of tumors, as well as marked higher tumor burden than WT mice (). However, pAAV-MBL delivery nearly completely eliminated the enhanced HCC growth in the absence of MBL, indicated by comparable tumor growth in WT mice and MBL–/– mice (). The results of hepatic immunohistochemical staining indicated that pAAV-MBL pretreatment decreased the density of α-SMA+ activated HSCs in MBL–/– mice, reaching a comparable level to that in WT mice (). Moreover, α-SMA and COX-2 expression (), as well as PGE2 production (), were greatly attenuated in tumor tissue from MBL–/– mice after pAAV-MBL pretreatment. In addition, flow cytometric analysis showed that the levels of MDSCs percentage (), as well as G-MDSCs and M-MDSCs () in MBL–/– mice also returned to the levels seen in WT mice following administration of pAAV-MBL. These results indicate that local MBL expression could shape tumor microenvironment via regulating HSCs activation and MDSCs accumulation, thereby suppressing the HCC progression.
Figure 8. AAV-mediated restoration of hepatic MBL abrogated MBL deficiency-promoted tumor growth.
The following parameters were measured in liver tumor tissues of WT and MBL–/– mice in the murine HCC model established as described in . pAAV-con and pAAV-MBL vectors were administered 3 weeks before hepal-6 cell injection. (a) Liver tumor number, maximal tumor size and liver index were monitored. (b) The frequency of α-SMA+ activated HSCs in liver sections was evaluated by immunohistochemistry. (c) α-SMA and COX-2 protein expression and (d) PGE2 production in the liver were determined by immunoblotting and ELISA respectively. (e) MDSCs (Gr-1+CD11b+), (f) G-MDSCs (CD11b+Ly6ClowLy6G+) and M-MDSCs (CD11b+Ly6ChighLy6G−) frequency in liver tumor tissue. The percentages represent the cell frequency in CD45+ cells. Data are presented as means ± SEM (horizontal lines). NS, not significant. *, P < 0.05; **, P < 0.01. The data representative of at least three independent experiments with similar results are shown.
Discussion
Although partially contradictive, MBL has been linked to the susceptibility, progression, and even prognosis of cancer. In this study, we have discovered that MBL deficiency promoted tumor growth in a murine HCC model, which was associated with elevation of tumor-infiltrating MDSCs and activated HSCs with increased COX-2 expression and PGE2 production. These effects were partially abrogated by in vivo COX-2 inhibition and nearly completely eliminated by the AAV-mediated rescue of hepatic MBL expression. Mechanistically, we demonstrate that MBL interacts with HSCs directly and attenuates HCC-induced HSCs activation via ERK/COX-2/PGE2 pathway. In conclusion, these data suggest that MBL deficiency leads to more COX-2 expression and PGE2 production in HSCs in the liver microenvironment of HCC, which in turn promotes accumulation of MDSCs, induction of Tregs and impairment of CD8+ T cell function in tumor, thereby accelerates tumor growth. These finding provides a new insight into the mechanism of MBL action in tumor and extends our understanding of the liver microenvironment of HCC.
MBL, as a soluble collectin, can activate the lectin complement pathway, enhance phagocytosis of microorganisms by leukocytes, and modulate inflammation.Citation29 Studies in cancer patients suggest that MBL may contribute either to the development or to the inhibition of tumor growth.Citation17 Although MBL has been suggested to have a cytotoxic effect on colon adenocarcinoma cells in vitro and in vivo following MBL binding to cancer cells, little is known about the underlying regulatory mechanisms of MBL in tumor.Citation30,Citation31 In the current study, we demonstrated an enhanced tumor growth in MBL deficient mice compared with WT mice in a murine HCC model, which could be abrogated by the AAV-mediated liver-specific MBL expression. These finding showed that local MBL exerts its anti-tumor function, consistent with the early report that vaccinia virus-mediated local MBL synthesis leading to a marked reduction in the tumor size independent of the complement activation.Citation31 Our present work also indicates that MBL is expressed in the liver tissue from both experimental and human HCC, which is supported by previous reports of the liver, particularly hepatocytes, as a pivotal source of MBL,Citation32 However, its expression can hardly be detected in the intra-tumoral region of HCC, which indicated that there was not any interaction of MBL with HCC cells. Together with the data showing that serum MBL levels in HCC patients were lower than that in healthy individuals,Citation19 our finding suggests that MBL expression decreases upon transformation of hepatocytes into malignant cells. However, this possibility needs to be further investigated. Moreover, the purified MBL protein does not have any significant effect on the proliferation and viability of HCC cells in vitro, which rules out a direct effect of MBL on tumor cells and implicate its potential contribution to liver tumor microenvironment. These data reveals that there are mechanisms by which MBL exerts its tumor suppressive role except its interaction with cancer cells as reported before.
It is well-known that MDSCs, which can be phenotypically divided into G-MDSCs and M-MDSCs subgroups, are abundant in the HCC microenvironment and play a vital role in supporting tumor progression by impairing antitumor immunity through inhibition of CD8+ T-cell responses and/or induction of TregsCitation26,Citation33 Indeed, the marked elevation of either tumor-infiltrating MDSCs or both their subgroups in MBL-deficient mice, accompanied by increased Tregs and decreased IFN-γ+CD8+ T cells, indicates that enhanced HCC growth in the absence of MBL may be attributed to the failure of immune surveillance. It has been reported that mouse ficolin-B that can activate the lectin pathway of the complement system like MBL was highly expressed in G-MDSC.Citation34 Additionally, the interaction of complement C5a and C5aR in MDSCs could affect recruitment of MDSCs and their activation.Citation8 Collectively, these data have raised the question of whether there may be an association of local MBL with MDSCs in tumor, which has been not elucidated yet. However, in the current study we observed that most MDSCs do not colocalize with MBL in situ in tumor tissue, although the interaction of MBL with MDSCs in other organs could not be excluded.
Abnormal activation of HSCs and peri-tumoral recruitment of MDSCs was one of the hallmarks of HCC progression in the liver tumor microenvironment.Citation35,Citation36 Numerous studies have shown that HSCs, which are the major subtype of stromal cells, were co-opted to promote tumor growth in both mice and human by regulating tumor-associated immune responses via induction of MDSCs and Tregs in liver cancer.Citation37,Citation38 Additionally, the previous study demonstrated that COX-2, which is the major regulator of PGE2 synthesis, as well as PGE2 was the critical factor needed for MDSCs development, accumulation, and functional stability in the cancer environment.Citation39 Recent evidence showed that activated HSCs were required for accumulation of MDSCs in tumor through the COX-2-PGE2 pathway, which in turn promoted tumor development.Citation27 In this study, we uncovered that the frequency of α-SMA+ activated HSCs in the tumor was significantly increased in MBL–/– mice. PGE2 production and the COX-2 expression were also notably increased in tumor tissues in the absence of MBL. It should be noted that COX-2 is expressed predominantly in activated HSCs, which is in agreement with a recent study reporting COX-2 overexpression and excess PGE2 production in HSCs in tumor area of nonfibrotic NASH-associated HCC patients.Citation40 In addition, the contribution of the COX-2/PGE2 pathway to the elevation of tumor-infiltrating MDSCs and tumor growth in MBL deficient mice has been further confirmed by pharmacological inhibition of COX-2 in vivo, which partially eliminates either the enhanced tumor growth or the excessive MDSCs accumulation.
The underlying regulatory mechanisms of HSC activation in TME need to be further addressed.Citation41 In this study, we observed the colocalization of MBL and α-SMA+ activated HSCs in the peri-tumor region of either mouse or human HCC, but the MBL expression was hardly detected in either mouse HSCs or human HSC line LX-2 cells. It is not surprising that MBL can bind to the surface of LX-2 cells given our recent study showing that MBL could bind to calreticulin on the T cell surfaceCitation15 and the calreticulin has been reported to be present on the LX-2 cell surface.Citation42 This finding also could be supported by the previous data demonstrated that complement components such as C5a and mannan binding lectin-associated serine protease 1 (MASP-1), as well as C1q/tumor necrosis factor related protein 3 (CTRP3) with a collagen domain and a globular C1q domain that was similar with MBL, could modulate the HSCs activation.Citation43–Citation45 Indeed, our present work showed that this MBL binding can attenuate HepG2-CM induced LX-2 cell activation, indicated by α-SMA expression. Furthermore, we demonstrated that MBL also downregulates the HepG2-CM induced COX-2 expression and PGE2 production via ERK pathway in LX-2 cells. Taking into account that COX-2 expression was provoked during HSCs activation via the p44/42MAPK (ERK1/2) pathway and its transcriptional upregulation sometimes depended on the p38MAPK pathway,Citation28,Citation46 we further examined the potential involvement of these pathways in the MBL effect on HCC-induced COX-2/PGE2 alteration. Indeed, ERK and p38 phosphorylation increased markedly during HepG2-CM-induced LX-2 activation, consistent with a previous study showing that ERK and p38 phosphorylation was a marker of HSCs activation.Citation47 Interestingly, HepG2-induced ERK phosphorylation but not p38 phosphorylation is reduced upon MBL treatment. This could be explained by the previous observation that RAS-RAF-MEK-ERK cascade may control the proliferation and differentiation of activated HSCs, but not quiescent HSCs.Citation48 Moreover, the alteration of α-SMA and COX-2 expression and PGE2 production in LX-2 cells due to MBL treatment were eliminated by inhibition of phosphorylation of ERK, indicating that the ERK pathway was involved in the MBL-mediated HSCs regulation. Taken together, these data suggest that MBL deficiency leads to enhanced COX-2 expression and PGE2 production in HSCs in the liver microenvironment of HCC, which in turn promotes accumulation of MDSCs, induction of Tregs and impairment of CD8+ T cell function in tumor, thereby accelerates tumor growth.
Since that liver is the pivotal source of MBL which is mainly produced by hepatocytes,Citation32 we have generated an MBL expression vector using AAV type 8 under the control of the liver-specific Tbg promoter as previously describedCitation49 to restore the MBL expression in MBL-deficient mice. This MBL restoration nearly completely abrogated the phenotype caused by MBL deficiency, including enhanced tumor growth, MDSCs accumulation, and increased HSCs activation. Consequently, these data provide compelling evidence that MBL may exert its tumor suppressive function in HCC suppression by regulating HSCs activation and resultant MDSCs accumulation. Therefore, our work elucidates an unknown feature of MBL function in suppression of tumor development by modifying the TME via its interaction with the mesenchymal cells. Future work is necessary to further define the mechanisms of underling MBL-mediated suppression of tumor development in TME, especially its interaction with the mesenchymal cells, and to develop potential therapeutic applications based on its antitumor activity for treatment of HCC.
Materials and methods
Mice
All experiments involving animals were approved by The Institutional Laboratory Animal Care and Use Committee at Southern Medical University (Guangzhou, P.R. China). Wild type (WT) C57BL/6J mice were purchased from Guangdong Laboratory Animal Center (Guangzhou, P.R. China). The mice deficient in MBL (MBL–/–) on a C57BL/6J background were purchased from the Jackson Laboratory in the USA. The mice were housed under specific pathogen-free conditions, on a 12-hour light-dark cycle, and with food and water ad libitum. Male 6- to 8-week-old mice were used for all the experiments in this study.
Mouse model
For orthotopic hepatocellular carcinoma (HCC) model, 2 × 10⁶ Hepa1-6 cells in 1.5 ml PBS were injected via tail-vein in 5s. The mice were sacrificed three weeks later for analysis. Their livers were weighed and removed to analyze tumor size, number of tumor nodules. The maximal tumors were measured with fine digital calipers, and the tumor volume was calculated by the following formula: tumor volume = 0.5× width2 × length. Tumor number or liver weight was evaluated in a blinded manner between WT and MBL–/– mice but not random allocation.
In vivo COX-2 inhibition
To inhibit COX-2 in vivo, mice received daily intraperitoneal injections of 200 μl of either the selective COX-2 inhibitor, SC-236 (3 mg/kg, firstly dissolved in 100% dimethylsulphoxide DMSO to make a 3 mg/ml stock solution and further diluted with PBS, R&D Systems, USA) or vehicle (10% DMSO) respectively, throughout the 21 days of HCC model establishment. This dose was chosen based on studies indicating effective selective COX-2 inhibition at this dose in rodents.Citation50
AAV-mediated hepatic MBL restoration
For hepatic MBL restoration, the AAV vector expressing mouse MBL2 under the control of the liver-specific thyroid hormone-binding globulin (Tbg) promoter was generated by Obio Technology (Shanghai, P.R. China). AAV-TBG-GFP (pAAV-control) or AAV-TBG-MBL2-GFP (pAAV-MBL) (1 × 10¹⁰ genome copies/mouse) was delivered by tail vein injection 3 weeks before Hepa1-6 cell injection.
Patient samples
Paraffin-embedded, formalin-fixed liver sections were obtained from 6 patients who underwent curative resection with HCC pathologically confirmed at Nanfang Hospital, Southern Medical University, Guangzhou, P.R. China. All samples were coded anonymously according to local ethical guidelines, as stipulated by the Declaration of Helsinki, with the written informed consent and a protocol approved by the Institutional Review Board of Nanfang Hospital, Southern Medical University.
Statistical analysis
All values were expressed as mean± SEM. Unpaired Student’s t test or one-way ANOVA was used as specified. P < 0.05 was considered significant. Statistics were calculated with GraphPad Prism version 5, GraphPad Software.
Additional methods
Detailed methods are provided in the Supplementary materials and methods.
Abbreviations
| AAV | = | adeno-associated virus |
| COX-2 | = | cyclooxygenase-2 |
| DEN | = | diethylnitrosamine |
| ECM | = | extracellular matrix |
| ERK | = | extracellular signal-regulated kinase |
| HCC | = | hepatocellular carcinoma |
| HSCs | = | hepatic stellate cells |
| MBL | = | mannan binding lectin |
| MDSCs | = | myeloid derived suppressed cells |
| PGE2 | = | prostaglandin E2 |
| SP-A | = | surfactant proteins A |
| TME | = | tumor microenvironment |
| Tregs | = | regulatory T cells |
Disclosure of potential conflicts of interest
No potential conflicts of interest were disclosed.
Author contributions
Concept, design, data acquisition and analysis/interpretation: JL, HL, YY, YL, QM, LZ, XL, XW, ZC, DZ, JZ
Manuscript drafting/revisions: JL, XW, DZ, JZ
Final approval: JL, HL, YY, YL, QM, LZ, XL, XW, ZC, DZ, JZ
Supplemental Material
Download MS Word (2.1 MB)Supplemental data for this article can be access on the publisher’s website
Additional information
Funding
Related Research Data
References
- Reina-Campos M, Moscat J, Diaz-Meco M. Metabolism shapes the tumor microenvironment. Curr Opin Cell Biol. 2017;48:47–53. doi:10.1016/j.ceb.2017.05.006.
- Chen Q, Liu GX, Liu S, Su HY, Wang Y, Li JY, Luo C. Remodeling the tumor microenvironment with emerging nanotherapeutics. Trends Pharmacol Sci. 2018;39:59–74. doi:10.1016/j.tips.2017.10.009.
- Berraondo P, Minute L, Ajona D, Corrales L, Melero I, Pio R. Innate immune mediators in cancer: between defense and resistance. Immunol Rev. 2016;274:290–306. doi:10.1111/imr.12464.
- Soloski MJ. Recognition of tumor cells by the innate immune system. Curr Opin Immunol. 2001;13:154–162.
- Hagerling C, Casbon AJ, Werb Z. Balancing the innate immune system in tumor development. Trends Cell Biol. 2015;25:214–220. doi:10.1016/j.tcb.2014.11.001.
- Bottazzi B, Doni A, Garlanda C, Mantovani A. An integrated view of humoral innate immunity: pentraxins as a paradigm. Annu Rev Immunol. 2010;28:157–183. doi:10.1146/annurev-immunol-030409-101305.
- Bulla R, Tripodo C, Rami D, Ling GS, Agostinis C, Guarnotta C, Zorzet S, Durigutto P, Botto M, Tedesco F. C1q acts in the tumour microenvironment as a cancer-promoting factor independently of complement activation. Nat Commun. 2016;7:10346. doi: 10.1038/ncomms10346.
- Markiewski MM, DeAngelis RA, Benencia F, Ricklin-Lichtsteiner SK, Koutoulaki A, Gerard C, Coukos G, Lambris JD. Modulation of the antitumor immune response by complement. Nat Immunol. 2008;9:1225–1235. doi:10.1038/ni.1655.
- Bonavita E, Gentile S, Rubino M, Maina V, Papait R, Kunderfranco P, Greco C, Feruglio F, Molgora M, Laface I, et al. PTX3 is an extrinsic oncosuppressor regulating complement-dependent inflammation in cancer. Cell. 2015;160:700–714. doi:10.1016/j.cell.2015.01.004.
- Mitsuhashi A, Goto H, Kuramoto T, Tabata S, Yukishige S, Abe S, Hanibuchi M, Kakiuchi S, Saijo A, Aono Y, et al. Surfactant protein A suppresses lung cancer progression by regulating the polarization of tumor-associated macrophages. Am J Pathol. 2013;182:1843–1853. doi:10.1016/j.ajpath.2013.01.030.
- Ip WKE, Takahashi K, Ezekowitz RA, Stuart LM. Mannose-binding lectin and innate immunity. Immunol Rev. 2009;230:9–21. doi:10.1111/j.1600-065X.2009.00789.x.
- Liu HZ, Zhou J, Ma D, Lu X, Ming SQ, Shan GQ, Zhang XY, Hou JL, Chen ZL, Zuo DM. Mannan binding lectin attenuates double-stranded RNA-mediated TLR3 activation and innate immunity. Febs Lett. 2014;588:866–872. doi:10.1016/j.febslet.2014.01.064.
- Xu XY, Li HJ, Zhang LY, Lu X, Zuo DM, Shan GQ, Xu TY, Chen ZL. Mannan-binding lectin at supraphysiological concentrations inhibits differentiation of dendritic cells from human CD14(+) monocytes. Microbiol Immunol. 2015;59:724–734. doi:10.1111/1348-0421.12337.
- Tang Y, Ma D, Ming SQ, Zhang LY, Zhou J, Shan GQ, Chen ZL, Lu X, Zuo DM. Mannan-binding lectin reduces CpG DNA-induced inflammatory cytokine production by human monocytes. Microbiol Immunol. 2015;59:231–237. doi:10.1111/1348-0421.12245.
- Zhao N, Wu J, Xiong SM, Zhang LY, Lu X, Chen SL, Wu QF, Wang HL, Liu Y, Chen ZL, et al. Mannan-binding lectin, a serum collectin, suppresses T-cell proliferation via direct interaction with cell surface calreticulin and inhibition of proximal T-cell receptor signaling. Faseb J. 2017;31:2405–2417. doi:10.1096/fj.201601200RR.
- Bouwman LH, Roep BO, Roos A. Mannose-binding lectin: clinical implications for infection, transplantation, and autoimmunity. Hum Immunol. 2006;67:247–256. doi:10.1016/j.humimm.2006.02.030.
- Swierzko AS, Kilpatrick DC, Cedzynski M. Mannan-binding lectin in malignancy. Mol Immunol. 2013;55:16–21. doi:10.1016/j.molimm.2012.09.005.
- Wang PS, Kuai J, Li H, Wang CG, Shi BJ, Zhong L. Mannose-binding lectin 2 rs11003123 polymorphism is associated with the development of hepatocellular carcinoma in patients with hepatitis B-related cirrhosis in the Chinese population. Hepatobiliary Pancreat Dis Int. 2016;15:282–288. doi:10.1016/S1499-3872(16)60050-4.
- Su C, Lin Y, Cai L, Mao Q, Niu J. Association between mannose-binding lectin variants, haplotypes and risk of hepatocellular carcinoma: A case-control study. Sci Rep. 2016;6:32147. doi:10.1038/srep32147.
- Gu X, Ji Q, Wang H, Jiang M, Yang J, Fang M, Wang M, Gao C. Genetic variants of mannose-binding lectin 2 gene influence progression and prognosis of patients with hepatitis B virus infection in China. Clin Res Hepatol Gastroenterol. 2016;40:614–621. doi:10.1016/j.clinre.2015.12.015.
- Lin Y, Su C, Niu J, Guo Z, Cai L. Impact of mannose-binding lectin 2 polymorphism on the risk of hepatocellular carcinoma: a case-control study in Chinese Han population. J Epidemiol. 2015;25:387–391. doi:10.2188/jea.JE20140194.
- Awan FM, Naz A, Obaid A, Ali A, Ahmad J, Anjum S, Janjua HA. Identification of circulating biomarker candidates for hepatocellular carcinoma (HCC): an integrated prioritization approach. Plos One. 2015;10:e0138913. doi:10.1371/journal.pone.0138913.
- Bakiri L, Wagner EF. Mouse models for liver cancer. Mol Oncol. 2013;7:206–223. doi:10.1016/j.molonc.2013.01.005.
- Rakhshandehroo M, Stienstra R, de Wit NJ, Bragt MC, Haluzik M, Mensink RP, Muller M, Kersten S. Plasma mannose-binding lectin is stimulated by PPARalpha in humans. Am J Physiol Endocrinol Metab. 2012;302:E595–602. doi:10.1152/ajpendo.00299.2011.
- Sastry R, Wang JS, Brown DC, Ezekowitz RA, Tauber AI, Sastry KN. Characterization of murine mannose-binding protein genes Mbl1 and Mbl2 reveals features common to other collectin genes. Mamm genome. 1995;6:103–110.
- Wan SS, Kuo N, Kryczek I, Zou WP, Welling TH. Myeloid cells in hepatocellular carcinoma. Hepatology. 2015;62:1304–1312. doi:10.1002/hep.27867.
- Xu YP, Zhao WX, Xu JF, Li J, Hong ZF, Yin ZY, Wang XM. Activated hepatic stellate cells promote liver cancer by induction of myeloid-derived suppressor cells through cyclooxygenase-2. Oncotarget. 2016;7:8866–8878. doi:10.18632/oncotarget.6839.
- Zhao Y, Wang YQ, Wang Q, Liu ZR, Liu QF, Deng X. Hepatic stellate cells produce vascular endothelial growth factor via phospho-p44/42 mitogen-activated protein kinase/cyclooxygenase-2 pathway. Mol Cell Biochem. 2012;359:217–223. doi:10.1007/s11010-011-1016-x.
- Choteau L, Parny M, Francois N, Bertin B, Fumery M, Dubuquoy L, Takahashi K, Colombel JF, Jouault T, Poulain D, et al. Role of mannose-binding lectin in intestinal homeostasis and fungal elimination. Mucosal Immunol. 2016;9:767–776. doi:10.1038/mi.2015.100.
- Muto S, Takada T, Matsumoto K. Biological activities of human mannose-binding lectin bound to two different ligand sugar structures, Lewis A and Lewis B antigens and high-mannose type oligosaccharides. Biochim Biophys Acta. 2001;1527:39–46.
- Ma Y, Uemura K, Oka S, Kozutsumi Y, Kawasaki N, Kawasaki T. Antitumor activity of mannan-binding protein in vivo as revealed by a virus expression system: mannan-binding proteindependent cell-mediated cytotoxicity. Proc Natl Acad Sci U S A. 1999;96:371–375.
- Bouwman LH, Roos A, Terpstra OT, De Knijff P, Van Hoek B, Verspaget HW, Berger SP, Daha MR, Frolich M, Van Der Slik AR, et al. Mannose binding lectin gene polymorphisms confer a major risk for severe infections after liver transplantation. Gastroenterology. 2005;129:408–414. doi:10.1016/j.gastro.2005.06.049.
- Ostrand-Rosenberg S, Fenselau C. Myeloid-derived suppressor cells: immune-suppressive cells that impair antitumor immunity and are sculpted by their environment. J Immunol. 2018;200:422–431. doi:10.4049/jimmunol.1701019.
- Weber-Steffens D, Hunold K, Kurschner J, Martinez SG, Elumalai P, Schmidt D, Trevani A, Runza VL, Mannel DN. Immature mouse granulocytic myeloid cells are characterized by production of ficolin-B. Mol Immunol. 2013;56:488–496. doi:10.1016/j.molimm.2013.06.015.
- Hernandez-Gea V, Toffanin S, Friedman SL, Llovet JM. Role of the microenvironment in the pathogenesis and treatment of hepatocellular carcinoma. Gastroenterology. 2013;144:512–527. doi:10.1053/j.gastro.2013.01.002.
- Eggert T, Greten TF. Tumor regulation of the tissue environment in the liver. Pharmacol Therapeut. 2017;173:47–57. doi:10.1016/j.pharmthera.2017.02.005.
- Chou HS, Hsieh CC, Yang HR, Wang LF, Arakawa Y, Brown K, Wu QY, Lin F, Peters M, Fung JJ, et al. Hepatic stellate cells regulate immune response by way of induction of myeloid suppressor cells in mice. Hepatology. 2011;53:1007–1019. doi:10.1002/hep.24162.
- Thompson AI, Conroy KP, Henderson NC. Hepatic stellate cells: central modulators of hepatic carcinogenesis. Bmc Gastroenterol. 2015;15:63. doi: 10.1186/s12876-015-0291-5.
- Obermajer N, Kalinski P. Key role of the positive feedback between PGE(2) and COX2 in the biology of myeloid-derived suppressor cells. Oncoimmunology. 2012;1:762–764. doi:10.4161/onci.19681.
- Loo TM, Kamachi F, Watanabe Y, Yoshimoto S, Kanda H, Arai Y, Nakajima-Takagi Y, Iwama A, Koga T, Sugimoto Y, et al. Gut microbiota promotes obesity-associated liver cancer through PGE2-mediated suppression of antitumor immunity. Cancer Discov. 2017;7:522–538. doi:10.1158/2159-8290.CD-16-0932.
- Tsuchida T, Friedman SL. Mechanisms of hepatic stellate cell activation. Nat Rev Gastro Hepat. 2017;14:397–411. doi:10.1038/nrgastro.2017.38.
- Qin YN, Zhong YG, Yang GL, Ma TR, Jia LY, Huang C, Li Z. Profiling of concanavalin A-binding glycoproteins in human hepatic stellate cells activated with transforming growth factor-beta 1. Molecules. 2014;19:19845–19867. doi:10.3390/molecules191219845.
- Xu RN, Lin F, He J, Jin L, Zhang JY, Fu JL, Liu HH, Wang SY, Zhang Z, Wang FS. Complement 5a stimulates hepatic stellate cells in vitro, and is increased in the plasma of patients with chronic hepatitis B. Immunology. 2013;138:228–234. doi:10.1111/imm.12024.
- Cheng CT, Yu S, Kong R, Yuan QG, Ma YF, Yang WB, Cao G, Xie LY. CTRP3 attenuates hepatic stellate cell activation through transforming growth factor-beta/Smad signaling pathway. Biomed Pharmacother. 2017;89:1387–1391. doi:10.1016/j.biopha.2017.03.021.
- Saeed A, Baloch K, Brown RJP, Wallis R, Chen L, Dexter L, McClure CP, Shakesheff K, Thomson BJ. Mannan binding lectin-associated serine protease 1 is induced by hepatitis C virus infection and activates human hepatic stellate cells. Clin Exp Immunol. 2013;174:265–273. doi:10.1111/cei.12174.
- Yoon JH, Kim KM, Kim W, Lee HS. Bile acid-mediated induction of cyclooxygenase-2 and Mcl-1 in hepatic stellate cells. Liver Int. 2006;26:30–31.
- Ochoa-Callejero L, Perez-Martinez L, Rubio-Mediavilla S, Oteo JA, Martinez A, Blanco JR. Maraviroc, a CCR5 antagonist, prevents development of hepatocellular carcinoma in a mouse model. Plos One. 2013;8:e53992. doi:10.1371/journal.pone.0053992.
- Nakhaei-Rad S, Nakhaeizadeh H, Gotze S, Kordes C, Sawitza I, Hoffmann MJ, Franke M, Schulz WA, Scheller J, Piekorz RP, et al. The role of embryonic stem cell-expressed RAS (ERAS) in the maintenance of quiescent hepatic stellate cells. J Biol Chem. 2016;291:8399–8413. doi:10.1074/jbc.M115.700088.
- Guo L, Zhang P, Chen ZM, Xia HJ, Li SM, Zhang YQ, Kobberup S, Zou WP, Lin JD. Hepatic neuregulin 4 signaling defines an endocrine checkpoint for steatosis-to-NASH progression. J Clin Invest. 2017;127:4449–4461. doi:10.1172/JCI96324.
- Dowd NP, Scully M, Adderley SR, Cunningham AJ, Fitzgerald DJ. Inhibition of cyclooxygenase-2 aggravates doxorubicin-mediated cardiac injury in vivo. J Clin Invest. 2001;108:585–590. doi:10.1172/JCI11334.