
ABSTRACT
Protective T cell responses against tumors require the production of Interferon gamma (IFN-γ). However, tumor-infiltrating T cells (TILs) gradually lose their capacity to produce IFN-γ and therefore fail to clear malignant cells. Dissecting the underlying mechanisms that block cytokine production is thus key for improving T cell products. Here we show that although TILs express substantial levels of Ifng mRNA, post-transcriptional mechanisms impede the production of IFN-γ protein due to loss of mRNA stability. CD28 triggering, but not PD1 blocking antibodies, effectively restores the stability of Ifng mRNA. Intriguingly, TILs devoid of AU-rich elements within the 3ʹuntranslated region maintain stabilized Ifng mRNA and produce more IFN-γ protein than wild-type TILs. This sustained IFN-γ production translates into effective suppression of tumor outgrowth, which is almost exclusively mediated by direct effects on the tumor cells. We therefore conclude that post-transcriptional mechanisms could be modulated to potentiate effective T cell therapies in cancer.
Introduction
Cytotoxic CD8+ T cells can be very potent in anti-tumoral therapies. In fact, more than 50% of the patients suffering from metastatic melanoma respond to T cell therapy with ex vivo expanded tumor-infiltrating T cells (TILs), of which 10–20% experience complete remissionCitation1,Citation2.
A critical feature of CD8+ T cell responses is the release of effector molecules, and the pro-inflammatory cytokine interferon gamma (IFN-γ) is key herein. Deletion of the IFN-γ gene, and loss of the IFN-γ receptor signaling pathway resulted in spontaneous tumor development in mice, and in loss of tumor suppressionCitation3,Citation4. A high IFN-γ-mediated gene signature has been associated with better survival for melanoma patientsCitation5. In addition, genetic screens revealed that modulating IFN-γ responses in tumors leads to loss of responsiveness to immunotherapiesCitation6, which is further emphasized by the fact that genetic variations of the interferon signaling pathway in humans correlate with cancer risk and survivalCitation7.
A major limitation of effective anti-tumor responses by TILs is the loss of effector function, i.e. the failure to produce effector molecules such as IFN-γ Citation8–Citation10. Several signals can drive this loss of cytokine production, such as chronic exposure to antigen and to inhibitory molecules, restriction of glucose, and increase of fatty acid oxidationCitation11-Citation16. These events, however, do not fully explain the loss of effector function within the tumor microenvironment.
Recently, post-transcriptional regulatory mechanisms have become appreciated in modulating the production of cytokines. For instance, AU-rich elements (AREs) within the 3ʹuntranslated region (3ʹUTR) determine the fate of mRNAs by regulating their stability, subcellular localization, and translationCitation17-Citation20. We found that these regulatory mechanisms differentially dictate the cytokine production of T cellsCitation21. The immediate production of IFN-γ mainly depends on rapid translation of pre-formed mRNA, whereas prolonged cytokine production relies on de novo transcription and increased mRNA stabilityCitation21. Furthermore, limited de novo transcription and the lack of Ifng mRNA stabilization effectively restricts the magnitude and duration of IFN-γ productionCitation22. Whether and how post-transcriptional regulatory mechanisms govern the production of IFN-γ in T cells during an acute infection, and how this compares to cytokine production during chronic antigen exposure in tumors is not well understood.
Here, we discovered a hitherto unappreciated role of post-transcriptional regulation that restricts the production of IFN-γ T cells within the tumor environment. Importantly, removing AREs from the Ifng locus was sufficient for TILs to retain the production of IFN-γ, and thus their capacity to suppress the tumor outgrowth. We therefore propose that adoptive T cell therapy could be potentiated by relieving IFN-γ from post-transcriptional control mechanisms.
Results
Germ-line deletion of AREs within the Ifng 3ʹUTR augments protein production upon T cell activation
We first investigated how the 3ʹUTR of Ifng mRNA controls the protein production upon T cell priming. To this end, we compared OT-I TCR transgenic T cells from wild type (WT) mice with those of ARE-Del mice that lack the ARE region within the Ifng 3ʹUTRCitation23. FACS-sorted naive WT OT-I and heterozygous ARE-Del OT-I T cells were activated for 1 day with OVA257-264 peptide-loaded bone marrow-derived dendritic cells. We then measured the production of IFN-γ upon incubation with brefeldin A for the last 3 h of culture, without the addition of exogenous peptide. Both ARE-Del and WT OT-I T cells required that dendritic cells were loaded with at least 0.1 nM peptide to reach detectable production of IFN-γ (). However, after 1 day of T cell priming ARE-Del T cells produced markedly higher levels of IFN-γ than WT OT-I T cells. This was detectable both in terms of the percentage of IFN-γ producing T cells and the amount of IFN-γ produced per cell, as measured by IFN-γ mean fluorescence intensity (, Fig S1A). The production of TNF-α, however, remained equal between WT and ARE-Del T cells (, Fig S1A). Interestingly, ARE-Del T cells continued to produce greater levels of IFN-γ also after 3 days of T cell priming (). Together, our data demonstrate that germ-line loss of AREs within the Ifng 3ʹUTR does not result in qualitative, but in quantitative differences in IFN-γ production.
Figure 1. Germ-line deletion of AREs within the Ifng 3ʹUTR induces superior IFN-γ production. (A) Naive CD44lowCD62Lhi WT and ARE-Del OT-I T cells were co-cultured for 24 h with OVA257-264 peptide-loaded bone marrow derived dendritic cells (DCs) as indicated. For the last 3 h, 1 μg/ml brefeldin A (BrfA) was added prior to analysis of IFN-γ (left) and TNF-α (right) production by intracellular cytokine staining. Graphs display percentage of cytokine producing T cells. (B) Representative dot plots of IFN-γ producing WT and ARE-Del T cells at day 1 (top), and day 3 (bottom) post activation as described in (A). (C) C57BL/6J/Ly5.1 mice received 1 × 10Citation3 naive WT, or ARE-Del OT-I T cells, and were infected the next day with 2 × 10⁴ LM-OVA. The % (left), and the IFN-γ production (right) of transferred OT-I T cells was determined in peripheral blood samples after 3 h incubation with BrfA by flow cytometry. (D) Representative IFN-γ stainings of WT (gray histograms) and ARE-Del (black line) T cells in peripheral blood at indicated time points. (E) Representative dot plots of mice rechallenged with 2 × 10⁵ LM-OVA 35 days post primary infection. 6 h and 24 h post infection, the IFN-γ production of splenic T cells was measured after 3 h incubation with BrfA. [Unpaired student t-test; (A) n = 3 mice per group; *p < 0.05. (C) n = 8 mice per group; **p < 0.005; ****p < 0.0001].
![Figure 1. Germ-line deletion of AREs within the Ifng 3ʹUTR induces superior IFN-γ production. (A) Naive CD44lowCD62Lhi WT and ARE-Del OT-I T cells were co-cultured for 24 h with OVA257-264 peptide-loaded bone marrow derived dendritic cells (DCs) as indicated. For the last 3 h, 1 μg/ml brefeldin A (BrfA) was added prior to analysis of IFN-γ (left) and TNF-α (right) production by intracellular cytokine staining. Graphs display percentage of cytokine producing T cells. (B) Representative dot plots of IFN-γ producing WT and ARE-Del T cells at day 1 (top), and day 3 (bottom) post activation as described in (A). (C) C57BL/6J/Ly5.1 mice received 1 × 10Citation3 naive WT, or ARE-Del OT-I T cells, and were infected the next day with 2 × 10⁴ LM-OVA. The % (left), and the IFN-γ production (right) of transferred OT-I T cells was determined in peripheral blood samples after 3 h incubation with BrfA by flow cytometry. (D) Representative IFN-γ stainings of WT (gray histograms) and ARE-Del (black line) T cells in peripheral blood at indicated time points. (E) Representative dot plots of mice rechallenged with 2 × 10⁵ LM-OVA 35 days post primary infection. 6 h and 24 h post infection, the IFN-γ production of splenic T cells was measured after 3 h incubation with BrfA. [Unpaired student t-test; (A) n = 3 mice per group; *p < 0.05. (C) n = 8 mice per group; **p < 0.005; ****p < 0.0001].](/cms/asset/53c1ca52-afc5-44fd-a0b7-9fe4dddee9e4/koni_a_1532762_f0001_b.gif)
ARE-del T cells respond more vigorously to primary and secondary LM-OVA infection
We next compared the in vivo responsiveness of ARE-Del T cells to an acute infection with that of WT T cells. We transferred 1 × 10³ FACS-sorted naive WT or ARE-Del OT-I T cells into C57BL/6J/Ly5.1 recipient mice and infected the mice the following day with 2.5 × 10⁴ Listeria monocytogenes expressing Ovalbumin (LM-OVACitation24). T cell expansion during the course of infection was similar between the two T cell types, as judged from the percentage of WT and ARE-Del OT-I T cells in the peripheral blood (). The ex vivo production of IFN-γ in WT T cells from peripheral blood samples peaked 9 days after infection, as determined by incubation with brefeldin A for 3 h prior to analysis (). Interestingly, ARE-Del T cells produced maximal levels of IFN-γ already at day 6 post infection, and the mean fluorescence intensity levels of IFN-γ per transferred ARE-Del T cells were substantially higher at all time points measured ().
Memory T cells become rapidly activated upon secondary infection and produce massive amounts of cytokinesCitation25,Citation26. Indeed, more than 80 ± 6% and 90 ± 2% of WT and ARE-Del memory T cells, respectively, produced IFN-γ after 6 h of reinfection with high dose LM-OVA (2.5 x 10⁵; ). At 24 h after reinfection, however, the ex vivo production of IFN-γ by WT T cells dropped by half to 36 ± 20%, whereas 75 ± 10% of ARE-Del T cells retained high IFN-γ levels (). Thus, whereas the antigen threshold for ARE-Del and WT T cells to produce cytokines is equal, ARE-Del T cells outcompete WT T cells in the magnitude and the duration of IFN-γ production.
Sustained IFN-γ production by tumor-infiltrating ARE-Del T cells
We next questioned whether ARE-Del T cells also responded more vigorously to tumor cells. We co-cultured Ovalbumin-expressing B16F10 melanoma cells (B16-OVACitation27) for 4 h with in vitro activated ARE-Del and WT OT-I effector T cellsCitation22. Again, the percentage of IFN-γ – but not of TNF-α and IL-2 – producing T cells was significantly higher in ARE-Del T cells than in WT T cells (, Fig S1B).
Figure 2. ARE-Del T cells retain IFN-γ production within the tumor environment. WT and ARE-Del OT-I T cells were activated for 20 h with MEC.B7.SigOVA cells and subsequently cultured with rIL-2 for 4 days. T cells were then (A) co-cultured for 4 h with indicated amounts of B16-OVA cells in the presence of BrfA, or (B-E) injected (1 × 10⁶ WT or ARE-Del OT-I T cells) i.v. into C57BL/6J/Ly5.1+ mice bearing B16-OVA tumors that had reached a size of ~ 8mm3. 14 days later, tumors were excised and analyzed for (B) percentage of WT and ARE-Del OT-I TILs. (C-D) Intracellular staining for CD107a, TNF-α, IL-2 (C), and IFN-γ (D) of WT and ARE-Del OT-I TILs was performed ex vivo after 4 h incubation with BrfA/monensin. (E) Spleen- and tumor-derived OT-I T cells were activated for 4 h with 100 nM OVA257–264 peptide or with PMA/ionomycin in the presence of BrfA, or were left untreated (-). For representative dot plots, see Fig S1E. (A-E) Data are representative or were pooled from 3 independently performed experiments ± SD. (A) n = 4; (B-E) n = 9–12; [Unpaired student t-test; ns = non-significant; *p < 0.05, ****p < 0.0001].
![Figure 2. ARE-Del T cells retain IFN-γ production within the tumor environment. WT and ARE-Del OT-I T cells were activated for 20 h with MEC.B7.SigOVA cells and subsequently cultured with rIL-2 for 4 days. T cells were then (A) co-cultured for 4 h with indicated amounts of B16-OVA cells in the presence of BrfA, or (B-E) injected (1 × 10⁶ WT or ARE-Del OT-I T cells) i.v. into C57BL/6J/Ly5.1+ mice bearing B16-OVA tumors that had reached a size of ~ 8mm3. 14 days later, tumors were excised and analyzed for (B) percentage of WT and ARE-Del OT-I TILs. (C-D) Intracellular staining for CD107a, TNF-α, IL-2 (C), and IFN-γ (D) of WT and ARE-Del OT-I TILs was performed ex vivo after 4 h incubation with BrfA/monensin. (E) Spleen- and tumor-derived OT-I T cells were activated for 4 h with 100 nM OVA257–264 peptide or with PMA/ionomycin in the presence of BrfA, or were left untreated (-). For representative dot plots, see Fig S1E. (A-E) Data are representative or were pooled from 3 independently performed experiments ± SD. (A) n = 4; (B-E) n = 9–12; [Unpaired student t-test; ns = non-significant; *p < 0.05, ****p < 0.0001].](/cms/asset/298d8efb-5060-494e-9b11-c7c1bd9a1cad/koni_a_1532762_f0002_b.gif)
To determine how T cells responded to established tumors in vivo, we injected 1 × 10⁶ WT or ARE Del OT-I effector T cells into B16-OVA tumor-bearing mice, which had received 3 × 10⁵ tumor cells subcutaneously 7–10 days earlier. At 14 days post T cell transfer, we could not detect any differences in the percentage of WT and ARE-Del T cell infiltrates in the tumors (TILs; ), suggesting that T cell proliferation and/or maintenance was unaffected by the ARE deletion. Also the expression levels of CD44 and CD62L, and the percentage of TILs expressing the degranulation marker CD107a were identical between WT and ARE-Del TILs (Fig S1C, and ).
Chronically activated T cells gradually lose their capacity to produce effector moleculesCitation28. In line with that, the production of TNF-α and IL-2 by WT and ARE-Del TILs was undetectable, when we measured cytokine production in tumor digests ex vivo after 4 h of incubation with brefeldin A, without adding exogenous peptide (). Also the production of IFN-γ was limited, as only 19 ± 8% of WT TILs produced detectable levels of IFN-γ (). In sharp contrast, 62 ± 10% ARE-Del T cells maintained high IFN-γ production levels (). The superior production of IFN-γ by ARE-Del T cells was independent of the tumor size (Fig S2D). Furthermore, whereas spleen-derived ARE-Del and WT T cells from tumor-bearing mice massively responded to the addition of exogenous OVA257-264 peptide by producing IFN-γ (, right panel) this was not the case for tumor-derived OT-I T cells. We could not detect higher percentages of IFN-γ, or higher production levels of OT-I TILs when additional antigen was provided (, left panel, S1E). This finding indicates that limited antigen presentation within the tumor tissue is not the cause of lower cytokine production by WT OT-I T cells. Only bypassing the proximal TCR signaling with PMA/ionomycin resulted in potent IFN-γ production of WT TILs (, Fig S1E). In conclusion, AREs within the Ifng locus promote the loss of IFN-γ production in TILs through post-transcriptional repression.
ARE-Del T cell therapy substantially delays the tumor outgrowth
To determine whether ARE-Del T cells also had a higher therapeutic potential, we followed the tumor outgrowth in B16-OVA tumor-bearing mice that were left untreated, or that received 1 × 10⁶ WT, or ARE-Del OT-I T cells. Mice that did not receive T cell therapy reached the maximal acceptable tumor size of 1000 mm3 within 20 days post tumor injection (). As previously shownCitation27, T cell therapy with WT OT-I T cells significantly delayed the tumor outgrowth (), and it increased the 50% survival rate from 18 days to 25 days (p = 0.0005; ). Remarkably, T cell transfer with ARE-Del T cells substantially extended this therapeutic effect, increasing the 50% survival rate from 25 days to a striking 43 days when compared to T cell transfer with WT T cells (p = 0.02; ). Thus, the removal of AREs within the Ifng 3ʹUTR suffices to significantly potentiate the therapeutic effects of T cell therapy.
Figure 3. Sustained IFN-γ production by ARE-Del TILs results in superior anti-tumor responses. (A) Tumor size and (B) survival of B16-OVA tumor-bearing mice that were treated with 2 × 10⁶ WT OT-I, or 2 × 10⁶ ARE-Del OT-I T cells, or left untreated (no T cells) at day 7 after tumor injection. Lack of survival was defined as death or tumor size > 1000 mm3. Data represent 2 independently performed experiments. [n = 7 mice/group; Gehan-Breslow-Wilcoxon test; p < 0.0001].
![Figure 3. Sustained IFN-γ production by ARE-Del TILs results in superior anti-tumor responses. (A) Tumor size and (B) survival of B16-OVA tumor-bearing mice that were treated with 2 × 10⁶ WT OT-I, or 2 × 10⁶ ARE-Del OT-I T cells, or left untreated (no T cells) at day 7 after tumor injection. Lack of survival was defined as death or tumor size > 1000 mm3. Data represent 2 independently performed experiments. [n = 7 mice/group; Gehan-Breslow-Wilcoxon test; p < 0.0001].](/cms/asset/72795a37-e971-4b17-a788-72e6aaa6819b/koni_a_1532762_f0003_oc.jpg)
Increased IFN-γ production by ARE-Del TILs alters the phenotype of macrophages
IFN-γ can exert pleiotropic effects on the immune system and on the inflamed tissueCitation29,Citation30. To identify the mechanisms that ARE-Del T cells use to block the tumor outgrowth, we analyzed the lymphoid and myeloid tumor infiltrates. The absolute numbers of live CD45+ cells was equal in tumors from mice treated with WT or ARE-Del T cells (). This was also reflected by similar percentages of CD3+ T cells, CD8+ T cells, CD4+ T cells, regulatory T cells, NK cells, and B cells (). Furthermore, the endogenous CD8+ T cell and NK cell infiltrates had a similar potential to produce IFN-γ or to express the degranulation marker CD107a (Fig S2A).
Figure 4. ARE-Del TIL therapy promotes the pro-inflammatory profile of tumor-associated macrophages. (A) Absolute numbers of live CD45+ infiltrates in tumors from mice that had received WT OT-I (grey) or ARE-Del OT-I (white) T cells. (B) Percentage of total CD3+ cells, CD3+CD8+OT-I− T cells (CD8+), CD3+CD4+FoxP3− T cells (CD4+), CD3+CD4+FoxP3+ regulatory T cells (Treg), CD3−NK1.1+ cells (NK), and CD3−CD19+ B cells of the CD45+ tumor-infiltrating population. (C-D) Percentage of CD11bhiLy6G/Chi, CD11bhiF4/80int, and CD11bhiF4/80hi cells of CD45+ population, and (D) representative dot plot of CD11bhiF4/80int and CD11bhiF4/80hi cells. (E) MHC-I (left) and MHC-II (right) expression levels on tumor-infiltrating CD11bhiF4/80int monocytes and CD11bhiF4/80hi macrophages. (F) CD206 expression on CD11bhiF4/80hi tumor-infiltrating macrophages. Data were pooled from 3 independently performed experiments ± SD. [(A-E) n = 12; (G) n = 6–9 mice/group; (C, F) Unpaired Student t-test; (E) One-way ANOVA with Tukey’s multiple comparison; ns = non-significant; *p < 0.05; **p < 0.005; ***p < 0.0005; ****p < 0.0001].
![Figure 4. ARE-Del TIL therapy promotes the pro-inflammatory profile of tumor-associated macrophages. (A) Absolute numbers of live CD45+ infiltrates in tumors from mice that had received WT OT-I (grey) or ARE-Del OT-I (white) T cells. (B) Percentage of total CD3+ cells, CD3+CD8+OT-I− T cells (CD8+), CD3+CD4+FoxP3− T cells (CD4+), CD3+CD4+FoxP3+ regulatory T cells (Treg), CD3−NK1.1+ cells (NK), and CD3−CD19+ B cells of the CD45+ tumor-infiltrating population. (C-D) Percentage of CD11bhiLy6G/Chi, CD11bhiF4/80int, and CD11bhiF4/80hi cells of CD45+ population, and (D) representative dot plot of CD11bhiF4/80int and CD11bhiF4/80hi cells. (E) MHC-I (left) and MHC-II (right) expression levels on tumor-infiltrating CD11bhiF4/80int monocytes and CD11bhiF4/80hi macrophages. (F) CD206 expression on CD11bhiF4/80hi tumor-infiltrating macrophages. Data were pooled from 3 independently performed experiments ± SD. [(A-E) n = 12; (G) n = 6–9 mice/group; (C, F) Unpaired Student t-test; (E) One-way ANOVA with Tukey’s multiple comparison; ns = non-significant; *p < 0.05; **p < 0.005; ***p < 0.0005; ****p < 0.0001].](/cms/asset/3b34b01d-cab2-4edd-908d-ba11cd6f5e63/koni_a_1532762_f0004_b.gif)
To determine the nature of myeloid tumor infiltrates, we distinguished three different populations based on their forward scatter/side scatter profile and the expression of CD11b, Ly6G/C and F4/80Citation31. The tumor-infiltrating CD11bhi Ly6G/Chi neutrophils were equal in tumors treated with WT and ARE-Del T cells, both in terms of percentage and their activation status as judged from the expression levels of CD63 and ICAM-1 (CD54) (; Fig S2B). Also the percentage of migrating CD11bhi F4/80int monocytes that represent the major source of macrophages in inflamed tissuesCitation31 did not change (). Yet, the percentage of fully differentiated CD11bhi F4/80hi macrophages consistently increased from 7 ± 3% in mice treated with WT T cells to 12 ± 4% in mice that received ARE-Del T cells (p = 0.0057; ). CD11bhi F4/80hi macrophages expressed higher MHC-I and MHC-II levels than the CD11bhi F4/80int monocytic fraction (). When ARE-Del T cells were transferred into tumor-bearing mice, the levels of MHC-II on fully differentiated CD11bhi F4/80hi macrophages further increased (). In addition, we observed reduced expression levels of the mannose receptor CD206 (), a marker that is associated with the anti-inflammatory phenotype of macrophagesCitation32. These findings thus indicate that the continuous IFN-γ production in tumors by ARE-Del T cells augments the numbers of tumor-associated macrophages with a pro-inflammatory phenotype.
Continuous IFN-γ production by ARE-Del T cells directly affects the tumor outgrowth
IFN-γ can also directly act on tumor cellsCitation30. Indeed, treating B16-OVA melanoma cells in vitro with recombinant IFN-γ (rIFN-γ) increased the expression levels of PD-L1, MHC-I and MHC-II, which was completely lost when the IFN-γ receptor 1 was deleted by CRISPR/Cas9 (IFN-γR−/-) (Fig S2C, D). Similarly, high expression levels of PD-L1, MHC-I and MHC-II were found on tumor cells ex vivo after treatment with WT T cells, and these markers were further enhanced upon ARE-Del T cell therapy ().
Figure 5. ARE-Del T cell therapy directly alters the tumor cell phenotype and growth. (A) Ex vivo PD-L1, MHC-I and MHC-II expression levels of tumor cells isolated from tumor-bearing mice treated with WT or ARE-Del OT-I T cells. Data pooled from 4 (PD-L1 and MHC-II; n = 19) and 2 (MHC-I; n = 6–8) independently performed experiments (mean ± SD). [Unpaired Student t-test; **p < 0.005; ***p < 0.0005]. (B-C) B16-OVA IFN-γR−/- and Cas9 control tumor cells were cultured with or without 50IU rIFN-γ. (B) Cell were counted at indicated times (mean ± SD; n = 3). (C) B16-OVA cells were labeled with CFSE, and cell proliferation was monitored by flow cytometry as determined by loss of CFSE expression. Representative of n = 3. (D) 8 days after WT or ARE-Del OT-I T cell transfer, tumor cell proliferation was assessed 2.5 h after i.p. injection of BrdU in B16-OVA tumor-bearing mice. Left: Absolute numbers of BrdU+ CD45− CD4+ B16-OVA tumor cells analyzed directly ex vivo. Right: ex vivo IFN-γ production of transferred OT-I T cells after 3 h incubation with BrfA (mean ± SD; n = 3–6 mice/group). [Unpaired Student t-test; *p < 0.05]. (E) Survival curve of mice challenged with Cas9 control or IFN-γR−/- B16-OVA cells treated with WT or ARE-Del OT-I T cells. [n = 7 and n = 6 mice per control and IFN-γR−/- groups, respectively; Gehan-Breslow-Wilcoxon test]. Data represent 2 independently performed experiments.
![Figure 5. ARE-Del T cell therapy directly alters the tumor cell phenotype and growth. (A) Ex vivo PD-L1, MHC-I and MHC-II expression levels of tumor cells isolated from tumor-bearing mice treated with WT or ARE-Del OT-I T cells. Data pooled from 4 (PD-L1 and MHC-II; n = 19) and 2 (MHC-I; n = 6–8) independently performed experiments (mean ± SD). [Unpaired Student t-test; **p < 0.005; ***p < 0.0005]. (B-C) B16-OVA IFN-γR−/- and Cas9 control tumor cells were cultured with or without 50IU rIFN-γ. (B) Cell were counted at indicated times (mean ± SD; n = 3). (C) B16-OVA cells were labeled with CFSE, and cell proliferation was monitored by flow cytometry as determined by loss of CFSE expression. Representative of n = 3. (D) 8 days after WT or ARE-Del OT-I T cell transfer, tumor cell proliferation was assessed 2.5 h after i.p. injection of BrdU in B16-OVA tumor-bearing mice. Left: Absolute numbers of BrdU+ CD45− CD4+ B16-OVA tumor cells analyzed directly ex vivo. Right: ex vivo IFN-γ production of transferred OT-I T cells after 3 h incubation with BrfA (mean ± SD; n = 3–6 mice/group). [Unpaired Student t-test; *p < 0.05]. (E) Survival curve of mice challenged with Cas9 control or IFN-γR−/- B16-OVA cells treated with WT or ARE-Del OT-I T cells. [n = 7 and n = 6 mice per control and IFN-γR−/- groups, respectively; Gehan-Breslow-Wilcoxon test]. Data represent 2 independently performed experiments.](/cms/asset/63bbf8c8-2152-4a11-a7bc-ef20e8fdcc31/koni_a_1532762_f0005_oc.jpg)
We next investigated whether IFN-γ directly affected the proliferation of tumor cells. Indeed, B16-OVA cells cultured in vitro with rIFN-γ lost their capacity to expand (). This was at least in part due to a block in proliferation as determined with the cell trace dye CFSE (). As expected, IFN-γR−/- B16-OVA cells were refractory to rIFN-γ (). Importantly, we confirmed this block of proliferation in vivo. The incorporation of thymidine analog bromodeoxyuridine (BrdU) revealed that the absolute number of B16-OVA cells in S phase (BrdU+) within tumors was lower in mice that were treated with ARE-Del T cells than when treated with WT T cells (). This decline in tumor cell proliferation directly correlated with the superior IFN-γ production by ARE-Del TILs ().
We next examinated how the loss of the IFN-γ receptor on tumor cells would affect the anti-tumoral effect of WT and ARE-Del T cells. Again, the percentage of OT-I T cell infiltrates was equal, and ARE-Del T cells maintained their superior production of IFN-γ, whether the tumors expressed IFN-γR or not (Fig S2E). However, the therapeutic advantage of ARE-Del T cells over WT T cells was completely abrogated on IFN-γR−/- tumors (). This was not a mere effect of loss of antigen presentation, because the basal levels of MHC I expression was sufficient to induce the production of IFN-γ by OT-I T cells both in vivo, and in vitro (Fig S2E, F). In conclusion, relieving IFN-γ from post-transcriptional regulation boosts the therapeutic potential of T cell therapy predominately through direct effects of IFN-γ on the tumor cells, and is at least in part due to a block in tumor cell proliferation.
Tumor-specific TILs express more Ifng mRNA than peripheral T cells in mouse and human
Our data thus far demonstrate that AREs in the Ifng 3ʹUTR regulate the loss of cytokine production in TILs. This finding corroborated with a clear discrepancy between Ifng mRNA levels and IFN-γ protein levels in tumor-derived T cells compared to spleen-derived T cells: despite the loss of IFN-γ production, WT TILs maintained higher Ifng mRNA levels than the spleen-derived OT-I T cells (). Similarly, human melanoma-specific TILs completely fail to produce IFN-γ protein upon activationCitation9,Citation33. Yet, we observed in previously published data sets that melanoma-specific TILs express higher IFNG mRNA levels as compared to their peripheral blood-derived counterpartsCitation9. Of note, ARE-Del TILs expressed yet another 2-fold more Ifng mRNA than WT TILs (), again pointing towards post-transcriptional regulation as a critical regulator in this process.
Figure 6. Superior IFN-γ production by ARE-Del TILs correlates with increased mRNA stability. (A) Ifng mRNA expression of FACS-sorted spleen- and tumor-derived OT-I T cells (pooled from 2–4 mice), 14 days after i.v. T cell transfer in B16-OVA tumor bearing mice. Data were pooled from 4 independently performed experiments (mean ± SD; n = 9 mice/group). [One-way ANOVA with Tukey’s multiple comparison; *p < 0.05; ****p < 0.0001]. (B-E) WT and ARE-Del OT-I T cells were co-cultured with B16-OVA (B-C) or MC38-OVA (D-E) cells at a 6:1 effector:target (E:T) ratio for indicated time. B16-OVA or MC38-OVA cells were refreshed daily. (B, D) Intracellular IFN-γ and TNF-α staining was performed at day 1 to 3 after adding BrfA during the last 2 h of culture. (C, E) Ifng mRNA expression was analyzed by RT-PCR. Representative dot plots (B) and pooled data ± SD (C-E) from 4 (B-C) and 2 (D-E) independently performed experiments. [Unpaired Student t-test; *p < 0.05; **p < 0.005]. (F-G) Ifng mRNA decay of resting T cells, and of T cells co-cultured in vitro with B16-OVA or MC38-OVA cells for 1 or 3 days (F), or Ifng mRNA decay of in vivo tumor derived WT and ARE-Del TILs (G) measured by adding 1 μg/ml ActD for indicated time points. Presented data are pooled from 4 (n = 5; F) and 2 (n = 5; G) independently performed experiments (mean ± SD). [Unpaired Student t-test; *p < 0.05; **p < 0.005; ***p < 0.0005].
![Figure 6. Superior IFN-γ production by ARE-Del TILs correlates with increased mRNA stability. (A) Ifng mRNA expression of FACS-sorted spleen- and tumor-derived OT-I T cells (pooled from 2–4 mice), 14 days after i.v. T cell transfer in B16-OVA tumor bearing mice. Data were pooled from 4 independently performed experiments (mean ± SD; n = 9 mice/group). [One-way ANOVA with Tukey’s multiple comparison; *p < 0.05; ****p < 0.0001]. (B-E) WT and ARE-Del OT-I T cells were co-cultured with B16-OVA (B-C) or MC38-OVA (D-E) cells at a 6:1 effector:target (E:T) ratio for indicated time. B16-OVA or MC38-OVA cells were refreshed daily. (B, D) Intracellular IFN-γ and TNF-α staining was performed at day 1 to 3 after adding BrfA during the last 2 h of culture. (C, E) Ifng mRNA expression was analyzed by RT-PCR. Representative dot plots (B) and pooled data ± SD (C-E) from 4 (B-C) and 2 (D-E) independently performed experiments. [Unpaired Student t-test; *p < 0.05; **p < 0.005]. (F-G) Ifng mRNA decay of resting T cells, and of T cells co-cultured in vitro with B16-OVA or MC38-OVA cells for 1 or 3 days (F), or Ifng mRNA decay of in vivo tumor derived WT and ARE-Del TILs (G) measured by adding 1 μg/ml ActD for indicated time points. Presented data are pooled from 4 (n = 5; F) and 2 (n = 5; G) independently performed experiments (mean ± SD). [Unpaired Student t-test; *p < 0.05; **p < 0.005; ***p < 0.0005].](/cms/asset/ffb8891b-cc82-464d-a703-2c3e17fcd5aa/koni_a_1532762_f0006_b.gif)
Superior IFN-γ production by ARE-Del T cells correlates with increased mRNA stability
To dissect the mechanisms that drive the superior IFN-γ production in ARE-Del T cells, we developed an in vitro co-culture system with tumor cells. When antigen-experienced T cells were exposed to B16-OVA tumor cells for 1 day, both WT and ARE-Del OT-I T cells potently produced IFN-γ, as defined by adding Brefeldin A for the last 2h of co-culture (). However, re-exposure to freshly seeded B16-OVA cells for a second time showed a substantial reduction of the IFN-γ production of WT T cells (from 75 ± 13% to 51 ± 6%), and this response was almost completely lost after a third exposure to B16-OVA cells (9 ± 6%; ). ARE-Del T cells, however, maintained their responsiveness to tumor cells for an extended period, with 57 ± 15% of the T cells producing IFN-γ at day 3 ().
Intriguingly, irrespective of the loss of cytokine production in WT T cells, the Ifng mRNA levels of WT and ARE-DEL T cells were indistinguishable at day 1 and 2 of co-culture with B16-OVA cells (). At day 3, however, ARE-Del T cells maintained significantly higher levels of Ifng mRNA compared to WT T cells (). Similar results were obtained when WT and ARE-Del T cells were exposed to murine colon adenocarcinoma-derived MC38-OVA cells (, Fig S3A). Also in this tumor model, ARE-Del T cells produced significantly more IFN-γ than WT T cells (, Fig S3A). Yet differences of Ifng mRNA levels between WT and ARE-Del T cells were only observed at day 3after continuous exposure to tumor cells, and not upon 1 day of co-culture ().
We next determined whether differences in mRNA stability resulted in the dissimilar Ifng mRNA levels between WT and ARE-Del T cells. Non-activated WT T cells have a t1/2 = ~ 30 min, as determined by blocking de novo transcription with Actinomycin D (; refCitation22). When T cells were cultured with B16-OVA or with MC38-OVA cells for 1 day, the Ifng mRNA stability substantially increased to t1/2 > 2 h (). However, after 3 days of co-culture, the t1/2 dropped back to ~ 1 h (). In sharp contrast, ARE-Del T cells maintained stable Ifng mRNA throughout the entire co-culture (t1/2 > 2 h; ). This disparity of Ifng mRNA turn-over rates was also found in FACS-sorted TILs from B16-OVA tumor-bearing mice that displayed a t1/2 = ~ 30 min for WT TILs as opposed to t1/2 > 1 h for ARE-Del TILs (). Together, these results demonstrate that mRNA stabilization drives elevated Ifng mRNA levels, which potentially promotes the superior and prolonged cytokine production by ARE-Del TILs within the tumor environment.
CD28 costimulation but not PD-1 blockade restores IFN-γ production through mRNA stabilization
We next sought to identify signals that promote the stabilization of Ifng mRNA in T cells. Programmed death 1 (PD-1) and Lymphocyte-activation gene 3 (Lag-3) are two exhaustion markers that are highly expressed on tumor-infiltrating T cells (, Fig S3B, C). Blocking PD-1 can effectively reinvigorate T cell responses against tumorsCitation34,Citation35. Indeed, co-culturing T cells for 3 days with B16-OVA tumors in combination with αPD-1 blocking antibody significantly increased the production of IFN-γ of WT T cells (from 9 ± 5% to 24 ± 13%; p = 0.03), and of ARE-Del T cells (from 66 ± 7% to 79 ± 8%; p = 0.04. ; S3D).
Figure 7. CD28 triggering restores Ifng mRNA stability of WT TILs. (A) Representative dot plot of PD-1 and Lag-3 expression of endogenous CD8+ TILs, WT and ARE-Del OT-I TILs analyzed directly ex vivo 14 days after T cell transfer in B16-OVA tumor bearing mice. For pooled data see Fig S2B. (B-C) WT and ARE-Del OT-I T cells were co-cultured in vitro with B16-OVA cells as described above for 3 days. When indicated, T cells were daily treated with 10 μg/ml anti-PD1 blocking antibody, with 10 μg/ml anti-CD28 antibody, with 10 μg/ml anti-CD80 and 10 μg/ml anti-CD86 blocking antibodies, or a combination thereof. (B) IFN-γ protein production was assessed by flow cytometry upon addition of BrfA during the last hour of culture. For pooled data see Fig S2C. (C) Ifng mRNA decay was measured by adding 1 μg/ml ActD for indicated time points (n = 5). Representative dot plots (B) or data pooled ± SD (C) from 4 independently performed experiments.
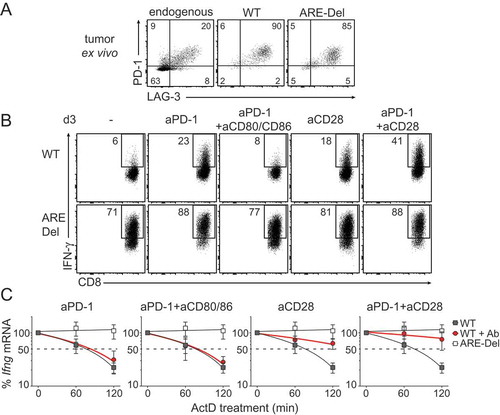
Recent studies showed that PD-1 blocks T cell function by interfering with CD28 signalingCitation36,Citation37. In line with that, CD80/CD86 blockade annihilated the increased IFN-γ production of PD-1 blockade, and reduced the IFN-γ levels back to 8 ± 4% for WT and 66 ± 13% for ARE-Del T cells (; S3D). Interestingly, providing CD28 costimulation to ARE-Del T cells did not increase the IFN-γ production when compared to untreated T cells (, bottom panel; p = 0.1). In sharp contrast, CD28 costimulation significantly restored the responsiveness of WT T cells to levels that were similiar to PD-1 blockade (from 9 ± 5% to 20 ± 11%; p = 0.04; ; S3D). Combining PD-1 blockade with CD28 costimulation even further augmented the production of IFN-γ by WT T cells when compared to single treatments (34 ± 15%; p = 0.03 compared to αPD-1; p = 0.006 compared to αCD28; ; S3C).
Because both CD28 stimulation and PD-1 blockade effectively increased the IFN-γ production in WT T cells, but only PD-1 blockade acted on ARE-Del T cells, it suggested to us that these two pathways may employ different mechanisms. We therefore determined the effect of PD-1 blockade and/or CD28 costimulation on the stability of Ifng mRNA. As expected, irrespective of the antibody treatment, the Ifng mRNA in ARE-Del T cells was always stabilized (Fig S3E). However, despite significant increases in the IFN-γ protein production, PD-1 blockade in WT T cells did not increase the Ifng mRNA levels (Fig S3F), or its stability (). mRNA levels and stability were identical between PD-1 blockade alone or in combination with αCD80/86 (, S3F). In sharp contrast, CD28 costimulation effectively stabilized Ifng mRNA in WT T (). PD-1 blockade could further potentiate the Ifng mRNA stabilization when combined with CD28 costimulation, which was also concomitant with increased Ifng mRNA levels (, S3F). Combined, whereas CD28 signaling and PD-1 blockade primarily govern IFN-γ production through different pathways, they collaborate in restoring the production of IFN-γ in tumor-exposed T cells.
Altogether, our study reveals that post-transcriptional regulation blocks the production of IFN-γ in TILs, and that loss of this regulatory mechanism could greatly improve the therapeutic effect of T cell therapy.
Discussion
The production of IFN-γ by TILs is critical for effective anti-tumoral responses. Chronic antigen exposure and immunosuppressive signals within the tumor environment, however, impede the effector function of TILs. Here, we show that the loss of IFN-γ production is linked to rapid Ifng mRNA decay that is mediated by AREs located within its 3ʹUTR.
Despite the epigenetic changes that arise early during T cell activationCitation38-Citation40, tumor-specific TILs maintain higher levels of Ifng mRNA. As human melanoma-specific TILs alikeCitation9, TILs isolated from B16-OVA tumors expressed higher levels of Ifng mRNA than blood- or spleen-derived T cells of the same antigen specificity (). Yet, TILs fail to translate the mRNA into proteinCitation9,Citation33. Even though nutritional and metabolic restrictions within the tumor environment can block protein productionCitation14-Citation16, we show here that the mere removal of ARE sequences from the Ifng 3ʹUTR is sufficient to bypass this inhibitory state. Thus, mRNA stabilization contributes to ensure effective IFN-γ production by TILs.
Which signals interfere with the stability of Ifng mRNA in TILs is yet to be determined. We previously showed that PKC signaling is critical for the stabilization of Ifng mRNA in activated T cellsCitation21. PKC can regulate the activity of RNA-binding proteins that drive mRNA stabilization in cell linesCitation41,Citation42. CD28 costimulation, which can enhance cytokine mRNA stability (refCitation43 and Salerno, Freen-van Heeren et al., bioRxiv 375840), also amplifies PKCθ signaling in T cellsCitation44,Citation45 and activate stabilizing RNA-binding proteinsCitation46. In line with that, CD28 costimulatory signals in tumor-exposed T cells effectively stabilized Ifng mRNA and restored IFN-γ protein production. This may occur by controlling the function of ARE-binding proteins through PKC.
The recovery of protein production upon PD-1 blockade was similar to that of CD28 costimulation. However, in line with recent studies that found no changes in Ifng mRNA levels and/or epigenetic signature upon PD-1 blockadeCitation38, this treatment also failed to stabilize Ifng mRNA in dysfunctional T cells (). These findings were unexpected because PD-1 signaling recruits SHP-1/2 and dephosphorylates Zap70, which in turn inactivates PKC signalingCitation47. Interestingly, PD-1 signaling recruits SHP2 also to CD28 and thus blocks T cell function by inactivating CD28 signalingCitation36. The efficacy of anti PD-1 therapy may therefore depend on the levels of actual CD28 signalingCitation37. That CD28 signaling stabilizes Ifng mRNA while PD-1 blockade fails to do so could therefore result from different signal strengths from these two antibody treatments. Alternatively, PD-1 blockade may also act on signaling pathways other than those involved in mRNA stabilization, which may or may not become engaged by CD28 costimulation. Because mRNA levels and stability do not change upon PD-1 blockade, but the IFN-γ protein production resembles that of CD28 costimulation, it is tempting to speculate that the observed IFN-γ protein production upon PD-1 blockade is mediated through increased translation efficiency. How the translational block is regulated in TILs is yet to be determined. We recently showed that the RNA-binding protein ZFP36L2 blocks translation of Ifng mRNA in memory T cells by interacting with the ARE regionCitation48. It is therefore conceivable that similar mechanisms are at play in TILs.
IFN-γ is a critical factor for anti-tumoral responsesCitation3-Citation7. Yet, continuous IFN-γ production within the tumor can also induce tumor escape mechanismsCitation49,Citation50. This effect can become detrimental when check point blockade is used to boost the endogenous immune responseCitation49. However, our study indicates that the superior IFN-γ production by depleting AREs from the 3ʹUTR may be particularly effective when effector T cells are used for therapeutic purposes. This could boost the efficacy of e.g. TIL therapy, TCR gene therapy or CAR-T cell therapy.
In conclusion, post-transcriptional regulatory mechanisms impede the production of IFN-γ by TILs. Interfering with the turn-over rate of Ifng mRNA, e.g. by genetically altering the cis-elements on the mRNA to interfere with post-transcriptional regulation, could significantly potentiate the efficacy of T cell therapy against tumors.
Material and methods
Mice and cell culture
C57BL/6J/Ly5.1 mice, C57BL/6J.OT-I (OT-I) and C57BL/6J.OT-I ARE-Del transgenic mice (ARE-Del) were bred and housed in the animal department of the Netherlands Cancer Institute (NKI). All animal experiments were performed in accordance with institutional and national guidelines and approved by the Experimental Animal Committee of the NKI. B16-OVA cellsCitation27 are tested negative for mycoplasma for > 5 years and retested every 3 months. MC38-OVA cells were kindly provided by M.Herbert-Fransen, Leiden University, and were also tested negative for mycoplasma.
Cells were cultured in IMDM (GIBCO-BRL) supplemented with 8% FCS, 15 μM 2-mercaptoethanol, 2 mM L-Glutamine, 20 U/mL penicillin G sodium, and 20 μg/mL streptomycin sulfate.
In vitro T cell activation and listeria monocytogenes-OVA infection
FACS-sorted naive CD8+CD44loCD62Lhi T cells from WT or ARE-Del OT-I splenocytes were co-cultured for 1 or 3 days with bone marrow-derived DCs loaded with indicated amounts of OVA257–264 peptide as previously describedCitation21. For infections, 1 × 10³ naive WT or ARE-Del OT-I (Ly5.2) T cells were adoptively transferred into C57BL/6J/Ly5.1 recipient mice. The next day, mice were infected i.v. with 2.5 × 10⁴ CFU Listeria monocytogenes strain expressing Ovalbumin (LM-OVA). For reinfections, mice received 2.5 × 10⁵ CFU of LM-OVA 35 days upon a first infection. 6 h and 24 h later, peripheral blood and spleens were collected, and single cell suspensions were incubated with 1 μg/ml brefeldin A for 3 h before proceeding with FACS staining.
Generation and analysis of B16-OVA IFN-γR−/- cells
IFN-γR−/- B16-OVA cells were generated using CRISPR-Cas9 and guide RNA targeting the first exon of Ifngr1: forward 5ʹTGGAGCTTTGACGAGCACTG3ʹ, reverse 5ʹCAGTGCTCGTCAAAGCTCCA 3ʹ, as predicted with the CRISPR design tool (http://crispr.mit.edu/). Guide RNA was subcloned into the PX458 vector (Addgene #48138; kind gift from F. Zang, MIT, Boston), and the Ifngr1-targeting gRNA, or the empty Cas9 vector alone was transfected into B16-OVA cells by CaPO4 transfection. GFP-expressing cells were single-cell sorted (BD FACSAria III Cell Sorter), and the Ifngr1 knockout clones was identified by Sanger sequencing (forward: 5ʹCTTGCGGACTTGGCGACTAGTCTG3ʹ, reverse: 5ʹCTGCCGTGGAAACTAACTGTAAAA3ʹ). The loss of Ifngr1 was validated by the loss of upregulation of the IFN-γ responsive genes PDL-1, MHC-I and MHC-II upon overnight exposure with 50 IU/ml recombinant murine IFN-γ (rIFN-γ, PeproTech). The proliferative capacity of IFN-γR−/- B16-OVA, and Cas9 control cells was determined by cell count and by 12.5 nM CSFE labeling over 3 days of culture.
B16 melanoma tumor model
For in vivo studies, mice were injected subcutaneously with 3 × 10⁵ B16-OVA cells, or with 3 × 10⁶ Cas9 control or IFN-γR−/- B16-OVA cells. When the tumors reached ~ 8 mm3, mice received 1–2 × 10⁶ WT or ARE-Del CD8+ OT-I/Ly5.2 T cells i.v.
For T cell transfer into tumor bearing mice, CD8+ T cells were purified from spleens and lymph nodes of WT and ARE-Del OT-I mice by MACS selection (Miltenyi CD8 isolation kit; 95–99% purity). T cells were activated as previously describedCitation22. T cells were harvested, removed from the stimuli and put to rest for 4 days at a density of 0.5 x 10⁶/ml with 120IU/ml recombinant interleukin 2 (rIL-2; Proleukin). Prior to T cell transfer dead cells were removed with Lympholyte M gradient (Cedarlane).
Tumor infiltrates were analyzed 14 days after T cells transfer. For in vivo BrdU incorporation experiments, tumor cell proliferation was studied 8 days after T cell transfer. Tumor-bearing mice received 2 mg BrdU i.p. 2.5 h prior to tumor harvest. For tumor growth studies, mice were sacrificed when the tumor enriched a size of ~ 1000 mm3. Excised tumors were cut into small pieces and digested with 100 μg/ml DNase I (Roche) and 200 U/ml Collagenase (Worthington) at 37°C for 30 min. Cells were counted, and when possible lymphocytes were enriched on a Lympholyte M gradient (Cedarlane). T cells were incubated with 1 μg/ml brefeldin A alone for 4 h or, when indicated, they were stimulated for 4 h with 100 nM OVA257–264 peptide or with 10 ng/ml PMA and 1 µM ionomycin (both Sigma-Aldrich).
For in vitro studies, WT and ARE-Del OT-I T cells were activated for 20 h with MEC.B7.SigOVA cells, cultured for 4 days with rIL-2 in the absence of antigen, and then reactivated by co-culture with pre-seeded B16-OVA or MC38-OVA cells for 1 to 3 days. B16-OVA or MC38-OVA cells were refreshed daily at a 6:1 effector:target ratio. When indicated, T cells were daily treated with 10 μg/ml of the following purified antibodies: anti-mouse CD28 (PV-1; Bioceros), anti-mouse CD279 (PD-1; 29F.1A12), anti-mouse CD80 (16-10A1), and anti-mouse CD86 (GL-1; all eBioscience).
Flow cytometry
T cells were washed with FACS buffer (phosphate-buffered saline [PBS], containing 1% FCS and 2 mM EDTA) and labeled for 20 min at 4°C with the following monoclonal antibodies (all from eBioscience): anti-CD45.1 (A20), anti-CD45.2 (104), anti-CD3 (17A2), anti-CD8 (53–6.7), anti-CD4 (GK1.5), anti-FoxP3 (FJK-16s), anti-CD44 (IM7), anti-CD62L (MEL-14), anti-CD107a (eBio1D4B), anti-PD-1 (J43), anti-Lag-3 (eBioC9B7W), anti-NK1.1 (PK136), anti-CD19 (eBio1D3), anti-CD11b (M1/70), anti-LyG6 (RB6-8C5), anti-F4/80 (BM8), anti-CD54 (3E2), anti-CD63 (NVG-2), anti-MHC I (H-2Kb) (AF6-88.5.5.3), anti-MHC II (I-A/I-E) (M5/114.15.2), anti-PDL1 (MIH5), anti-IFN-γ (XMG1.2), anti-TNF-α (MP6-XT22), anti-IL2 (JES6-5H4). Near-IR (Life Technology) was added to the cells to exclude dead cells from analysis. For intracellular cytokine staining, cells were fixed and permeabilized with the cytofix/cytoperm kit (BD Biosciences). FoxP3 expression was determined upon fixation and permeabilization with the Foxp3/Transcription Factor Staining Buffer Set (eBioscience). BrdU staining was performed using the FITC BrdU Flow Kit according to the manufacturer’s protocol (BD Biosciences). When necessary, cells were incubated with anti-CD16/CD32 blocking antibody (2.4 G2; kind gift from Louis Boon, Bioceros). Flow cytometry analysis was performed on LSR-II and LSR Fortessa (BD Biosciences). Data were analyzed with FlowJo software (Tree Star, version 10).
Quantitative PCR analysis
Total RNA was extracted using Trizol reagent (Invitrogen). cDNA was synthesized using SuperScript III Reverse Transcriptase (Invitrogen). Quantitative Real-Time PCR was performed with SYBR green, a StepOne Plus RT-PCR system (both Applied Biosystems), and with previously described primersCitation22. Reactions were performed in triplicate. Ct values were normalized to L32 levels.
mRNA decay was determined upon treatment with 1 μg/ml Actinomycin D (Sigma-Aldrich) for indicated time points. mRNA analysis of in vivo generated TILs was performed upon FACS-sorting of OT-I TILs based on the expression of congenic markers CD45.1 and CD45.2.
Statistical analysis
Results are expressed as mean ± SD. Statistical analysis between groups was performed with GraphPad Prism 6, using unpaired Student t test when comparing 2 groups, or 1-way ANOVA test with Tukey’s multiple comparison when comparing > 2 groups. Survival curve comparison was performed with a Gehan-Breslow-Wilcoxon test. P values < 0.05 were considered to be statistically significant.
Disclosures
The authors have no conflict of interest
Supplemental Material
Download Zip (2.8 MB)Acknowledgments
We would like to thank the animal caretakers from the NKI for excellent assistance, S. Engels for technical support, Dr. F. Zhang (MIT, Boston) for the PX458 vector, Dr. M. Herbert-Fransen (LUMC, Leiden, NL) for the MC38-OVA tumor cell line, and Drs. K. van Gisbergen, E. Cuadrado and R. Stark for critical reading of the manuscript.
Supplementary Material
Supplemental data for this article can be accessed here.
Additional information
Funding
Related Research Data
References
- Besser MJ, Jessen WJ, Miller SJ, Kluwe L, Mautner VF, Wallace MR, Lázaro C, Page GP, Worley PF, Aronow BJ, et al. Clinical responses in a phase II study using adoptive transfer of short-term cultured tumor infiltration lymphocytes in metastatic melanoma patients. Clin Cancer Res. 2010;16:2646–2655. doi:10.1158/1078-0432.CCR-10-0613.
- Dudley ME, Jessen WJ, Miller SJ, Kluwe L, Mautner VF, Wallace MR, Lázaro C, Page GP, Worley PF, Aronow BJ, et al. CD8+ enriched ‘young’ tumor infiltrating lymphocytes can mediate regression of metastatic melanoma. Clin Cancer Res. 2010;16:6122–6131. doi:10.1158/1078-0432.CCR-10-0613.
- Shankaran V, Ikeda H, Bruce AT, White JM, Swanson PE, Old LJ, Schreiber RD. IFNgamma and lymphocytes prevent primary tumour development and shape tumour immunogenicity. Nature. 2001;410:1107–1111. doi:10.1038/35074122.
- Dighe AS, Richards E, Old LJ, Schreiber RD. Enhanced in vivo growth and resistance to rejection of tumor cells expressing dominant negative IFN gamma receptors. Immunity. 1994;1:447–456. doi:10.1016/1074-7613(94)90087-6.
- Nirschl CJ, Suárez-Fariñas M, Izar B, Prakadan S, Dannenfelser R, Tirosh I, Liu Y, Zhu Q, Devi KSP, Carroll SL, et al. IFNgamma-dependent tissue-immune homeostasis is co-opted in the tumor microenvironment. Cell. 2017;170:127–141.e15. doi:10.1016/j.cell.2017.06.016.
- Patel, S. J., et al. Identification of essential genes for cancer immunotherapy. Nature. 2017;548:537–542. doi:10.1038/nature23004.
- Slattery ML, Lundgreen A, Bondurant KL, Wolff RK. Interferon-signaling pathway: associations with colon and rectal cancer risk and subsequent survival. Carcinogenesis. 2011;32:1660–1667. doi:10.1093/carcin/bgr189.
- Appay V, Jandus C, Voelter V, Reynard S, Coupland SE, Rimoldi D, Lienard D, Guillaume P, Krieg AM, Cerottini J-C, et al. New generation vaccine induces effective melanoma-specific CD8+ T cells in the circulation but not in the tumor site. J Immunol. 2006;177:1670–1678. doi:10.4049/jimmunol.177.3.1670.
- Baitsch L, Seo D, Belfort-DeAguiar R, Lacadie C, Dzuira J, Naik S, Amarnath S, Constable RT, Sherwin RS, Sinha R. Exhaustion of tumor-specific CD8(+) T cells in metastases from melanoma patients. J Clin Invest. 2011;121:2350–2360. doi:10.1172/JCI57873.
- Harlin H, Kuna TV, Peterson AC, Meng Y, Gajewski TF. Tumor progression despite massive influx of activated CD8(+) T cells in a patient with malignant melanoma ascites. Cancer Immunol Immunother. 2006;55:1185–1197. doi:10.1007/s00262-005-0118-2.
- Iwai Y, Ishida M, Tanaka Y, Okazaki T, Honjo T, Minato N. Involvement of PD-L1 on tumor cells in the escape from host immune system and tumor immunotherapy by PD-L1 blockade. Proc Natl Acad Sci U S. 2002;99:12293–12297. doi:10.1073/pnas.192461099.
- Leach DR, Krummel MF, Allison JP. Enhancement of antitumor immunity by CTLA-4 blockade. Science. 1996;271:1734–1736. doi:10.1126/science.271.5256.1734.
- Wherry EJ, Kurachi M. Molecular and cellular insights into T cell exhaustion. Nat Rev Immunol. 2015;15:486–499. doi:10.1038/nri3862.
- Chang C-H, Qiu J, O’Sullivan D, Buck M, Noguchi T, Curtis J, Chen Q, Gindin M, Gubin M, van der Windt GW, et al. Metabolic competition in the tumor microenvironment is a driver of cancer progression. Cell. 2015;162:1229–1241. doi:10.1016/j.cell.2015.08.016.
- Patsoukis N, Bardhan K, Chatterjee P, Sari D, Liu B, Bell LN, Karoly ED, Freeman GJ, Petkova V, Seth P, et al. PD-1 alters T-cell metabolic reprogramming by inhibiting glycolysis and promoting lipolysis and fatty acid oxidation. Nat Commun. 2015;6:6692. doi:10.1038/ncomms7692.
- Ho P-C, Bihuniak J, Macintyre A, Staron M, Liu X, Amezquita R, Tsui Y-C, Cui G, Micevic G, Perales J, et al. Phosphoenolpyruvate is a metabolic checkpoint of anti-tumor T cell responses. Cell. 2015;162:1217–1228. doi:10.1016/j.cell.2015.08.012.
- Anderson P. Post-transcriptional regulons coordinate the initiation and resolution of inflammation. Nat Rev Immunol. 2010;10:24–35. doi:10.1038/nri2685.
- Kafasla P, Skliris A, Kontoyiannis DL. Post-transcriptional coordination of immunological responses by RNA-binding proteins. Nat Immunol. 2014;15:492–502. doi:10.1038/ni.2884.
- Salerno F, Wolkers MC. T-cells require post-transcriptional regulation for accurate immune responses. Biochem Soc Trans. 2015;43:1201–1207. doi:10.1042/BST20150154.
- Turner M, Galloway A, Vigorito E. Noncoding RNA and its associated proteins as regulatory elements of the immune system. Nat Immunol. 2014;15:484–491. doi:10.1038/ni.2887.
- Salerno F, Paolini NA, Stark R, von Lindern M, Wolkers MC. Distinct PKC-mediated posttranscriptional events set cytokine production kinetics in CD8 + T cells. Proc Natl Acad Sci. 2017;114:9677–9682. doi:10.1073/pnas.1704227114.
- Salerno F, Guislain A, Cansever D, Wolkers MC. TLR-mediated innate production of IFN-γ by CD8 + T cells is independent of glycolysis. J Immunol. 2016;196:3695–3705. doi:10.4049/jimmunol.1501997.
- Hodge DL, Berthet C, Coppola V, Kastenmüller W, Buschman MD, Schaughency PM, Shirota H, Scarzello AJ, Subleski JJ, Anver MR, et al. IFN-gamma AU-rich element removal promotes chronic IFN-gamma expression and autoimmunity in mice. J Autoimmun. 2014;53:33–45. doi:10.1016/j.jaut.2014.02.003.
- Zehn D, Lee S, Bevan M. Complete but curtailed T cell response to very low affinity antigen. Nature. 2009;458:211–214. doi:10.1038/nature07657.
- Masopust D, Vezys V, Marzo AL, Lefrancois L. Preferential localization of effector memory cells in nonlymphoid tissue. Science. 2001;291:2413–2417. doi:10.1126/science.1058867.
- Soudja SM, Ruiz AL, Marie JC, Lauvau G. Inflammatory monocytes activate memory CD8(+) T and innate NK lymphocytes independent of cognate antigen during microbial pathogen invasion. Immunity. 2012;37:549–562. doi:10.1016/j.immuni.2012.05.029.
- De Witte MA, Bledi Y, Atallah M, Trahtemberg U, Verbovetski I, Nahari E, Zelig O, Linial M, Mevorach D. Targeting self-antigens through allogeneic TCR gene transfer. Blood. 2006;108. doi:10.1182/blood-2006-03-013334.
- Denton AE, Russ BE, Doherty PC, Rao S, Turner SJ. Differentiation-dependent functional and epigenetic landscapes for cytokine genes in virus-specific CD8+ T cells. Proc Natl Acad Sci U S A. 2011;108:15306–15311. doi:10.1073/pnas.1112520108.
- Boehm U, Klamp T, Groot M, Howard JC. Cellular responses to interferon-gamma. Annu Rev Immunol. 1997;15:749–795. doi:10.1146/annurev.immunol.15.1.749.
- Parker BS, Rautela J, Hertzog PJ. Antitumour actions of interferons: implications for cancer therapy. Nat Rev Cancer. 2016;16:131–144. doi:10.1038/nrc.2016.14.
- Goncalves R, Zhang X, Cohen H, Debrabant A, Mosser DM, Cammas F, Alt FW, Losson R, Reina-San-Martin B. Platelet activation attracts a subpopulation of effector monocytes to sites of Leishmania major infection. J Exp Med. 2011;208:1253–1265. doi:10.1084/jem.20110118.
- Stein M, Keshav S, Harris N, Gordon S. Interleukin 4 potently enhances murine macrophage mannose receptor activity: a marker of alternative immunologic macrophage activation. J Exp Med. 1992;176:287–292. doi:10.1084/jem.176.1.287.
- Zippelius, A., et al. Effector function of human tumor-specific CD8 T cells in melanoma lesions : A state of local functional tolerance effector function of human tumor-specific CD8 T cells in melanoma lesions : A State of local functional tolerance. Cancer Res. 2004;64:2865–2873. doi:10.1158/0008-5472.CAN-03-3066.
- Iwai Y, Terawaki S, Honjo T. PD-1 blockade inhibits hematogenous spread of poorly immunogenic tumor cells by enhanced recruitment of effector T cells. Int Immunol. 2005;17:133–144. doi:10.1093/intimm/dxh194.
- Topalian, S. L., et al. Safety, activity, and immune correlates of anti-PD-1 antibody in cancer. N Engl J Med. 2012;366:2443–2454. doi:10.1056/NEJMoa1114705.
- Hui E, Cheung J, Zhu J, Su X, Taylor MJ, Wallweber HA, Sasmal DK, Huang J, Kim JM, Mellman I, et al. T cell costimulatory receptor CD28 is a primary target for PD-1-mediated inhibition. Science. 2017;355:1428–1433. doi:10.1126/science.aaf1292.
- Kamphorst AO, Wieland A, Nasti T, Yang S, Zhang R, Barber DL, Konieczny BT, Daugherty CZ, Koenig L, Yu K, et al. Rescue of exhausted CD8 T cells by PD-1-targeted therapies is CD28-dependent. Science. 2017;355:1423–1427. doi:10.1126/science.aaf0683.
- Pauken KE, Page SE, Evans CD, Osaki M. Epigenetic stability of exhausted T cells limits durability of reinvigoration by PD-1 blockade. Science. 2016;354:1160–1165. doi:10.1126/science.aal1794.
- Schietinger A, Philip M, Krisnawan VE, Chiu EY, Delrow JJ, Basom RS, Lauer P, Brockstedt DG, Knoblaugh SE, Hämmerling GJ, et al. Tumor-specific T cell dysfunction is a dynamic antigen-driven differentiation program initiated early during tumorigenesis. Immunity. 2016;45:389–401. doi:10.1016/j.immuni.2016.07.011.
- Philip M, Fairchild L, Sun L, Horste EL, Camara S, Shakiba M, Scott AC, Viale A, Lauer P, Merghoub T, et al. Chromatin states define tumour-specific T cell dysfunction and reprogramming. Nature. 2017;545:452–456. doi:10.1038/nature22367.
- Doller A, Pfeilschifter J, Eberhardt W. Signalling pathways regulating nucleo-cytoplasmic shuttling of the mRNA-binding protein HuR. Cell Signal. 2008;20:2165–2173. doi:10.1016/j.cellsig.2008.05.007.
- Zhu P, Jiang W, Cao L, Yu W, Pei Y, Yang X, Wan B, Liu JO, Yi Q, Yu L. IL-2 mRNA stabilization upon PMA stimulation is dependent on NF90-Ser647 phosphorylation by protein kinase CbetaI. J Immunol. 2010;185:5140–5149. doi:10.4049/jimmunol.1000849.
- Lindstein T, June CH, Ledbetter JA, Stella G, Thompson CB. Regulation of lymphokine messenger RNA stability by a surface-mediated T cell activation pathway. Science. 1989;244:339–343. doi:10.1126/science.244.4910.1244-b.
- Dobbins J, Gagnon E, Godec J, Pyrdol J, Vignali DAA, Sharpe AH, Wucherpfennig KW. Binding of the cytoplasmic domain of CD28 to the plasma membrane inhibits Lck recruitment and signaling. Sci Signal. 2016;9:ra75. doi:10.1126/scisignal.aaf0626.
- Yokosuka TN, Saito T. Dynamic regulation of T-cell costimulation through TCR-CD28 microclusters. Immunol Rev. 2009;229:27–40. doi:10.1111/j.1600-065X.2009.00779.x.
- Pei Y, Zhu P, Dang Y, Wu J, Yang X, Wan B, Liu JO, Yi Q, Yu L. Nuclear export of NF90 to stabilize IL-2 mRNA is mediated by AKT-dependent phosphorylation at Ser647 in response to CD28 costimulation. J Immunol. 2008;180:222–229. doi:10.4049/jimmunol.180.1.222.
- Sheppard K-A, Fitz LJ, Lee JM, Benander C, George JA, Wooters J, Qiu Y, Jussif JM, Carter LL, Wood CR, et al. PD-1 inhibits T-cell receptor induced phosphorylation of the ZAP70/CD3zeta signalosome and downstream signaling to PKCtheta. FEBS Lett. 2004;574:37–41. doi:10.1016/j.febslet.2004.07.083.
- Salerno F, Engels S, van Den Biggelaar M, van Alphen FPJ, Guislain A, Zhao W, Hodge DL, Bell SE, Medema JP, von Lindern M, et al. Translational repression of pre-formed cytokine-encoding mRNA prevents chronic activation of memory T cells. Nat Immunol. 2018;19:828–837. doi:10.1038/s41590-018-0155-6.
- Benci JL, Liang Y-L, Nowell CJ, Halls ML, Wookey PJ, Dal Maso E, Inoue A, Christopoulos A, Wootten D, Sexton PM. Tumor interferon signaling regulates a multigenic resistance program to immune checkpoint blockade. Cell. 2016;167:1540–1554.e12. doi:10.1016/j.cell.2016.09.021.
- Spranger S, Koblish HK, Horton B, Scherle PA, Newton R, Gajewski TF. Mechanism of tumor rejection with doublets of CTLA-4, PD-1/PD-L1, or IDO blockade involves restored IL-2 production and proliferation of CD8+T cells directly within the tumor microenvironment. J Immunother Cancer. 2014;2:1–14. doi:10.1186/2051-1426-2-3.