
ABSTRACT
Recent evidence has confirmed that a mutation of the isocitrate dehydrogenase (IDH) gene occurs early in gliomagenesis and contributes to suppressed immunity. The present study aimed to determine the candidate genes associated with IDH mutation status that could serve as biomarkers of immune suppression for improved prognosis prediction. Clinical information and RNA-seq gene expression data were collected for 932 glioma samples from the CGGA and TCGA databases, and differentially expressed genes in both lower-grade glioma (LGG) and glioblastoma (GBM) samples were identified according to IDH mutation status. Only one gene, interferon-stimulated exonuclease gene 20 (ISG20), with reduced expression in IDH mutant tumors, demonstrated significant prognostic value. ISG20 expression level significantly increased with increasing tumor grade, and its high expression was associated with a poor clinical outcome. Moreover, increased ISG20 expression was associated with increased infiltration of monocyte-derived macrophages and neutrophils, and suppressed adaptive immune response. ISG20 expression was also positively correlated with PD-1, PD-L1, and CTLA4 expression, along with the levels of several chemokines. We conclude that ISG20 is a useful biomarker to identify IDH-mediated immune processes in glioma and may serve as a potential therapeutic target.
Introduction
Glioma is the most common and lethal type of malignancy in the primary central nervous system (CNS).Citation1 Although patients with low-grade gliomas (LGGs) have a more favorable prognosis than those with glioblastomas (GBMs), many tend to progress to a higher grade, leading to poor survival.Citation2 Nevertheless, the outcome of glioma patients is highly variable, even among those with the same tumor grade.Citation3
Recent analyses demonstrated that an IDH1/2 mutation, encoding isocitrate dehydrogenase (IDH) gene, occurs early in gliomagenesis, affecting a common glial precursor cell population.Citation4 Patients with tumors harboring an IDH1/2 mutation (IDHmut) show significantly longer survival than those expressing wild-type IDH1/2 (IDHwt).Citation5–Citation7 IDH mutation leads to a CpG island methylator phenotype (CIMP) by modulating the methylation patterns on a genome-wide scale, changing transcriptional programs and altering the differentiation state.Citation8 CIMP is associated with microsatellite instability and longer survival in several cancers.Citation6,Citation7,Citation9–Citation13
IDHmut and IDHwt tumors differ with regards to various biological processes, including immune cell infiltration.Citation14–Citation17 Human IDH1-mutant gliomas have less infiltrating immune cells than IDH1-wild type gliomas, with global depletion of immune infiltrates, including microglia, macrophages, dendritic cells, B cells, and T cells. Accordingly, early IDHmut glioma progenitor cells have suppressed immunity compared with IDHwt cells,Citation4,Citation15,Citation18 which may be responsible for their improved clinical outcomes.Citation15 Moreover, IDHmut tumors have reduced expression of cytotoxic T lymphocyte-associated genes and interferon (IFN)-γ-inducible chemokines, as well as suppressed accumulation of T cells in the tumor compared with IDHwt tumors.Citation16 IDHwt gliomas are also characterized by more prominent regulatory T cell infiltration and higher programmed death-ligand 1 (PD-L1) expression levels than IDHmut cases.Citation17
Although IDH status clearly appears to affect the immune state and progression of glioma, the underlying mechanisms remain unclear. To elucidate these mechanisms and identify the candidate prognostic and/or therapeutic markers, we investigated the differential expression of immune-related genes and their role in glioma progression. In particular, we collected clinical and transcriptome (RNA-seq) data from The Cancer Genome Atlas (TCGA) and Chinese Glioma Genome Atlas (CGGA) databases, including 932 glioma samples. We then determined the differentially expressed immune-related genes according to IDH mutation status, analyzed separately for LGG and GBM cases, and performed pathway enrichment analysis for functional annotation.
Results
ISG20 is the only immune gene consistently increased in IDHwt glioma with prognostic value
To identify the differentially expressed immune-related genes according to IDH status, we compared their expression levels between IDHwt and IDHmut tumors. Genes were analyzed in four groups: LGG in the CGGA database (CGGA-LGG), GBM in the CGGA database (CGGA-GBM), LGG in the TCGA database (TCGA-LGG), and GBM in the TCGA database (TCGA-GBM). Twelve genes with upregulated expression in IDHmut gliomas and 71 genes with upregulated expression in IDHwt tumors were found to be significant across all four cohorts (, Table S1). The prognostic value of these genes was further evaluated (Table S2). Only one gene, ISG20, with up-regulated expression in IDHwt tumors, was found to have a consistently significant influence on patient survival across all groups.
Figure 1. Numbers of differentially expressed genes according to IDH status in four groups of samples. Genes were analyzed in four cohorts: low-grade gliomas in CGGA cohort (CGGA LGGs), glioblastomas in CGGA cohort (CGGA GBMs), low-grade gliomas in TCGA cohort (TCGA LGGs), and glioblastomas in TCGA cohort (TCGA GBMs). Genes that were both significant in Student’s t-test (p < 0.05) and SAM (FDR < 0.01) were counted. Each digit represents the number of significantly upregulated genes in the corresponding group. The overlapped genes across four groups were selected for further survival analysis.
High ISG20 expression is related to higher tumor malignancy in glioma
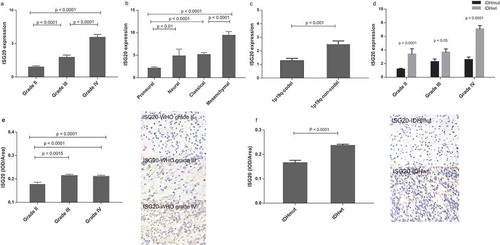
To further investigate the clinical significance of ISG20 in glioma, we analyzed the expression of ISG20 according to the World Health Organization (WHO) classification and molecular subtypes. We found that ISG20 expression level increased with increasing tumor grade (); Fig. S1A). The mesenchymal subtype of GBM showed the highest ISG20 expression level compared with the other subtypes, whereas the proneural subtype had the lowest ISG20 level (); Fig. S1B). Moreover, ISG20 expression was up-regulated in 1p/19q-non-co-deleted gliomas compared with those with 1p/19q-co-deletion (); Fig. S1C). In addition, ISG20 expression was significantly higher in IDHwt tumors compared with IDHmut tumors across all tumor grades ((d–f), Fig. S1D–F). Overall, these results suggest that ISG20 expression is suppressed in IDH mutant tumors and is associated with higher tumor malignancy.
Figure 2. Levels of ISG20 expression relative to common pathological and molecular markers in glioma. (a) ISG20 expression according to WHO grade in the CGGA dataset. (b) ISG20 expression according to GBM molecular subtypes (proneural, N = 33; neural, N = 12; classical, N = 48; mesenchymal, N = 51) in the CGGA dataset. (c) ISG20 expression according to 1p-19q-codeletion status (1p19q-codeleted, N = 63; 1p19q-non-codeleted, N = 118) in the CGGA dataset. (d) ISG20 expression according to different IDH mutation status in WHO grade II gliomas, grade III gliomas and GBMs in the CGGA dataset. WHO grade II: IDHmut, N = 94 and IDHwt, N = 15; WHO grade III: IDHmut, N = 37 and IDHwt, N = 35; WHO grade IV: IDHmut, N = 36 and IDHwt, N = 108. (e) Levels of expression and representative photographs of immunohistochemical staining of ISG20 in different grades of gliomas. (f) Levels of expression and representative photographs of immunostaining of ISG20 in IDHwt and IDHmut tumors. Positive cells are stained brown. Magnification, x400. Data are presented as means ± SEM. Student’s t-test was used to compare ISG20 expression between two groups.
ISG20 is a worse prognostic factor in gliomas
To further determine the prognostic value of ISG20, we carried out Cox regression analyses in the CGGA and TCGA databases, respectively. In the CGGA database, ISG20 emerged as an independent prognostic factor of patient survival (hazard ratio = 1.058, 95%CI = 1.024–1.093, p = 0.001), independent of age, tumor grade, chemo- and radiation therapy, IDH mutation, 1p19q-co-deletion status, and MGMT promoter methylation (). Analysis in TCGA database showed the same result (hazard ratio = 1.250, 95%CI = 1.070–1.460, p = 0.005, ). The samples were further stratified based on IDH status and tumor grades. As shown in and Fig. S2, high ISG20 expression (i.e. higher than the median ISG20 level) was associated with shorter patient survival across all subgroups, except for grade II glioma (, Fig. S2).
Table 1. Correlation of ISG20 and common clinicopathological factors with patients’ survival in the CGGA and TCGA datasets. Each variable was correlated with survival time using univariate and multivariate Cox regression analyses. The p-value, hazard ratio (HR) and 95% confidence interval (95% CI) for each analysis are listed.
Figure 3. Kaplan-Meier analyses of overall survival in CGGA cohort according to ISG20 expression level. Samples were divided into high- and low-ISG20 expression groups based on the median expression level of ISG20. (a) Patients with IDH mutant tumors. (b) Patients with IDH wild-type tumors. (c) WHO grade II glioma patients. (d) WHO grade III glioma patients. (e) WHO grade IV glioma patients. Discriminative power of ISG20 was assessed with Kaplan-Meier plotting method and the Log-rank test. NS, no significance.
To examine the consistency of ISG20 protein expression with gene expression findings, we used immunohistochemistry and measured ISG20 expression in tumor specimens from 43 glioma patients. In line with the results from the bioinformatics analyses, protein expression of ISG20 showed the same results, with increased expression in higher tumor grade and decreased expression in IDH mutant tumors. Representative immunohistochemical staining of ISG20 in gliomas is also illustrated (,.
ISG20 is associated with both innate and adaptive immune responses
To better understand the mechanism of ISG20-promoted glioma progression, we determined the genes showing correlated expression with ISG20 among the whole transcriptome. Among the total 21,468 genes analyzed, 570 genes in the CGGA and 1925 genes in TCGA showed significant correlations with ISG20 expression (r > 0.5, Table S3). Subsequent pathway analyses showed that these genes were involved in a wide variety of immune responses, including innate immune response, T cell activation, inflammatory response, antigen processing and presentation, hematopoietic cell lineage, leukocyte migration, cytokine-cytokine receptor interaction, lysosome activation, and type I and II IFN signaling pathway (; Fig. S3A). ISG20 also appears to be involved in essential metabolic pathways, such as the regulation of protein processing and modification, proteasome synthesis, and galactose metabolism (data not shown). Collectively, these results indicated that ISG20 is highly involved with the immune response in the glioma microenvironment.
Figure 4. The top bioinformatics hits of biological pathways derived from ISG20-correlated genes in the CGGA cohort. Column length (upper coordinates): enrichment gene counts; polyline (lower coordinates): -log10 p-value (p < 0.05).
To validate this hypothesis, we further investigated which pathways were associated with ISG20 expression. The Gene Set Enrichment Analysis (GSEA) highlighted that the high expression of ISG20 was significantly enriched in multiple immune processes, especially in innate immunity (Fig S3B; Table S4). The correlationship of ISG20 expression with the above immune processes was further validated in detail using Gene Set Variation Analysis (GSVA; Fig S3C; Table S4).
High ISG20 expression is accompanied by increased macrophage and neutrophil infiltration in the tumor
To further explore the connection of ISG20 and immunity in the local tumor microenvironment, we performed gene set variation analysis (GSVA) and analyzed the enrichment scores of various immune cell-characterized gene sets in ISG20-associated genes. We found that as the ISG20 expression level increases, the numbers of macrophages and neutrophils that infiltrates the tumor also rise, while the numbers of central memory T cells (Tcm), follicular helper T cells (Tfh), effector memory T cells (Tem), and gamma delta T cells (Tgd) decreased (; Fig. S4A). However, NK cells, CD4 + T cells, and CD8 + T cells were not correlated with ISG20 expression. Mutual relationship analysis of ISG20-related immune cells was further conducted to identify their clusters according to the extent of ISG20 expression (, Fig. S4B), demonstrating that macrophages and neutrophils were tightly correlated, both of which were positively correlated with ISG20 expression; while subsets of T cells were correlated with each other, and were negatively correlated with ISG20 levels.
Figure 5. Analysis of tumor immune cell infiltration relative to the ISG20 level in the CGGA dataset. (a) Correlation of 24 immune cell subpopulations with ISG20 expression in CGGA dataset. Each colored square within the figure illustrates the correlation between ISG20 and the transcriptional profile of the corresponding immune cell type. Red color illustrates a very strong positive correlation (r = 1), white no correlation (r = 0), and blue a negative correlation (r = −1). (b) Mutual relationship of ISG20-correlated immune cells in CGGA dataset. Plot size and color depth show the intensity of the relationship: red, positive correlation; blue, negative correlation; larger plot indicates a stronger correlation. *p < 0.05, **p < 0.01, ***p < 0.001. (c) Analysis of intratumoral immune cell infiltrates relative to ISG20 expression. Immune cell infiltrates from 43 glioma patients were analyzed by immunohistochemistry. Macrophages (quantified with marker CD68), microglia (CD45 + CD11b), T cells (CD3), cytotoxic T cells (CD8), Tfh cells (CXCR5), memory T cells (CD45RO) were stained. Expression of marker for macrophages increased with increasing ISG20 expression. In contrast, markers for T cells, Tfh cells, and Tcm cells were decreased in high ISG20 expression tumors. Markers for microglia and cytotoxic T cells did not show significant change. (d) Photographs of immunohistochemical staining of each marker in high- and low-ISG20 expression tumors. For CD68, CD3, CD8, CXCR5 and CD45RO, positive cells are stained brown. For CD45 + CD11b, positive cells are stained orange (after merging FITC and CY3 emission signal). Magnification, x400. IHC, immunohistochemistry; high-ISG20, high expression of ISG20; Low-ISG20, low expression of ISG20, **p < 0.01, ***p < 0.001.
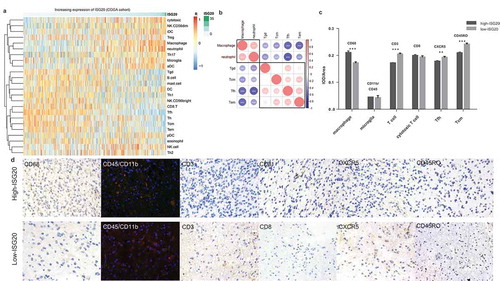
To further confirm these initial findings, we next studied the intratumoral immune cell infiltrates from 43 glioma patients with immunostaining and compared their immune cell profiles relative to ISG20 expression (). In line with the bioinformatic findings, the composition of the immune infiltrates differed between the low ISG20 expression group and the high ISG20 expression group, with a more substantial number of macrophages and lower number of the T cell subsets (T cells, Tfh cells, memory T cells) in high ISG20 expression tumors. Moreover, microglia and cytotoxic T cells were not associated with the ISG20 protein level.
We also investigated the association of ISG20 and chemokine levels in the tumor. As expected, the ISG20 expression level increased in parallel with the levels of many chemokines, including CCL2, CCL5, CCL23, CCL26, CCR1, CCR2, CCR7, CCRL2, CXCL16, CXCR4, and CXCR6 (r > 0.4, p < 0.05; data not shown).
ISG20 expression is correlated with PD-1/PD-L1 and CTLA4 expression in the tumor
Since PD-1/PD-L1 and CTLA-4 are important immune inhibitory molecules, we further determined the association of ISG20 expression with these levels. We found that PD-1, PD-L1, and CTLA-4 expression levels increased in parallel with increasing ISG20 levels (r > 0.45; p < 0.0001) (Fig. S5).
Discussion
Mounting evidence suggests that glioma with an IDH mutation has suppressed immunity.Citation16 Inflammation may promote the proliferation and survival of malignant cells and metastasis, contribute to overturning adaptive immunity, and change tumor responses to chemotherapeutic agents.Citation19 A large proportion of the glioma tumor microenvironment consists of an inflammatory infiltrate predominated by macrophages, which are thought to be subverted by glioblastoma cells for tumor growth.Citation20,Citation21 In gliomas, IDHwt tumors are associated with infiltration of more immune-related components, contributing to poor survival. However, the associated molecular mechanisms remain poorly understood, and thus more extensive research in this area could provide insight toward improved diagnosis and treatment.Citation22–Citation25
Toward this end, we have identified that ISG20 may play a key role in mediating the IDH-related immune response in the glioma microenvironment. The ISG20 gene, located at chromosome 15q26.1, encodes a 20-kDa protein. It was first introduced in 1997 by Celine Gongora and colleagues as an IFN-induced promyelocytic leukemia nuclear body (PML-NB)-associated protein.Citation26 PML-NB is reported to be extensively involved in oncogenesis and gene transcription,Citation27–Citation29 and the function differs according to its binding protein.Citation30–Citation33 The endogenous ISG20 protein is present both in the nucleolus and in the Cajal bodies, and participates in the maturation of small nucleolar RNAs and ribosomal RNAs, and in ribosome biogenesis,Citation34–Citation39 leading to the control of RNA stability.Citation40,Citation41 ISG20 can be induced by type I and type II IFNs,Citation42,Citation43 and its expression has been shown to be elevated during infectionCitation44–Citation46 and in several types of cancers.Citation33,Citation47–Citation51 However, the exact function and mechanism of action of this protein remain elusive.
In this study, we found that ISG20 expression is associated with many chemokines, leading to tumor infiltration of a variety of immune cells. CCL2/CCR2 is known for recruiting monocytes to the sites of inflammation produced by either tissue injury or infection, and augments the accumulation of regulatory Foxp3(+)CD4(+) T cells and of nitric oxide- and YM-1-expressing macrophages and microglia.Citation52 CCL5 induces chemotaxis in T cells and monocytes.Citation53–Citation56 CCL23 might play vital roles in inflammation through the recruitment of macrophages and dendritic cells.Citation57 CCRL2/CXCR2 is the main neutrophil attractor in vitro,Citation58 and is involved in the control of both innate and adaptive immune responses.Citation59 CXCR6, a chemokine receptor for CXCL16 that is expressed on a subset of CD4 + T helper 1 cells and natural killer T cells, is involved in lymphocyte homing and modulates the development and progression of atherosclerosis.Citation60 Collectively, elevated expression of these chemokines may contribute to glioma progression by recruiting macrophages and neutrophils to the local tumor environment. Nevertheless, we did not find a significant association of microglia with ISG20 expression, suggesting that the ISG20-associated macrophages were monocyte-derived instead of residual microglial cells.Citation61
Moreover, we found that the majority of adaptive immune cells subtypes, such as Tgd, Tcm, Tfh, and Tem were less abundant, with increased expression of ISG20, which suggested that high ISG20 expression is associated with inefficient antitumor immunity. However, we did not find any correlation between ISG20 and natural killer cells, CD4 + T cells, and CD8 + T cells. We also detected a positive correlation of ISG20 levels with PD-1/PD-L1 and CTLA4 expression, further inhibiting T cell function and leading to tumor evasion of immune responses.Citation62
The association of ISG20 expression with patient survival did not reach statistical significance for WHO grade II tumors and in the IDHmut tumors in TCGA cohort, although we found the same trend as the other groups. This may be due to the relatively longer survival of these patients. Further studies with more extended follow-up are needed to determine the prognostic value of ISG20 in these subgroups of patients.
In conclusion, our observations suggest that ISG20 strongly correlates with the tumor-induced immune response and infiltration of monocyte-derived macrophages and neutrophils, which increases immunity in the tumor environment. Accordingly, ISG20 may serve as a useful prognostic marker for glioma and as a potential therapeutic target. Further studies are warranted to confirm these results and unveil the underlying mechanism.
Methods
Patients and databases
The CGGA (http://www.cgga.org.cn) and TCGA (http://cancergenome.nih.gov) datasets were downloaded online. The transcriptome expression data of 932 gliomas were collected, ranging from WHO grade II to grade IV. In the CGGA dataset, there were 325 samples, including 144 GBM and 181 LGG samples.Citation63 In the TCGA dataset, 150 GBM and 457 LGG samples were available. Information on age, gender, diagnosis, WHO grade, chemo-and radiation therapy regimen, molecular data, and patient prognoses was also collected. Tumor tissues were also collected from 43 glioma patients who underwent surgery at the First Hospital of China Medical University between 2017 and 2018, including 19 WHO grade II patients, 12 grade III patients, and 12 GBM patients (Table S5). This study was approved by the ethics committee of the First Hospital of China Medical University, the institutional review boards of Capital Medical University, and the Beijing Institute for Brain Disorders Brain Tumor Center. Written informed consent was obtained from all patients.
IDH1 mutation and 1p/19q co-deletion status
The IDH mutation status of samples from the CGGA dataset was determined by aligning to the human reference genome (Hg19 Refseq) using IGV (version 2.3.93), which was previously shown to have good correlation with pyrosequencing results.Citation64,Citation65 The IDH status was available directly from the TCGA dataset. The 1p/19q co-deletion status was downloaded from the two datasets respectively. Detection of IDH1 and IDH2 status of 43 glioma patients in China Medical University was performed in the pathology department of the hospital by immunohistochemistry (antihuman IDH1R132H H09) and sequencing respectively.
Immunohistochemistry and immunofluorescence
Immunohistochemistry was performed using formalin-fixed, paraffin-embedded tissues. Four μm-thick sections were cut and dewaxed in xylene, rinsed in graded ethanol, and rehydrated in distilled water. After antigen retrieval with sodium citrate buffer (10 mM sodium citrate, pH 6.0), endogenous peroxidase activity was blocked with 3% H2O2. Then the sections were added with the appropriate antibody at appropriate dilution, then DAB staining solution was added. The sections were counter-stained with hematoxylin, dehydrated, and sealed. For immunofluorescence, antigen was retrieved with EDTA buffer (1 mM Tris/EDTA, pH 9.0) and endogenous fluorescence was eliminated with AutoFluo Quencher (Servicebio, Cat# G1221). The details of the antibodies used for immunofluorescence and immunohistochemistry are given in Table S6. Staining for each marker was scored using Image-pro plus (v.6.0). Integrated optical density (IOD) to area ratio was calculated for each marker to assess the staining intensity.
Statistical analysis
Immune-related genes were collected from the canonical biological pathways in the Molecular Signatures Database v. 4.0 (MSigDB, http://www.broad.mit.edu/gsea/msigdb/),Citation66,Citation67 combined with genes identified in three publications from the Journal of Allergy and Clinical Immunology,Citation68–Citation70 and genes selected among those involved in canonical immune processes indicated in Janeway’s Immunobiology (9th edition). A total of 829 immune genes were confirmed by removing overlapping genes.
R language (v. 3.4.3), SPSS software (v. 22.0), and GraphPad Prism (v. 7.0) for Windows were used for statistical analyses and generating figures. GBM and LGG samples from the CGGA and TCGA datasets were analyzed respectively. Genes with significantly different expression between groups with distinct IDH status were estimated by a two-tailed Student’s t-test. The Significance Analysis of Microarrays (SAM) package of R was performed to control the FDR. Values of p < 0.05 and FDR < 0.01 were considered statistically significant. Genes that showed consistent differential expression in both the GBM and LGG cohorts from the two datasets were extracted. We then calculated the prognostic value of these differentially expressed genes using the survival package of R. A multivariate Cox proportional hazard model was performed for evaluating the independent prognostic variables. Kaplan-Meier curves were employed to depict survival distributions. Genes and immune cells correlated with ISG20 expression were explored by Pearson’s correlation coefficient (r) using R considering the effect of variant grades or IDH status. An absolute r-value of greater than 0.4 was considered to indicate a forcefully significant correlation with ISG20.
Bioinformatic analyses
Gene annotation and pathway analyses were performed by Database for Annotation, Visualization and Integrated Discovery (DAVID v6.8 http://david.abcc.n-cifcrf.gov/), STRING (version 10.5 https://string-db.org/), and Kyoto Encyclopedia of Genes and Genomes (KEGG http://www.kegg.jp/kegg/pathway.html). Gene Set Enrichment Analysis (GSEA) was used to explore biological functions associated with ISG20. Gene Set Variation Analysis (GSVA package of R http://www.bioconductor.org/) was implemented to validate the relationship of ISG20 and the candidate functions. To further define the immune cell subpopulations affected by ISG20 expression, we used the GSVA to explore the relationship between ISG20 and the predefined, highly distinctive transcriptional profile of each immune cell type.Citation71–Citation74 Twenty-four types of immune cells with corresponding gene signatures were analyzed (Table S7). A threshold of an absolute correlation coefficient (r) greater than 0.3 with a p-value < 0.05 was used for selecting immune cells significantly correlated with ISG20.
Disclosure of interest
The authors report no conflict of interest.
Supplemental Material
Download Zip (3.5 MB)Supplementary data
Supplemental data for this article can be accessed here
Additional information
Funding
References
- Weller M, Wick W, Aldape K, Brada M, Berger M, Pfister SM, Nishikawa R, Rosenthal M, Wen PY, Stupp R, et al. Glioma. Nat Rev Dis Primers. 2015;1:15017. doi:10.1038/nrdp.2015.17.
- Chaichana KL, McGirt MJ, Laterra J, Olivi A, Quinones-Hinojosa A. Recurrence and malignant degeneration after resection of adult hemispheric low-grade gliomas. J Neurosurg. 2010;112:10–17. doi:10.3171/2008.10.JNS08608.
- Jiang T, Mao Y, Ma W, Mao Q, You Y, Yang X, Jiang C, Kang C, Li X, Chen L, et al. CGCG clinical practice guidelines for the management of adult diffuse gliomas. Cancer Lett. 2016;375:263–273. doi:10.1016/j.canlet.2016.01.024.
- Watanabe T, Nobusawa S, Kleihues P, Ohgaki H. IDH1 mutations are early events in the development of astrocytomas and oligodendrogliomas. Am J Pathol. 2009;174:1149–1153. doi:10.2353/ajpath.2009.080958.
- Olar A, Aldape KD. Using the molecular classification of glioblastoma to inform personalized treatment. J Pathol. 2014;232:165–177. doi:10.1002/path.4282.
- Kelly AD, Kroeger H, Yamazaki J, Taby R, Neumann F, Yu S, Lee JT, Patel B, Li Y, He R, et al. A CpG island methylator phenotype in acute myeloid leukemia independent of IDH mutations and associated with a favorable outcome. Leukemia. 2017;31:2011–2019. doi:10.1038/leu.2017.12.
- Shiovitz S, Bertagnolli MM, Renfro LA, Nam E, Foster NR, Dzieciatkowski S, Luo Y, Lao VV, Monnat RJ, Emond MJ, et al. CpG island methylator phenotype is associated with response to adjuvant irinotecan-based therapy for stage III colon cancer. Gastroenterology. 2014;147:637–645. doi:10.1053/j.gastro.2014.05.009.
- Turcan S, Rohle D, Goenka A, Walsh LA, Fang F, Yilmaz E, Campos C, Fabius AWM, Lu C, Ward PS, et al. IDH1 mutation is sufficient to establish the glioma hypermethylator phenotype. Nature. 2012;483:479–483. doi:10.1038/nature10866.
- Nazemalhosseini Mojarad E, Kuppen PJ, Aghdaei HA, Zali MR. The CpG island methylator phenotype (CIMP) in colorectal cancer. Gastroenterol Hepatol Bed Bench. 2013;6:120–128.
- Wang Y, Long Y, Xu Y, Guan Z, Lian P, Peng J, Cai S, Cai G. Prognostic and predictive value of CpG island methylator phenotype in patients with locally advanced nonmetastatic sporadic colorectal cancer. Gastroenterol Res Pract. 2014;2014:436985.
- Ohka F, Natsume A, Motomura K, Kishida Y, Kondo Y, Abe T, Nakasu Y, Namba H, Wakai K, Fukui T, et al. The global DNA methylation surrogate LINE-1 methylation is correlated with MGMT promoter methylation and is a better prognostic factor for glioma. PLoS One. 2011;6:e23332. doi:10.1371/journal.pone.0023332.
- Fang F, Turcan S, Rimner A, Kaufman A, Giri D, Morris LG, Shen R, Seshan V, Mo Q, Heguy A, et al. Breast cancer methylomes establish an epigenomic foundation for metastasis. Sci Transl Med. 2011;3:75ra25. doi:10.1126/scitranslmed.3001875.
- Branham MT, Marzese DM, Laurito SR, Gago FE, Orozco JI, Tello OM, Vargas-Roig LM, Roqué M. Methylation profile of triple-negative breast carcinomas. Oncogene. 2012;1:e17. doi:10.1038/oncsis.2012.17.
- Amankulor NM, Kim Y, Arora S, Kargl J, Szulzewsky F, Hanke M, Margineantu DH, Rao A, Bolouri H, Delrow J, et al. Mutant IDH1 regulates the tumor-associated immune system in gliomas. Genes Dev. 2017;31:774–786. doi:10.1101/gad.294991.116.
- Zhang X, Rao A, Sette P, Deibert C, Pomerantz A, Kim WJ, Kohanbash G, Chang Y, Park Y, Engh J, et al. IDH mutant gliomas escape natural killer cell immune surveillance by downregulation of NKG2D ligand expression. Neuro Oncol. 2016;18:1402–1412. doi:10.1093/neuonc/now061.
- Kohanbash G, Carrera DA, Shrivastav S, Ahn BJ, Jahan N, Mazor T, Chheda ZS, Downey KM, Watchmaker PB, Beppler C, et al. Isocitrate dehydrogenase mutations suppress STAT1 and CD8+ T cell accumulation in gliomas. J Clin Invest. 2017;127:1425–1437. doi:10.1172/JCI90644.
- Berghoff AS, Kiesel B, Widhalm G, Wilhelm D, Rajky O, Kurscheid S, Kresl P, Wöhrer A, Marosi C, Hegi ME, et al. Correlation of immune phenotype with IDH mutation in diffuse glioma. Neuro Oncol. 2017;19:1460–1468. doi:10.1093/neuonc/nox054.
- Parsons DW, Jones S, Zhang X, Lin JC, Leary RJ, Angenendt P, Mankoo P, Carter H, Siu I-M, Gallia GL, et al. An integrated genomic analysis of human glioblastoma multiforme. Science. 2008;321:1807–1812. doi:10.1126/science.1164382.
- Mantovani A, Allavena P, Sica A, Balkwill F. Cancer-related inflammation. Nature. 2008;454:436–444. doi:10.1038/nature07205.
- Poon CC, Sarkar S, Yong VW, Kelly JJP. Glioblastoma-associated microglia and macrophages: targets for therapies to improve prognosis. Brain. 2017;140:1548–1560. doi:10.1093/brain/aww355.
- Morantz RA, Wood GW, Foster M, Clark M, Gollahon K. Macrophages in experimental and human brain tumors. Part 2: studies of the macrophage content of human brain tumors. J Neurosurg. 1979;50:305–311. doi:10.3171/jns.1979.50.3.0305.
- Roth W, Wagenknecht B, Dichgans J, Weller M. Interferon-alpha enhances CD95L-induced apoptosis of human malignant glioma cells. J Neuroimmunol. 1998;87:121–129.
- Rohn TA, Wagenknecht B, Roth W, Naumann U, Gulbins E, Krammer PH, Walczak H, Weller M. CCNU-dependent potentiation of TRAIL/Apo2L-induced apoptosis in human glioma cells is p53-independent but may involve enhanced cytochrome c release. Oncogene. 2001;20:4128–4137. doi:10.1038/sj.onc.1204534.
- Yang J, Liu R, Deng Y, Qian J, Lu Z, Wang Y, Zhang D, Luo F, Chu Y. MiR-15a/16 deficiency enhances anti-tumor immunity of glioma-infiltrating CD8+ T cells through targeting mTOR. Int J Cancer. 2017;141:2082–2092. doi:10.1002/ijc.30912.
- Brown MC, Holl EK, Boczkowski D, Dobrikova E, Mosaheb M, Chandramohan V, Bigner DD, Gromeier M, Nair SK. Cancer immunotherapy with recombinant poliovirus induces IFN-dominant activation of dendritic cells and tumor antigen-specific CTLs. Sci Transl Med. 2017;9:eaan4220. doi:10.1126/scitranslmed.aan4220.
- Gongora C, David G, Pintard L, Tissot C, Hua TD, Dejean A, Mechti N. Molecular cloning of a new interferon-induced PML nuclear body-associated protein. J Biol Chem. 1997;272:19457–19463.
- Boisvert FM, Hendzel MJ, Bazett-Jones DP. Promyelocytic leukemia (PML) nuclear bodies are protein structures that do not accumulate RNA. J Cell Biol. 2000;148:283–292.
- Ching RW, Dellaire G, Eskiw CH, Bazett-Jones DP. PML bodies: a meeting place for genomic loci? J Cell Sci. 2005;118:847–854. doi:10.1242/jcs.01700.
- Zhong S, Salomoni P, Pandolfi PP. The transcriptional role of PML and the nuclear body. Nat Cell Biol. 2000;2:E85–E90. doi:10.1038/35010583.
- Block GJ, Eskiw CH, Dellaire G, Bazett-Jones DP. Transcriptional regulation is affected by subnuclear targeting of reporter plasmids to PML nuclear bodies. Mol Cell Biol. 2006;26:8814–8825. doi:10.1128/MCB.00636-06.
- Shen TH, Lin HK, Scaglioni PP, Yung TM, Pandolfi PP. The mechanisms of PML-nuclear body formation. Mol Cell. 2006;24:331–339. doi:10.1016/j.molcel.2006.09.013.
- Ullman AJ, Hearing P. Cellular proteins PML and Daxx mediate an innate antiviral defense antagonized by the adenovirus E4 ORF3 protein. J Virol. 2008;82:7325–7335. doi:10.1128/JVI.00723-08.
- Zhong S, Muller S, Ronchetti S, Freemont PS, Dejean A, Pandolfi PP. Role of SUMO-1-modified PML in nuclear body formation. Blood. 2000;95:2748–2752.
- Espert L, Eldin P, Gongora C, Bayard B, Harper F, Chelbi-Alix MK, Bertrand E, Degols G, Mechti N. The exonuclease ISG20 mainly localizes in the nucleolus and the Cajal (Coiled) bodies and is associated with nuclear SMN protein-containing complexes. J Cell Biochem. 2006;98:1320–1333. doi:10.1002/jcb.20869.
- van Hoof A, Lennertz P, Parker R. Three conserved members of the RNase D family have unique and overlapping functions in the processing of 5S, 5.8S, U4, U5, RNase MRP and RNase P RNAs in yeast. Embo J. 2000;19:1357–1365. doi:10.1093/emboj/19.6.1357.
- Degols G, Eldin P, Mechti N. ISG20, an actor of the innate immune response. Biochimie. 2007;89:831–835. doi:10.1016/j.biochi.2007.03.006.
- Herrera-Esparza R, Kruse L, von Essen M, Campos L, Barbosa O, Bollain JJ, Badillo I, Avalos-Díaz E. U3 snoRNP associates with fibrillarin a component of the scleroderma clumpy nucleolar domain. Arch Dermatol Res. 2002;294:310–317. doi:10.1007/s00403-002-0338-7.
- Verheggen C, Lafontaine DL, Samarsky D, Mouaikel J, Blanchard JM, Bordonne R, Bertrand E. Mammalian and yeast U3 snoRNPs are matured in specific and related nuclear compartments. Embo J. 2002;21:2736–2745. doi:10.1093/emboj/21.11.2736.
- Carmo-Fonseca M. New clues to the function of the Cajal body. EMBO Rep. 2002;3:726–727. doi:10.1093/embo-reports/kvf154.
- Dani C, Mechti N, Piechaczyk M, Lebleu B, Jeanteur P, Blanchard JM. Increased rate of degradation of c-myc mRNA in interferon-treated Daudi cells. Proc Natl Acad Sci USA. 1985;82:4896–4899.
- Li XL, Blackford JA, Judge CS, Liu M, Xiao W, Kalvakolanu DV, Hassel BA. RNase-L-dependent destabilization of interferon-induced mRNAs. A role for the 2-5A system in attenuation of the interferon response. J Biol Chem. 2000;275:8880–8888.
- Gongora C, Degols G, Espert L, Hua TD, Mechti N. A unique ISRE, in the TATA-less human Isg20 promoter, confers IRF-1-mediated responsiveness to both interferon type I and type II. Nucleic Acids Res. 2000;28:2333–2341.
- Li W, Hofer MJ, Songkhunawej P, Jung SR, Hancock D, Denyer G, Campbell IL. Type I interferon-regulated gene expression and signaling in murine mixed glial cells lacking signal transducers and activators of transcription 1 or 2 or interferon regulatory factor 9. J Biol Chem. 2017;292:5845–5859. doi:10.1074/jbc.M116.756510.
- Golz L, Buerfent BC, Hofmann A, Hubner MP, Ruhl H, Fricker N, Schmidt D, Johannes O, Jepsen S, Deschner J, et al. Genome-wide transcriptome induced by Porphyromonas gingivalis LPS supports the notion of host-derived periodontal destruction and its association with systemic diseases. Innate Immun. 2016;22:72–84. doi:10.1177/1753425915616685.
- Jia YT, Wei L, Jiang D, Cong X, Fei R. [Investigating the inhibitory effects of interferon-alpha on the replication of hepatitis C virus replicon]. Zhonghua Yi Xue Za Zhi. 2005;85:2065–2069.
- Chelbi-Alix MK, de The H. Herpes virus induced proteasome-dependent degradation of the nuclear bodies-associated PML and Sp100 proteins. Oncogene. 1999;18:935–941. doi:10.1038/sj.onc.1202366.
- Rajkumar T, Sabitha K, Vijayalakshmi N, Shirley S, Bose MV, Gopal G, Selvaluxmy G. Identification and validation of genes involved in cervical tumourigenesis. BMC Cancer. 2011;11:80. doi:10.1186/1471-2407-11-80.
- Kim H, Gillis LC, Jarvis JD, Yang S, Huang K, Der S, Barber DL. Tyrosine kinase chromosomal translocations mediate distinct and overlapping gene regulation events. BMC Cancer. 2011;11:528. doi:10.1186/1471-2407-11-528.
- Einhorn S, Wasserman J, Lundell G, Blomgren H, Cedermark B, Jarstrand C, Petrini B, Strander H, Theve T, Ohman U. Treatment of patients with disseminated colorectal cancer with recombinant human alpha 2-interferon. Studies on the immune system. Int J Cancer. 1984;33:251–256.
- Spina CA, Fahey JL, Durkos-Smith D, Dorey F, Sarna G. Suppression of natural killer cell cytotoxicity in the peripheral blood of patients receiving interferon therapy. J Biol Response Mod. 1983;2:458–469.
- Ferrantini M, Capone I, Belardelli F. Interferon-alpha and cancer: mechanisms of action and new perspectives of clinical use. Biochimie. 2007;89:884–893. doi:10.1016/j.biochi.2007.04.006.
- Trujillo JA, Fleming EL, Perlman S. Transgenic CCL2 expression in the central nervous system results in a dysregulated immune response and enhanced lethality after coronavirus infection. J Virol. 2013;87:2376–2389. doi:10.1128/JVI.03089-12.
- Schall TJ, Bacon K, Toy KJ, Goeddel DV. Selective attraction of monocytes and T lymphocytes of the memory phenotype by cytokine RANTES. Nature. 1990;347:669–671. doi:10.1038/347669a0.
- de la Rosa G, Longo N, Rodriguez-Fernandez JL, Puig-Kroger A, Pineda A, Corbi AL, Sánchez-Mateos P. Migration of human blood dendritic cells across endothelial cell monolayers: adhesion molecules and chemokines involved in subset-specific transmigration. J Leukoc Biol. 2003;73:639–649.
- Taub DD, Sayers TJ, Carter CR, Ortaldo JR. Alpha and beta chemokines induce NK cell migration and enhance NK-mediated cytolysis. J Immunol. 1995;155:3877–3888.
- Kameyoshi Y, Dorschner A, Mallet AI, Christophers E, Schroder JM. Cytokine RANTES released by thrombin-stimulated platelets is a potent attractant for human eosinophils. J Exp Med. 1992;176:587–592.
- Poposki JA, Keswani A, Kim JK, Klingler AI, Suh LA, Norton J, Carter RG, Peters AT, Hulse KE, Grammer LC, et al. Tissue proteases convert CCL23 into potent monocyte chemoattractants in patients with chronic rhinosinusitis. J Allergy Clin Immunol. 2016;137:1274–7e9. doi:10.1016/j.jaci.2015.09.029.
- Del Prete A, Martinez-Munoz L, Mazzon C, Toffali L, Sozio F, Za L, Bosisio D, Gazzurelli L, Salvi V, Tiberio L, et al. The atypical receptor CCRL2 is required for CXCR2-dependent neutrophil recruitment and tissue damage. Blood. 2017;130:1223–1234. doi:10.1182/blood-2017-04-777680.
- Del Prete A, Bonecchi R, Vecchi A, Mantovani A, Sozzani S. CCRL2, a fringe member of the atypical chemoattractant receptor family. Eur J Immunol. 2013;43:1418–1422. doi:10.1002/eji.201243179.
- Galkina E, Harry BL, Ludwig A, Liehn EA, Sanders JM, Bruce A, Weber C, Ley K. CXCR6 promotes atherosclerosis by supporting T-cell homing, interferon-gamma production, and macrophage accumulation in the aortic wall. Circulation. 2007;116:1801–1811. doi:10.1161/CIRCULATIONAHA.106.678474.
- Butovsky O, Jedrychowski MP, Moore CS, Cialic R, Lanser AJ, Gabriely G, Koeglsperger T, Dake B, Wu PM, Doykan CE, et al. Identification of a unique TGF-beta-dependent molecular and functional signature in microglia. Nat Neurosci. 2014;17:131–143. doi:10.1038/nn.3599.
- Keir ME, Butte MJ, Freeman GJ, Sharpe AH. PD-1 and its ligands in tolerance and immunity. Annu Rev Immunol. 2008;26:677–704. doi:10.1146/annurev.immunol.26.021607.090331.
- Zhao Z, Meng F, Wang W, Wang Z, Zhang C, Jiang T. Comprehensive RNA-seq transcriptomic profiling in the malignant progression of gliomas. Sci Data. 2017;4:170024. doi:10.1038/sdata.2017.24.
- Robinson JT, Thorvaldsdottir H, Winckler W, Guttman M, Lander ES, Getz G, Mesirov JP. Integrative genomics viewer. Nat Biotechnol. 2011;29:24–26. doi:10.1038/nbt.1754.
- Thorvaldsdottir H, Robinson JT, Mesirov JP. Integrative Genomics Viewer (IGV): high-performance genomics data visualization and exploration. Brief Bioinform. 2013;14:178–192. doi:10.1093/bib/bbs017.
- Subramanian A, Tamayo P, Mootha VK, Mukherjee S, Ebert BL, Gillette MA, Paulovich A, Pomeroy SL, Golub TR, Lander ES, et al. Gene set enrichment analysis: a knowledge-based approach for interpreting genome-wide expression profiles. Proc Natl Acad Sci USA. 2005;102:15545–15550. doi:10.1073/pnas.0506580102.
- Mootha VK, Lindgren CM, Eriksson KF, Subramanian A, Sihag S, Lehar J, Puigserver P, Carlsson E, Ridderstråle M, Laurila E, et al. PGC-1alpha-responsive genes involved in oxidative phosphorylation are coordinately downregulated in human diabetes. Nat Genet. 2003;34:267–273. doi:10.1038/ng1180.
- Chaplin DD. 1. Overview of the immune response. J Allergy Clin Immunol. 2003;111:S442–S459.
- Borish LC, Steinke JW. 2. Cytokines and chemokines. J Allergy Clin Immunol. 2003;111:S460–S475.
- Steinke JW, Borish L. 3. Cytokines and chemokines. J Allergy Clin Immunol. 2006;117:S441–S445. doi:10.1016/j.jaci.2005.07.001.
- Bindea G, Mlecnik B, Tosolini M, Kirilovsky A, Waldner M, Obenauf AC, Angell H, Fredriksen T, Lafontaine L, Berger A, et al. Spatiotemporal dynamics of intratumoral immune cells reveal the immune landscape in human cancer. Immunity. 2013;39:782–795. doi:10.1016/j.immuni.2013.10.003.
- Chtanova T, Newton R, Liu SM, Weininger L, Young TR, Silva DG, Bertoni F, Rinaldi A, Chappaz S, Sallusto F, et al. Identification of T cell-restricted genes, and signatures for different T cell responses, using a comprehensive collection of microarray datasets. J Immunol. 2005;175:7837–7847.
- Hyrcza MD, Kovacs C, Loutfy M, Halpenny R, Heisler L, Yang S, Wilkins O, Ostrowski M, Der SD. Distinct transcriptional profiles in ex vivo CD4+ and CD8+ T cells are established early in human immunodeficiency virus type 1 infection and are characterized by a chronic interferon response as well as extensive transcriptional changes in CD8+ T cells. J Virol. 2007;81:3477–3486. doi:10.1128/JVI.01552-06.
- Wendt K, Wilk E, Buyny S, Buer J, Schmidt RE, Jacobs R. Gene and protein characteristics reflect functional diversity of CD56dim and CD56bright NK cells. J Leukoc Biol. 2006;80:1529–1541. doi:10.1189/jlb.0306191.