
 ?Mathematical formulae have been encoded as MathML and are displayed in this HTML version using MathJax in order to improve their display. Uncheck the box to turn MathJax off. This feature requires Javascript. Click on a formula to zoom.
ABSTRACT
B lymphocytes are important players in immune responses to cancer. However, their composition and function in head and neck squamous cell carcinoma (HNSCC) has not been well described. Here, we analyzed B cell subsets in HNSCC (n = 38), non-cancerous mucosa (n = 14) and peripheral blood from HNSCC patients (n = 38) and healthy controls (n = 20) by flow cytometry. Intratumoral B cells contained high percentages of activated (CD86+), antigen-presenting (CD86+/CD21−) and memory B cells (IgD−/CD27+). T follicular helper cells (CD4+/CXCR5+/CD45RA−/CCR7−) as key components of tertiary lymphoid structures and plasma cells made up high percentages of the lymphocyte infiltrate. Percentages of regulatory B cell varied depending on the regulatory phenotype. Analysis of humoral immune responses against 23 tumor-associated antigens (TAA) showed reactivity against at least one antigen in 56% of HNSCC patients. Reactivity was less frequent in human papillomavirus associated (HPV+) patients and healthy controls compared to HPV negative (HPV−) HNSCC. Likewise, patients with early stage HNSCC or MHC-I loss on tumor cells had low TAA responses. Patients with TAA responses showed CD4+ dominated T cell infiltration compared to mainly CD8+ T cells in tumors without detected TAA response. To summarize, our data demonstrates different immune infiltration patterns in relation to serological TAA response detection and the presence of B cell subpopulations in HNSCC that can engage in tumor promoting and antitumor activity. In view of increasing use of immunotherapeutic approaches, it will be important to include B cells into comprehensive phenotypic and functional analyses of tumor-associated lymphocytes.
Introduction
The immune system plays an important role in anticancer activity on one side and cancer development and progression on the other side. The contribution of different immune cell subsets, especially T cells, is increasingly well established and understood. For example, regulatory T cells have been described in various cancer entities including head and neck squamous cell carcinoma (HNSCC) as major contributors to immune evasion.Citation1,Citation2 In contrast, CD8+ T cells are a main anticancer effector cell subset in HNSCC. Their function is often hampered by overexpression of immune checkpoint molecules such as programmed cell death protein 1 (PD-1), programmed cell death 1 ligand 1 (PD-L1) or cytotoxic T-lymphocyte-associated protein 4 (CTLA-4).Citation3 These molecules have become targets of immunotherapeutic approaches that are changing the landscape of cancer therapy. Recently, PD-1 inhibitors have shown substantial activity in recurrent/metastatic HNSCC.Citation4
In contrast to T cells, tumor-associated B cells have not been included in the majority of studies analyzing tumor infiltrating lymphocytes in HNSCC. The presence of CD20+ B cells in the tumor microenvironment (TME) has been linked mainly to good prognosis in different entities such as non-small cell lung cancer, gastric cancer, melanoma or colorectal cancer.Citation5–Citation8 However, ambiguous or no impact of tumor-infiltrating CD20+ B cells on outcome was described for example in HNSCC or ovarian cancer, respectively.Citation9,Citation10 These differences might be explained by a high degree of functional plasticity and heterogeneity of B cell subsets and hence, a variable composition and also localization of tumor-infiltrating B cells. On the one hand, regulatory B cells have been demonstrated in murine models and different human cancer entities as a cell population with immunosuppressive traits, therefore facilitating a tumor promoting microenvironment.Citation11 Moreover, Affara et al. provided evidence for a protumorigenic function of immunoglobulin-containing immune complexes in a murine squamous cell carcinoma model.Citation12 On the other hand, B cells are the source of antibodies directed against the tumor, which contribute to tumor recognition and antibody-dependent cytotoxicity. Additionally, B cells serve as antigen-presenting cells and have the capacity to activate T cells.Citation13 Tertiary lymphoid structures (TLS) in the TME have been linked to this orchestrated B-T cell interaction and their presence to improved patient survival in multiple cancer entities including oral squamous cell carcinoma (OSCC).Citation14,Citation15 By secretion of various cytokines, B cells can also shape the immune response in the TME in a pro- or antitumor direction.
Although carcinogenesis of HNSCC is mostly attributed to smoking and alcohol abuse, there is an increasing proportion of HNSCC that is caused by high risk human papillomaviruses (HPV). HPV-driven HNSCC show a more favorable clinical outcome and better response to chemoradiation compared to alcohol and smoking induced HNSCC.Citation16 This difference may be explained by distinct immunological features. For example, different antitumor immune cell subsets are increased in the TME of HPV+ compared to HPV− HNSCC.Citation17 Furthermore, their potential to induce immune responses is reflected by the finding that serological analysis can detect antibodies against viral antigens such as E6 or E7 in almost all patients with HPV+ HNSCC.Citation18 In contrast, humoral immune responses in HPV− HNSCC seem to be more heterogeneous. Although it is known that HPV− HNSCC can express different tumor-associated antigens (TAA) such as cancer/testis antigens (CTA),Citation19,Citation20 antibody responses against large numbers of (TAA) in a single cohort of HNSCC triggered by smoking and alcohol have not yet been studied.
This study therefore aimed at providing a detailed characterization of different B cellular components of the TME and comprehensively investigating the humoral immune response against various TAAs in patients with HPV+ and HPV− HNSCC.
Results
CD45+ lymphocytes and CD19+/CD20+ B cells are increased in HPV+ HNSCC
Single cell suspensions from fresh HNSCC tumor tissue (n = 38), non-cancerous mucosa (n = 14), peripheral blood mononuclear cells from healthy controls (PBMC HC; n = 20) and HNSCC patients (PBMC HNSCC; n = 38) were analyzed by flow cytometry for the composition of the B and T cell infiltrate. All patients were diagnosed with HNSCC and samples were taken before initiation of anticancer treatment. summarizes clinical characteristics of patients. The gating strategy for B cell subsets is outlined in an exemplary tumor containing high percentages of CD19+/CD20+ cells (). After gating on living cells (live/dead cell stain), selecting lymphocytes according to their morphology (size and granularity) and excluding doublets, CD45+ lymphocytes were used for further analysis. Plasmablasts (CD27+/CD38hi/CD20−) and plasmacells (CD27+/CD38hi/CD138hi/CD20−) were defined as subpopulations of CD19+/CD45+ cells as previously described.Citation21 Subsets known as regulatory B cell phenotypes (CD24hi/CD38hi; CD25hi) were also quantified in the CD19+/CD45+ compartment as demonstrated earlier.Citation22,Citation23 Naïve (IgD+/CD27−) and memory (IgD−/CD27+) B cells, antigen-presenting (CD86+/CD21−) and activated (CD86+) B cells were evaluated in CD19+/CD20+/CD45+ B cells. Gating of these populations was adopted from previous publications investigating the respective subsets.Citation13,Citation24
Table 1. Patient characteristics.
Figure 1. Flow cytometry gating strategy and lymphocyte proportions in different compartments of HPV± HNSCC patients and healthy controls.
Single cell suspensions from HNSCC tumor tissue (n = 38), non-cancerous mucosa (n = 14), PBMCs from HNSCC patients (PBMC HNSCC, n = 38) and healthy controls (PBMC HC, n = 20) were analyzed by flow cytometry. (A) The gating strategy for the analysis of B cell subsets is delineated by exemplary histogram and dot plots. All plots contain flow cytometry data of a single cell suspension from a HNSCC tumor with high B cell content. Initial gating included dead cell stain (aqua), selection according to cell morphology (forward/side scatter), exclusion of doublets and CD45− cells. Plasmablasts (CD27+/CD38hi/CD20−) and plasmacells (CD27+/CD38hi/CD138hi/CD20−; top row on right side) as well as regulatory B cell phenotypes (CD24hi/CD38hi; CD25hi; middle row on right side) were gated as subpopulations of CD19+/CD45+ cells. Naïve (IgD+/CD27−) and memory (IgD−/CD27+) B cells, antigen-presenting (CD86+/CD21−) and activated (CD86+) B cells were evaluated in CD19+/CD20+/CD45+ cells (bottom row on right side). (B) CD19+/CD20+ cells in percent of CD45+ cells in PBMC HC, PBMC HNSCC, tumor and non-cancerous mucosa are depicted in scatter plots. (C) CD45+ lymphocytes in percent of all living cells are compared in HPV−/+ HNSCC and mucosa. (D) CD19+/CD20+ cell percentages within the live cell fraction of HPV−/+ HNSCC tumors and mucosa are shown in scatter plots. (E) Scatter plots show percentages of CD19+/CD20+ B cells in the live cell fraction of tumors in relation to UICC stage. For statistical analysis, Kruskal-Wallis test was used in (B) – (D) and Mann-Whitney test in (E). Data is presented as mean. *P < 0.05; ns, not significant.
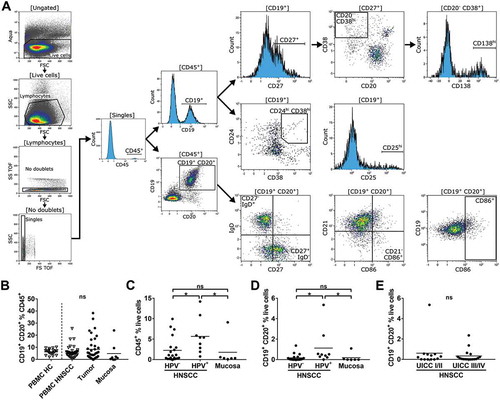
There was no significant difference in percentages of B cells in the CD45+ compartment of PBMC HC, PBMC HNSCC, HNSCC tumor tissue and mucosa samples (). HPV+ HNSCC demonstrated increased percentages of tumor-infiltrating CD45+ lymphocytes (5.68 ± 4.32%) compared to HPV− tumors (2.26 ± 2.99%; p = 0.044) and non-cancerous mucosa (1.80 ± 3.59%; p = 0.039; ). Likewise, percentages of B cells (CD19+/CD20+) were significantly higher in HPV+ HNSCC (1.13 ± 1.72%) compared to HPV− HNSCC (0.17 ± 0.33%; p = 0.024) or mucosa (0.19 ± 0.44%; p = 0.017; ). Similar results for CD45+ and CD19+/CD20+ cells were obtained comparing tumors derived from the oropharynx only (data not shown). The proportion of B cells among live cells in the TME of early stage (UICC I/II) vs. advanced stage (UICC III/IV) was similar (0.61 ± 1.44% vs. 0.34 ± 0.63%; ).
Activated, antigen-presenting and memory B cells are enriched in the TME of HNSCC
Whereas we could not determine significant differences in the overall B cell population between the different compartments, we could identify specific changes regarding the distribution of B cell subpopulations in the TME of HNSCC compared to other compartments.
Activated B cells, identified by surface expression of CD86, were increased in the TME of HNSCC compared to mucosa, PBMC HNSCC and PBMC HC (23.43 ± 12.27% vs. 12.07 ± 10.70%; p = 0.027, 8.59 ± 6.67%; p < 0.0001 and 8.00 ± 4.69%; p < 0.0001, respectively; , left plot). The median fluorescence intensity (MFI) of CD86 on B cells was similar in PBMC HC and PBMC HNSCC (1.25 ± 0.59 and 1.56 ± 0.68, respectively), but significantly increased on tumor-infiltrating B cells compared to PBMC HNSCC (3.90 ± 6.87, p = 0.031). CD86 MFI of B cells in mucosa did not differ significantly compared to B cells in the tumor microenvironment (, right plot). We recently described a subpopulation of B cells (CD86+/CD21−), which are increased under certain inflammatory conditions and act as antigen-presenting B cells (BAPC) with high T cell activating capacities.Citation13 We therefore reasoned that this B cell subpopulation could also be part of the antitumor immune response in the TME. Indeed, we found a significantly increased percentage of CD86+/CD21− B cells in the TME of HNSCC (5.42 ± 4.48%) compared to PBMC HNSCC (p = 0.0025) and non-cancerous mucosa (1.43 ± 0.82%; p = 0.0003; , left), while there was no significant difference between PBMC HC and PBMC HNSCC (1.57 ± 1.22% and 2.72 ± 2.58%). Of note, the percentage of this antigen-presenting phenotype was significantly lower in the TME of HPV+ HNSCC compared to HPV− HNSCC (7.99 ± 5.33% vs. 3.11 ± 1.56%; p = 0.01; , right). Analysis of this subpopulations in OPSCC only showed comparable results (data not shown).
Figure 2. Phenotypes of B cell subsets in different compartments of HPV± HNSCC patients and healthy controls.
Single cell suspensions from HNSCC tumor tissue (n = 38), non-cancerous mucosa (n = 14), PBMCs from HNSCC patients (PBMC HNSCC, n = 38) and healthy controls (PBMC HC, n = 20) were analyzed by flow cytometry regarding B cell related surface and cytoplasmic antigens. (A) The percentage of CD86+ B cells is shown in scatter plots (left). Bar graphs demonstrate the median fluorescence intensity (MFI) of CD86 on B cells in different compartments (mean ± standard error of the mean). (B) Scatter plots comparing the percentages of CD86+/CD21− antigen-presenting B cells in different compartments (left) and in tumor stratified according to HPV status (right). (C) Exemplary histogram and dot plots from a single HNSCC patient demonstrate frequencies of cell populations defined by IgD and CD27 surface expression in tumor microenvironment and PBMC. (D) Percentages of memory B cell phenotype IgD−/CD27+ within the B cell fraction are shown in scatter plots. (E) Naïve B cell phenotype IgD+/CD27− percentages in different compartments are depicted in a scatter plot (left), fractions in the TME of HNSCC are stratified according to HPV association and displayed in a scatter plot (right). (F) Percentages of regulatory IL-10+ B cells in PBMC HC (n = 6), PBMC HNSCC (n = 8) and TME of HNSCC (n = 8) are shown. (G) Scatter plots demonstrate frequencies of regulatory B cell phenotype CD24hi/CD38hi. (H) Proportions of CD25hi B cells are shown in a scatter plot in different compartments. (I) Percentages of IL-10+ cells within CD19+ B cells and regulatory phenotypes CD24hi/CD38hi/CD19+ and CD25hi/CD19+ in the TME of HNSCC (left) and respective IL-10 median fluorescence intensity of CD19+, CD24hi/CD38hi/CD19+ and CD25hi/CD19+ populations (right) are shown. B cells derived from the TME of HNSCC (n = 8) were analyzed. MFI values are displayed as relative fluorescence intensities and are only comparable with values obtained in the same experiment. (J) Exemplary flow cytometry data of a single HNSCC is shown. Dot plots on the left display percentages of IL-10+ subpopulations of CD19+ B cells and regulatory phenotypes CD24hi/CD38hi/CD19+ and CD25hi/CD19+ corresponding to data in left plot of (I). IL-10 fluorescence intensity of these populations is shown in an overlay histogram (right) corresponding to data displayed in the right graph of (I). 300 events are displayed in every dot plot on the left. For statistical analysis, Kruskal-Wallis test was performed in (A), left plot of (B) and (E), (D), (F) – (I), Mann-Whitney test in right plot of (B) and t test in right plot of (E). Data is presented as mean (± standard error of the mean in right plot of (A) and in (I)). *P < 0.05; **P < 0.005; ns, not significant.
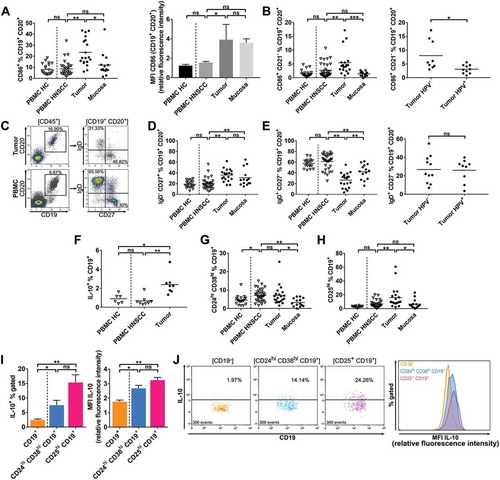
Distribution of memory and naïve B cell fractions defined by CD27 vs. IgD surface expression in tumor and PBMC from one exemplary patient is shown in . Antigen-experienced memory B cells (IgD−/CD27+) were increased in tumor tissue (35.84 ± 11.09%) and mucosa (31.02 ± 15.93%) compared to PBMC HNSCC (19.95 ± 10.45%; p < 0.0001 and p = 0.0058, respectively) and PBMC HC (18.92 ± 5.83%; ). Immature, naïve B cells (IgD+/CD27−) show reciprocal distribution compared to memory B cells with highest percentages in PBMC HNSCC (61.35 ± 14.27%) followed by PBMC HC (57.60 ± 7.97%) and compared to PBMC HNSCC significantly lower percentages in mucosa (42.23 ± 13.98%; p < 0.0001) and tumor (26.55 ± 13.52%; p < 0.0001). The percentage of naïve B cells in the TME was even lower than in mucosa (p = 0.003; , left) and was unaffected by HPV status (, right). Likewise, percentages of memory B cells were comparable in HPV± HNSCC (data not shown).
Growing evidence suggests that B cells can also contribute to an immunosuppressive, tumor promoting microenvironment, primarily via secretion of interleukin 10 (IL-10).Citation25 We could detect comparable percentages of IL-10+ B cells in PBMC HC and PBMC HNSCC (0.90 ± 0.48% and 0.68 ± 0.50%), while the percentage was significantly higher in the TME of HNSCC compared to PBMC HNSCC (2.40 ± 1.01%; p = 0.0013; ). Different B cell phenotypes were previously described that contain high percentages of IL-10 producing cells.Citation22,Citation23 We therefore studied the presence of these regulatory B cell phenotypes in HNSCC. Regulatory B cells that are characterized by high CD24 and CD38 expression were significantly increased in the CD19+ fraction of PBMC HNSCC compared to PBMC HC (7.11 ± 3.26% vs. 4.60 ± 2.50%; p = 0.016). The percentage within the TME was increased compared to mucosa (7.06 ± 5.10% vs. 3.27 ± 2.22%; p = 0.031; ). CD25hi/CD19+ B cells were found in significantly higher percentages in tumor tissue (15.92 ± 15.20%) compared to PBMC HNSCC (6.55 ± 4.94%; p = 0.0088) and mucosa (6.49 ± 6.67%; p = 0.009), whereas the fractions in PBMC HNSCC and PBMC HC (2.87 ± 0.93%) were similar (). The percentage of IL-10 expressing cells within CD24hi/CD38hi/CD19+ and CD25hi/CD19+ regulatory subsets was significantly increased compared to the overall CD19+ B cell population derived from the HNSCC microenvironment (7.50 ± 4.76% and 15.31 ± 7.52% vs. 2.44 ± 1.03%; p = 0.36 and p < 0.0001, respectively; , left). Increased MFI levels of IL-10 in overall CD24hi/CD38hi/CD19+ and CD25hi/CD19+ populations compared to CD19+ B cells in HNSCC TME additionally confirmed their regulatory phenotype (2.67 ± 0.61 and 3.24 ± 0.56 vs. 1.76 ± 0.31; p = 0.044 and p = 0.0006; , right). IL-10 expression of CD19+ B cells and CD24hi/CD38hi/CD19+ and CD25hi/CD19+ subpopulations derived from a single HNSCC sample is shown in in dot plots (left), demonstrating increased frequencies of IL-10+ cells in regulatory B cell subpopulations. IL-10 MFI levels of these same populations are shown in an overlay histogram on the right side of , again demonstrating elevated levels of IL-10 expression in the investigated regulatory subpopulations.
TLS and lymphocytes involved in antibody-dependent immune responses/antibody-production are present in HNSCC
TLS have initially been described as temporary ectopic lymphoid aggregates in inflamed tissue, which are composed of different lymphocyte subsets. In recent years, their relevance in cancer as important hubs for an antitumor immune response has been established.Citation26 In this study, TLS in different stages of development could be detected in tumor stroma, mainly at the invasive margin, by staining for CD20+ B cells. Three different examples of TLS within the TME of HNSCC are shown in (left column). High numbers of plasma cells (MUM1+) were observed around some TLS (; right column) as previously described by Germain et al. in lung cancer.Citation27 Consecutive sections of HNSCC-1 show a TLS with densely aggregated CD20+ cells (; top row left) adjacent to the tumor and a high level of surrounding MUM1+ plasmacells (; top row right) whereas the aggregation of CD20+ cells in HNSCC-2 and −3 is less pronounced and the degree of detectable MUM1+ plasmacells is reduced (; middle/bottom row).
Figure 3. TLS and phenotypes of lymphocytes involved in antigen-recognition and antibody-production in HNSCC.
Single cell suspensions from HNSCC tumor tissue (n = 38), non-cancerous mucosa (n = 14), PBMCs from HNSCC patients (PBMC HNSCC, n = 38) and healthy controls (PBMC HC, n = 20 for B cell subsets; n = 10 for T cell subsets) were analyzed by flow cytometry regarding B and T cell related surface antigens. (A) Exemplary immunohistochemical stainings of CD20 (left column) and MUM1 (right column) demonstrate tertiary lymphoid structures and a different degree of surrounding plasmacells. Each row contains consecutive sections of a HNSCC stained with CD20 antibody (left) and MUM1 antibody (right). (B) The percentage of plasmablast (upper plot) and plasma cell (lower plot) subpopulations is shown in scatter plots. (C) T follicular helper cells (CXCR5+/CD45RA−/CCR7−/CD4+) in percent of T cells in different compartments are displayed in the upper plot, the lower plot shows the percentage of PD-1+/ICOS+ Tfh. For statistical analysis, Kruskal-Wallis test was performed in (B) and upper plot of (C), one-way ANOVA was performed in lower plot of (C). Data is presented as mean. *P < 0.05; **P < 0.005; ns, not significant.
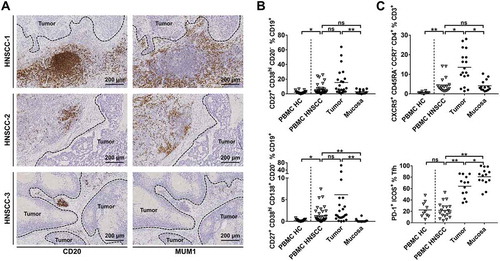
Flow cytometry analyses revealed significantly higher percentages of plasmablasts (CD27+/CD38hi/CD20−) within the CD19+ B cell fraction in single cell suspensions derived from HNSCC tissue (15.53 ± 17.51%; ; upper plot) compared to mucosa (2.88 ± 2.77%; p < 0.0001), but not PBMC HNSCC (5.94 ± 6.86%). Additionally, PBMC HNSCC contained higher percentages of plasmablasts than PBMC HC (5.94 ± 6.86% vs. 2.14 ± 1.74%; p = 0.035). Similarly, CD27+/CD38hi/CD138hi/CD20− plasma cells were significantly increased in PBMC HNSCC compared to PBMC HC (1.35 ± 1.77% vs. 0.26 ± 0.20%; p = 0.015). Plasma cell percentages were highest in tumor samples (6.15 ± 14.44%), although differences were only significant compared to mucosa (0.17 ± 0.37%; p < 0.0001), but not PBMC HNSCC (, lower plot). T follicular helper cells (Tfh) are important for B cell survival and maturation in germinal centersCitation28 and are also present in TLS.Citation15 Defined by CXCR5+/CD45RA−/CCR7−/CD4+, they represent a substantial fraction of CD3+ cells in the TME of HNSCC (13.57 ± 8.54%) with lower percentages in mucosa (4.31 ± 2.86%; p = 0.034) and PBMC HNSCC (4.55 ± 3.95%; p = 0.033). Percentages of Tfh in the CD3+ fraction of PBMC HC (0.63 ± 0.47%) was lower than in PBMC HNSCC (p = 0.002; , upper plot). ICOS and PD-1 molecules are known to be functionally relevant in Tfh.Citation29,Citation30 The fraction of PD-1+/ICOS+ Tfh was significantly increased in tumors (64.20 ± 18.71%) compared to PBMC HNSCC (21.83 ± 13.26%; p < 0.0001) and even higher in mucosa (80.67 ± 15.38%), while expression in PBMC HC was comparable to PBMC HNSCC (22.51 ± 13.51% vs. 21.83 ± 13.26%; , lower plot).
Gene expression of multiple TAAs and TAA-directed humoral immune response differ in HPV+ vs. HPV− HNSCC
Analysis of HNSCC data from ‘The Cancer Genome Atlas’ (TCGA) showed gene-overexpression of different cancer/testis antigens (CTA) and other TAA in tumor tissue compared to non-cancerous mucosa (). Gene expression was analyzed in 44 healthy mucosa samples, 72 HPV− HNSCC and 32 HPV+ HNSCC. Significantly altered gene expression compared to non-cancerous mucosa was observed in 17/23 genes in HPV− HNSCC and in 10/23 genes in HPV+ HNSCC. The highest log2 fold change in HPV− HNSCC was observed for MAGEA1 and MAGEA3 (6.08 and 5.58, respectively). Conversely, CDKN2A gene, which codes for p16INK4A protein, was highly overexpressed in HPV+ HNSCC (log2 fold change 5.01) as shown previously.Citation31 Of note, expression levels of TP53 wild type gene was significantly decreased in HNSCC irrespective of HPV status compared to mucosa. As illustrated in , strongly increased gene expression of TAAs was preferentially observed in a subset of HNSCC, while in other tumor samples expression levels of the same gene were similar to mucosa.
Table 2. Summary of TAA gene expression and TAA antibody detection in HNSCC. Differential gene expression of 23 TAAs compared to non-cancerous mucosa in a cohort of 72 HPV− and 32 HPV+ HNSCC is displayed and numbers of positive antibody responses (MFI > 200) against 23 TAAs in HPV−/+ HNSCC patients and healthy controls are summarized.
Figure 4. Gene expression of TAAs in HNSCC/mucosa and serological detection of TAA-specific antibodies in HNSCC patients and healthy donors.
(A) Gene expression data of 23 different TAAs was obtained from TCGA HNSCC samples and is summarized in a heatmap. Results from non-cancerous mucosa are displayed on the left (n = 44), followed by HPV− (n = 72) and HPV+ (n = 32) HNSCC color-coded as indicated in the legend on the right. (B) Serological antibodies against 23 TAAs were measured by Luminex bead assay. Respective MFI levels are shown in a heatmap (color code on right side). Samples obtained from healthy donors (n = 15; left) were compared to HNSCC patient derived serum samples (HPV−, n = 27; middle; HPV+, n = 9; right). (C) TAA antibody detection is summarized in stacked graphs, comparing healthy controls (HC) with HNSCC patients on the left and stratifying data from HNSCC patients according to HPV status, disease stage (UICC) and MHC-I expression level of respective primary tumors. Positive results with TAA-specific MFI levels > 200 per patient were summed up. Antibodies against none up to a maximum of five TAAs were detected in single subjects.
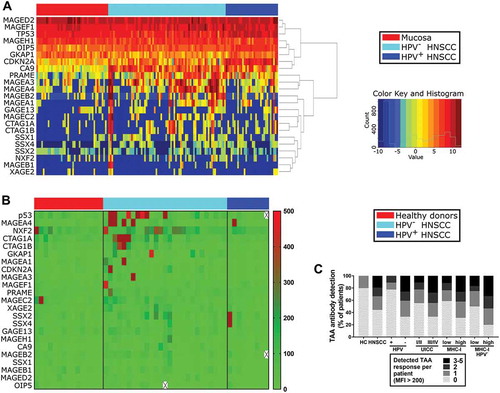
Humoral IgG immune responses against aforementioned 23 TAAs were quantified by multiplex analysis in the serum of 27 HPV−, 9 HPV+ HNSCC patients and 15 healthy donors. Median fluorescence intensity (MFI) > 200 was counted as a positive result. The average MFI of healthy donor samples was 24.0 (95% confidence interval; 22.5 to 27.0). Consistent with gene expression results, detection of TAA antibody responses correlated positively with the presence of a HNSCC (rs = 0.41; p = 0.003; /C). Positive antibody responses against a maximum of 1/23 investigated TAAs were detected in only 3/15 healthy donors. Positive responses against up to 2 TAAs were detectable in 2/9 HPV+ HNSCC patients. Only 9/27 HPV− HNSCC patients had no antibody response against the tested TAAs compared to 7/9 in HPV+ HNSCC patients and 12/15 in healthy donors. In contrast, 18/27 HPV− HNSCC patients showed antibody responses against at least one TAA (/C). The probability to detect antibody responses correlated significantly with lack of HPV association in HNSCC patients (rs = 0.39; p = 0.019). Responses against up to 5 TAAs were detected in an individual patient. The most frequently detected antibody responses in HNSCC patients were directed against NXF2 (n = 9), p53 (n = 7), MAGEA4 (n = 5) and NY-ESO-1 (CTAG1A; n = 6 and CTAG1B; n = 3).
Furthermore, advanced stage disease (UICC stage III/IV) correlated positively with detectable TAA antibody response (rs = 0.34; p = 0.044). Only in 3/17 patients with negative or low MHC-I expression on tumor cells evaluated by immunohistochemistry, a strong TAA antibody response (MFI > 400) was detected. High MHC-I expression correlated positively with detection of strong antibody responses (rs = 0.38; p = 0.028). Since HPV+ tumors are known to show dysregulated MHC-I expression,Citation32 the analysis was performed in HPV− HNSCC patients only as well. Results regarding the correlation of high MHC-I expression and TAA antibody response could be confirmed in this subset (rs = 0.41; p = 0.034; ).
CD4+-dominated T cell tumor infiltrate in TAA antibody-positive HNSCC patients
To investigate whether the composition of the TME influences tumor antigen recognition and humoral immune response in HNSCC, flow cytometry data regarding tumor-infiltrating lymphocytes was compared in patients without detected TAA antibody response (TAA−) and with detected response against at least one TAA (TAA+). The percentage of B cells within the CD45+ lymphocyte fraction was similar in the TME of HNSCC irrespective of TAA antibody detection (, left). The plasma cell fraction of CD19+ cells showed high variance in TAA+ HNSCC (10.79 ± 19.17%) and was higher than in TAA− HNSCC (1.23 ± 0.91%). However, the observed difference was not statistically significant (p = 0.070; , right). As observed for B cells, CD3+ T cells made up comparable percentages of CD45+ cells in TAA− and TAA+ HNSCC (). The composition of the T cellular tumor infiltrate differed in T cell subpopulations. Higher percentages of CD8+ T cells were detected in the TME of TAA− HNSCC compared to TAA+ HNSCC (37.61 ± 11.71% vs. 22.97 ± 9.44%; p = 0.004; , left). In contrast, the proportion of CD4+ cells in TAA+ HNSCC was increased (58.08 ± 13.83% vs. 46.90 ± 9.76%; p = 0.044, , middle). An increased percentage of Tfh (CXCR5+/CD45RA−/CCR7−) within the CD4+ fraction of TAA+ HNSCC contributed to this finding. They constituted 34.13 ± 18.28% in TAA+ HNSCC compared to significantly lower 17.49 ± 16.12% in TAA− HNSCC (p = 0.047; , right). Analysis of T cell subsets showed comparable results in HPV− HNSCC only. CD3+ cells made up similar proportions of CD45+ cells in TAA− and TAA+ subgroups (Supplementary Fig. 1A). Differences in the percentage of CD4+ and CD8+ T cells were even more pronounced when analyzing HPV− HNSCC only (42.14 ± 8.87% vs. 58.15 ± 13.10%, p = 0.046 and 43.17 ± 9.44% vs. 21.56 ± 6.79%, p = 0.0004, respectively; Supplementary Fig. 1B).
Figure 5. Composition of tumor-infiltrating lymphocytes in tumors stratified according to serological TAA antibody detection.
Single cell suspensions from HNSCC tumor tissue (n = 38) were analyzed for B and T cell antigens by flow cytometry. Patients were stratified according to serological antibody detection against 23 TAAs in TAA− (no antibody response detected) and TAA+ (detection of antibodies against at least one investigated TAA). (A) The fraction of CD19+/CD20+ B cells (left) and plasmacells (CD27+/CD38hi/CD138hi/CD20−; right) in the microenvironment of TAA− and TAA+ tumors is displayed in scatter plots. (B) Proportions of CD3+ T cells within the CD45+ lymphocyte fraction are shown in scatter plots in TAA−/+ tumors. (C) Scatter plots demonstrate fractions of CD8+ T cells (left), CD4+ T cells (middle) and T helper cells (CXCR5+/CD45RA−/CCR7−) in percent of CD4+ T cells (right) in TAA−/+ HNSCC. For statistical analysis, Mann-Whitney test was performed in (A), t test in (B) and (C). Data is presented as mean. *P < 0.05; **P < 0.005; ns, not significant.
Discussion
The importance of the immune system in antitumor immunity is increasingly well accepted. Checkpoint inhibition therapy has opened new ways of cancer therapy by shaping the immune response in an antitumor fashion. However, only a minor subset of patients benefits from checkpoint inhibition. To understand, why these patients respond to therapy and others do not, a detailed knowledge of immune cells engaging in tumor responses is warranted. The composition of T cell subsets in HNSCC has been studied by different groups.Citation17,Citation33,Citation34 In contrast, knowledge about B cellular components of the TME in HNSCC is scarce. This study provides comprehensive data of tumor-associated B cell subsets in HNSCC and demonstrates different TAA gene expression patterns in HPV+ and HPV− HNSCC patients. Furthermore, antibody responses against various TAAs could be detected by multiplex analysis revealing correlations with flow cytometry results. Studies describing antibody responses against single TAAs have been conducted before.Citation19,Citation35 However, our approach of integrating antibody response data of more than 20 TAAs and flow cytometry results of tumors of the same patients is novel.
To our knowledge, this is the first study investigating B cell subpopulations in HNSCC in detail by flow cytometry. Most previous studies relied on immunohistochemical analyses, which does not allow reliable analyses of distinct B cell subsets.Citation34,Citation36 We found increased numbers of lymphocytes and B cells in the TME of HPV-associated tumors compared to HPV− HNSCC and non-cancerous mucosa. This finding supports previous studies investigating B cells in HNSCC by CD20 immunohistochemistry. Interestingly, Distel et al. provided evidence that CD20+ tumor infiltrating lymphocytes are a predictor of favorable outcome in early stage HNSCC, whereas there is an inverse correlation in advanced stage suggesting a plasticity in the function and composition of B cells over the course of the disease.Citation37 In our study, TAA antibody responses were detected more frequently in late stage HNSCC, although B cellular subsets did not differ in relation to disease stage. Despite evident recognition of tumor antigens, the immune system apparently fails to induce sufficient effector antitumor activity. Therefore, dysfunctional immune responses might be due to defective interplay between different immune cell subsets. This notion is supported by the finding in esophageal and gastric cancer that overall survival in patients with combined high T and B cell infiltration of the tumor is superior to high T cell infiltration only.Citation38 Of note, it is unlikely that the observed increase in TAA antibody responses in advanced stage is due to higher CTA protein expression on tumor cells since studies in HNSCC focusing on MAGE family antigens observed TAA expression irrespective of disease stage.Citation19,Citation39 MHC-I downregulation or complete loss is a known mechanism of immune evasion by many cancer entities including HNSCC.Citation32 In accordance with a previous study in HNSCC, we did not find a significant correlation between MHC-I expression and UICC stage.Citation40 However, we observed stronger humoral TAA antibody responses in patients with tumors that showed high MHC-I expression, suggesting that MHC-I expression in HNSCC does not only influence effector T or NK cell responses, but might also influence B cell function. This could be supported by the finding that MHC-I expression in biliary tract cancers correlates with CD20+ cell density in the TME, although the correlation was weaker than with CD4+/8+ T cells.Citation41 Phenotypic description of tumor-associated B cells in this study revealed a high percentage of activated and antigen-presenting B cell phenotypes in HNSCC TME indicating an active function in tumor recognition and antitumor response. Inhibitory immune checkpoint CTLA-4 on T cells exhibits higher affinity to CD80 and CD86 compared to costimulatory CD28.Citation42 Hence, despite high expression levels of CD86 on antigen-presenting B cells, activation of T cells might be substantially impaired in HNSCC microenvironment due to previously demonstrated high percentages of CTLA-4 expressing T cells in the TME.Citation33 The percentage of BAPC in HPV-driven tumors was decreased compared to HPV− HNSCC. This might be explained by higher mutational rate in HPV− HNSCCCitation43 and therefore increased immunogenicity and infiltration by antigen-presenting cells. Indeed, the TME of microsatellite-unstable colorectal cancer comprise higher numbers of antigen-presenting cells such as dendritic cells than microsatellite-stable cancers.Citation44 On the other hand, Partlová et al. demonstrated increased numbers of antigen-presenting dendritic cells in HPV+ HNSCCCitation17 and Mansuet-Lupo et al. found tumor-infiltrating dendritic cells irrespective of the number of mutations in lung adenocarcinoma.Citation45 However, it remains to be established, whether BAPCs in cancer show similar infiltration patterns as dendritic cells.
Memory B cells are key players in antibody-mediated responses against self- and non-self antigens and therefore might contribute to antitumor immunity. In this study, they made up the largest proportion of B cells in the TME, which is in accordance with results obtained in non-small cell lung cancer.Citation27 However, their antitumorigenic role is discussed controversially, because their phenotype shows similarities to that of an immunosuppressive regulatory B cell (Breg) population in tumors that is generated by IL-21 stimulation and confers decreased T cell proliferation via granzyme B.Citation46 Notably, these Bregs also expressed high levels of activation marker CD86 which was observed on a high percentage of intratumoral B cells in this study as well.
Regulatory functions can be exerted by B cells in various ways. The most commonly studied is IL-10 secretion, but they can also act immunosuppressive via TGF-β or IL-35 production.Citation47 Different Breg phenotypes have been described in cancer. In this study, the percentage of IL-10+ Breg and CD24hi/CD38hi and CD25hi B cell phenotypes were increased in the TME of HNSCC. However, overall IL-10 levels in the latter phenotypes was low despite being significantly increased compared to all B cells. These ambiguous results demonstrate that regulatory B cells are a heterogeneous population and that phenotypic characterization still lacks well-defined markers. A study in tongue squamous cell carcinoma demonstrated IL-10 producing Bregs that induced regulatory T cells,Citation48 while to the best of our knowledge, there are no other publications describing Breg in HNSCC. In a preliminary presentation, Huber et al. reported low frequencies of adenosine-producing regulatory B cells in PBMC of untreated HNSCC patients, which increased after chemotherapy.Citation49 This suggests that Bregs in HNSCC might also shape the response to therapy and indicates a functional relevance in HNSCC. However, in our analysis, pre-treatment Breg populations made up only a relatively low fraction of B cells in blood and tumor.
Consistent with a previous study in OSCC, we detected TLS in HNSCC stroma mainly at the invasive margin. Wirsing et al. could establish an association between TLS and good prognosis in OSCC.Citation14 Their composition and function in HNSCC has not been further investigated so far. We demonstrate here that Tfh, which are key players in TLS, make up a substantial proportion of the T cellular infiltrate in HNSCC and that their frequency in the TME increases significantly in patients with detectable TAA antibody response. This is indicative of a crucial role of TLS for an orchestrated antitumor response and induction of a humoral immune response in HNSCC. A study by Germain et al. supports these findings by demonstrating high numbers of B cells organized in TLS in the TME of lung cancers and antibody responses against TAAs by TME-derived B cells.Citation27 On the other hand, Affara et al. demonstrated in a murine SCC model that B cells contribute to carcinogenesis by antibodies that form circulating immune complexes and deposits in premalignant lesions, thereby fostering development into malignancy.Citation12,Citation50 However, the contribution of TAAs to an antitumor immune response might be supported by the observation that although NY-ESO-1 directed antibodies could be detected in serum of HNSCC patients, the respective tumors were NY-ESO-1 negative. This suggests successful eradication of NY-ESO-1 positive tumor cells.Citation19 The effect of B-cell derived antibodies might be dependent on the composition of the TME and thus its potential to generate successful antitumor responses. This might also be reflected by ambiguous results regarding the prognostic impact of plasma cellular infiltration in different cancer entities.Citation10,Citation51 To further evaluate the functional relevance of tumor-associated B cells in HNSCC, it will be important to examine tumor-antigen specificity especially of B cells within the tumor microenvironment in addition to detection of serological TAA antibody responses in future studies. Different approaches to analyze the B cell receptor repertoire for known antigens have been developed Citation52–Citation54. These techniques are based on B cell receptor analysis of single cells and can detect even low frequencies of antigen-specific B cells. They might be adapted to analyze tumor antigen-specificity of B cells in the tumor microenvironment of HNSCC and could also bear significant clinical relevance by developing tumor-antigen specific antibodies with high affinity. The contribution of antigen-specific B cells to antitumor immunity has also been the focus of previous preclinical studies in our group.Citation55
In conclusion, we here identify different B cell subsets and components of TLS in HNSCC and demonstrate humoral immune responses against multiple TAAs in HNSCC patients. A detailed knowledge of the immune infiltrate and preexisting immune responses might prove valuable to assess the potential benefit of immune modulatory treatment options in HNSCC patients. Furthermore, multiplex TAA screening could be a useful diagnostic tool in HNSCC.
Material and methods
Patient characteristics
Tumor (n = 38), non-cancerous mucosa (n = 14) and peripheral blood samples (n = 38) were obtained from newly diagnosed, previously untreated HNSCC patients between 2014 and 2017. PBMCs from peripheral blood samples from 20 age- and sex-matched healthy donors were used as controls for flow cytometry, serum samples from 15 additional healthy donors were analyzed in the antibody detection array. Disease stage was assessed according to the 8th edition of the tumor-node-metastasis classification.Citation56 Patient characteristics are summarized in . The study was approved by the institutional review board (protocol no. 11–116) and written informed consent was obtained from all patients and healthy donors prior to any study-related procedure.
Cell and serum isolation from blood and tissue
PBMCs were isolated from peripheral blood samples by density gradient centrifugation with Pancoll Human (PAN-Biotech, Cat. No. P04-60100). Serum samples were obtained by centrifugation in designated containers. All blood samples were taken prior to surgery. Tumor and mucosa samples were taken during tumor biopsy or surgical resection and immediately processed. Unfixed tissue was mechanically and enzymatically (100U/mL DNase, Applichem; Cat. No. A3778 and 320U/mL Collagenase IV, Worthington; Cat. No. LS004180) dissolved using a gentleMACS Dissociator (Miltenyi). Cells were transferred into single cell suspensions for flow cytometry by filtering through 100µm and 70µm nylon cell strainers (Greiner Bio-One; Cat. No. 89508–344 and 89508–340).
Flow cytometry
Single cell suspensions from tissue and PBMCs were analyzed on a Gallios 10-color flow cytometer (Beckman Coulter) on the day of sample acquisition. At least 5 × 10⁵ events per sample were acquired and lymphocyte subsets were determined using anti-human antibody-conjugates CD45-PE-eFluor610 (HI30; eBioscience), IgD-FITC (clone: IA6-2), CD86-PE (IT2.2), CD86-BV421 (IT2.2), CD38-PerCP/Cy5.5 (HIT2), CD27-PE/Cy7 (O323), CD21-APC (Bu32), CD138-Alexa Fluor 700 (MI15), CD19-APC/Cy7 (HIB19), CD19-APC-Fire 750 (SJ25C1), CD20-Pacific Blue (2H7), CD24-FITC (ML5), CD25-Alexa Fluor 700 (BC96), CCR7-FITC (G043H7), ICOS-PE (C398.4A), CD4-PerCP/Cy5.5 (RPA-T4), CD8-PE/Cy7 (HIT8a), PD1-APC (EH12.2H7), CD45RA-Alexa Fluor 700 (HI100), CD3-APC-Cy7 (HIT3a), CD3-Alexa Fluor 700 (SK7), Interleukin-10-PE (JES3-19F1), CXCR5-PB (J252D4; all Biolegend) and aqua dead cell stain (Life Technologies). Intracellular IL-10 staining was performed using an intracellular staining kit purchased from Biolegend. After live/dead and surface staining cells were fixed and permeabilized according to the manufactures protocol.
Immunohistochemistry
Formaldehyde-fixed, paraffin-embedded tissue sections of 3µm thickness from tumor resection or biopsy were used for immunohistochemistry. Monoclonal mouse anti-human primary antibody for p16INK4A (1:50; clone: G175-405; BD Biosciences; Cat. No. 550834), HLA-ABC (1:100; clone: EMR8-5; Abcam; Cat. No. AB70328), CD20 (1:250; clone L26; Dako; Cat. No. M0755) and MUM1 (1:1000; clone: MUM1p; Dako; Cat. No. M725929-2) were applied. Detection of primary antibodies was achieved by secondary goat anti-mouse antibody conjugated with a HRP-labelled polymer (Dako EnVision+) and peroxidase activity was visualized by diaminobenzidine tetrahydrochloride. Hematoxylin was used as nuclear counterstaining. Detection of HLA-ABC expression in ≥ 70% of tumor cells counted as high MHC-I expression, strong cytoplasmic and nuclear staining was regarded positive for p16INK4A expression.
Determination of HPV status
DNA extraction, detection of HPV DNA and identification of HPV subtypes was performed as previously described.Citation57 HPV status was determined by the combination of positive p16INK4A immunostaining and detection of HPV-specific DNA.
Serological antibody detection
A TruePLEXTM antibody profiling array was obtained from Origene. Antibody detection and quantification was performed on a Luminex® 200™ device according to the manufacturer’s protocol. In short, purified, HEK293T-expressed recombinant human proteins with C-terminal myc-DDK tag or E. coli-overexpressed and purified human protein with N-terminal His tag (E. coli-overexpressed: MAGEC2, NXF2, OIP5) were coupled to Luminex beads. A bead mix, containing beads coupled with anti-human IgG, recombinant human serum albumin, BSA-myc-DDK and donkey IgG, was included as control. Every sample was tested with this mix as an internal control in addition to a negative and positive control. Diluted serum samples were analyzed in doublets and the median fluorescence intensity per sample was used for further analysis. MFI ≥ 200 was considered a positive result.
Gene expression analysis
144 samples with known HPV status (44 non-cancerous mucosa, 72 HPV− and 32 HPV+ HNSCC) were downloaded from TCGA.Citation58 RNA-Seq data were mapped against the human genome version hg19 with TopHat2-2.0.12.Citation59 R-3.4.1Citation60 and Bioconductor 3.6Citation61 were used for the RNA-Seq analysis. Reads were counted using the R package GenomicAlignmentsCitation62 (mode = ’Union’, inter.feature = FALSE), only primary read alignments were retained. In order to normalize the read counts we used the equation below.
DESeq2 normalization factors were obtained using DESeq2.Citation63 Log 2 fold change values were obtained by comparing the normalized read counts. P-values were calculated using the Wilcoxon rank sum test and corrected using the Benjamini & Hochberg method.Citation64,Citation65,was created using ggplot2_1.0.0 on the log 2 values of the normalized read counts. The dendogram of the heatmap was generated using hierarchical clustering with complete linkage.
Data analysis
Data is presented as mean ± standard deviation, unless otherwise stated. Kaluza software (version 1.1; Beckman Coulter) and GraphPad Prism 7 (GraphPad Software) were used to analyze flow cytometry data. Samples containing ≥ 500 CD3+ T cells or ≥ 200 CD20+/CD19+ B cells were subjected to respective subset analysis. Normality and homoscedasticity were tested by Shapiro-Wilk and Levene’s test. In case of normal distribution and homoscedasticity, one-way ANOVA was performed to compare independent measures of more than two groups and Student’s t-test for comparison of two groups. Otherwise, non-parametric Mann-Whitney or Kruskal-Wallis tests were used for comparisons of two or more than two groups, respectively. Spearman’s coefficient of rank correlation (rs) was applied to test for association between sets of ranked variables. P < 0.05 was considered statistically significant.
Disclosure of Potential Conflicts of Interest
The authors have no conflicts of interest related to this manuscript.
Author Contributions
Conception and study design: AL, HS, MBB, DB
Development of methodology: AL, HS, ASV, ST
Acquisition of data: AL, HS, SIR, MT, KW, RG, BG, OGS, CUH, MFM, JPK
Analysis and interpretation of data: AL, HS, SIR, AQ, MBB
Writing and review of the manuscript: AL, KW, MBB, DB
Study supervision: MBB, DB
Gene expression analysis: EC, JG, AH
Abbreviations
| ANOVA = | = | analysis of variance |
| BAPC = | = | antigen presenting B cell |
| Breg = | = | regulatory B cell |
| CA9 = | = | carbonic anhydrase 9 |
| CDKN2A = | = | cyclin dependent kinase inhibitor 2A |
| CTA = | = | cancer/testis antigen |
| CTAG1A/B = | = | cancer/testis antigen 1A/B |
| CTLA-4 = | = | cytotoxic T-lymphocyte-associated antigen 4 |
| DAB = | = | 3,3′-diaminobenzidine |
| DNA = | = | deoxyribonucleic acid |
| GAGE13 = | = | G antigen 13 |
| GKAP1 = | = | G kinase anchoring protein 1 |
| HC = | = | healthy control |
| HLA = | = | human leukocyte antigen |
| HNSCC = | = | head and neck squamous cell carcinoma |
| HPV = | = | human papillomavirus |
| ICOS = | = | inducible T cell costimulatory |
| MAGE = | = | melanoma antigen |
| MFI = | = | median fluorescence intensity |
| MHC = | = | major histocompatibility complex |
| NXF2 = | = | nuclear RNA export factor 2 |
| NY-ESO-1 = | = | New York Esophageal Squamous Cell Carcinoma 1 |
| OIP5 = | = | opa interacting protein 5 |
| PBMC = | = | peripheral blood mononuclear cells |
| PD-1 = | = | programmed cell death 1 |
| PD-L1 = | = | programmed cell death 1 ligand 1 |
| PRAME = | = | preferentially expressed antigen in melanoma, RNA = ribonucleic acid |
| SSX = | = | synovial sarcoma X breakpoint |
| TAA = | = | tumor associated antigen, TCGA = The Cancer Genome Atlas |
| Tfh = | = | T follicular helper cell |
| TLS = | = | tertiary lymphoid structure |
| TME = | = | tumor microenvironment |
| UICC = | = | Union for International Cancer Control |
| XAGE2 = | = | X antigen family member 2 |
Supplemental Material
Download Zip (161.9 KB)Supplemental data
Supplemental data for this article can be accessed here.
Additional information
Funding
Related Research Data
References
- Whiteside T. The role of regulatory T cells in cancer immunology. ImmunoTargets Ther. 2015;4:159. doi:10.2147/ITT.S55415.
- Jie H-B, Gildener-Leapman N, Li J, Srivastava RM, Gibson SP, Whiteside TL, Ferris RL. Intratumoral regulatory T cells upregulate immunosuppressive molecules in head and neck cancer patients. Br J Cancer. 2013;109:2629–2635. doi:10.1038/bjc.2013.623.
- Wherry EJ, Kurachi M. Molecular and cellular insights into T cell exhaustion. Nat Rev Immunol. 2015;15:486–499. doi:10.1038/nri3862.
- Ferris RL, Blumenschein G, Fayette J, Guigay J, Colevas AD, Licitra L, Harrington K, Kasper S, Vokes EE, Even C, et al. Nivolumab for recurrent squamous-cell carcinoma of the head and neck. N Engl J Med. 2016;375:1856–1867. doi:10.1056/NEJMoa1602252.
- Al-Shibli KI, Donnem T, Al-Saad S, Persson M, Bremnes RM, Busund LT. Prognostic effect of epithelial and stromal lymphocyte infiltration in non-small cell lung cancer. Clin Cancer Res. 2008;14:5220–5227. doi:10.1158/1078-0432.CCR-08-0133.
- Hennequin A, Derangère V, Boidot R, Apetoh L, Vincent J, Orry D, Fraisse J, Causeret S, Martin F, Arnould L, et al. Tumor infiltration by Tbet+ effector T cells and CD20+ B cells is associated with survival in gastric cancer patients. Oncoimmunology. 2016;5:e1054598. doi:10.1080/2162402X.2015.1054598.
- Ladányi A, Kiss J, Mohos A, Somlai B, Liszkay G, Gilde K, Fejos Z, Gaudi I, Dobos J, Tímár J. Prognostic impact of B-cell density in cutaneous melanoma. Cancer Immunol Immunother. 2011;60:1729–1738. doi:10.1007/s00262-011-1011-9.
- Berntsson J, Nodin B, Eberhard J, Micke P, Jirström K. Prognostic impact of tumour-infiltrating B cells and plasma cells in colorectal cancer. Int J Cancer. 2016;139:1129–1139. doi:10.1002/ijc.30138.
- Pretscher D, Distel LV, Grabenbauer GG, Wittlinger M, Buettner M, Niedobitek G. Distribution of immune cells in head and neck cancer: CD8+ T-cells and CD20+ B-cells in metastatic lymph nodes are associated with favourable outcome in patients with oro- and hypopharyngeal carcinoma. BMC Cancer. 2009;9:292. doi:10.1186/1471-2407-9-292.
- Lundgren S, Berntsson J, Nodin B, Micke P, Jirström K. Prognostic impact of tumour-associated B cells and plasma cells in epithelial ovarian cancer. J Ovarian Res. 2016;9. doi:10.1186/s13048-016-0232-0.
- Fremd C, Schuetz F, Sohn C, Beckhove P, Domschke C. B cell-regulated immune responses in tumor models and cancer patients. Oncoimmunology. 2013;2:e25443. doi:10.4161/onci.25443.
- Affara NI, Ruffell B, Medler TR, Gunderson AJ, Johansson M, Bornstein S, Bergsland E, Steinhoff M, Li Y, Gong Q, et al. B cells regulate macrophage phenotype and response to chemotherapy in squamous carcinomas. Cancer Cell. 2014;25:809–821. doi:10.1016/j.ccr.2014.04.026.
- Shimabukuro-Vornhagen A, García-Márquez M, Fischer RN, Iltgen-Breburda J, Fiedler A, Wennhold K, Rappl G, Abken H, Lehmann C, Herling M, et al. Antigen-presenting human B cells are expanded in inflammatory conditions. J Leukoc Biol. 2017;101:577–587. doi:10.1189/jlb.5A0416-182R.
- Wirsing AM, Rikardsen OG, Steigen SE, Uhlin-Hansen L, Hadler-Olsen E. Characterisation and prognostic value of tertiary lymphoid structures in oral squamous cell carcinoma. BMC Clin Pathol. 2014;14:38. doi:10.1186/1472-6890-14-38.
- Sautès-Fridman C, Lawand M, Giraldo NA, Kaplon H, Germain C, Fridman WH, Dieu-Nosjean M-C. Tertiary lymphoid structures in cancers: prognostic value, regulation, and manipulation for therapeutic intervention. Front Immunol. 2016;7:407. doi:10.3389/fimmu.2016.00407.
- Young D, Xiao CC, Murphy B, Moore M, Fakhry C, Day TA. Increase in head and neck cancer in younger patients due to human papillomavirus (HPV). Oral Oncol. 2015;51:727–730. doi:10.1016/j.oraloncology.2015.03.015.
- Partlová S, Bouček J, Kloudová K, Lukešová E, Zábrodský M, Grega M, Fučíková J, Truxová I, Tachezy R, Špíšek R, et al. Distinct patterns of intratumoral immune cell infiltrates in patients with HPV-associated compared to non-virally induced head and neck squamous cell carcinoma. Oncoimmunology. 2015;4:e965570. doi:10.1080/2162402X.2015.1008371.
- Broglie MA, Jochum W, Michel A, Waterboer T, Foerbs D, Schoenegg R, Stoeckli SJ, Pawlita M, Holzinger D. Evaluation of type-specific antibodies to high risk-human papillomavirus (HPV) proteins in patients with oropharyngeal cancer. Oral Oncol. 2017;70:43–50. doi:10.1016/j.oraloncology.2017.05.010.
- Atanackovic D, Blum I, Cao Y, Wenzel S, Bartels K, Faltz C, Hossfeld DK, Hegewisch-Becker S, Bokemeyer C, Leuwer R. Expression of cancer-testis antigens as possible targets for antigen-specific immunotherapy in head and neck squamous cell carcinoma. Cancer Biol Ther. 2006;5:1218–1225.
- Zamunér FT, Karia BTR, de Oliveira CZ, Dos Santos CR, Carvalho AL, Vettore AL. A comprehensive expression analysis of cancer testis antigens in head and neck squamous cell carcinoma revels MAGEA3/6 as a marker for recurrence. Mol Cancer Ther. 2015;14:828–834. doi:10.1158/1535-7163.MCT-14-0796.
- Kaminski DA, Wei C, Qian Y, Rosenberg AF, Sanz I. Advances in human B cell phenotypic profiling. Front Immunol. 2012;3:1–15. doi:10.3389/fimmu.2012.00198.
- Blair PA, Noreña LY, Flores-Borja F, Rawlings DJ, Isenberg DA, Ehrenstein MR, Mauri C. CD19+CD24hiCD38hi B cells exhibit regulatory capacity in healthy individuals but are functionally impaired in systemic lupus erythematosus patients. Immunity. 2010;32:129–140. doi:10.1016/j.immuni.2009.11.009.
- Kessel A, Haj T, Peri R, Snir A, Melamed D, Sabo E, Toubi E. Human CD19+CD25high B regulatory cells suppress proliferation of CD4+ T cells and enhance Foxp3 and CTLA-4 expression in T-regulatory cells. Autoimmun Rev. 2012;11:670–677. doi:10.1016/j.autrev.2011.11.018.
- Kaminski DA, Wei C, Rosenberg AF, Lee FE-H, Sanz I. Multiparameter flow cytometry and bioanalytics for B cell profiling in systemic lupus erythematosus. Methods Mol Biol. 2012;900:109–134. doi:10.1007/978-1-60761-720-4_6.
- Rosser EC, Mauri C. Regulatory B cells: origin, phenotype, and function. Immunity. 2015;42:607–612. doi:10.1016/j.immuni.2015.04.005.
- Goc J, Fridman W-H, Sautès-Fridman C, Dieu-Nosjean M-C. Characteristics of tertiary lymphoid structures in primary cancers. Oncoimmunology. 2013;2:e26836. doi:10.4161/onci.26836.
- Germain C, Gnjatic S, Tamzalit F, Knockaert S, Remark R, Goc J, Lepelley A, Becht E, Katsahian S, Bizouard G, et al. Presence of B cells in tertiary lymphoid structures is associated with a protective immunity in patients with lung cancer. Am J Respir Crit Care Med. 2014;189:832–844. doi:10.1164/rccm.201306-1150OC.
- Deenick EK, Ma CS. The regulation and role of T follicular helper cells in immunity. Immunology. 2011;134:361–367. doi:10.1111/j.1365-2567.2011.03487.x.
- Weber JP, Fuhrmann F, Feist RK, Lahmann A, Al Baz MS, Gentz L-J, Vu Van D, Mages HW, Haftmann C, Riedel R, et al. ICOS maintains the T follicular helper cell phenotype by down-regulating Krüppel-like factor 2. J Exp Med. 2015;212:217–233. doi:10.1084/jem.20141432.
- Good-Jacobson KL, Szumilas CG, Chen L, Sharpe AH, Tomayko MM, Shlomchik MJ. PD-1 regulates germinal center B cell survival and the formation and affinity of long-lived plasma cells. Nat Immunol. 2010;11:535–542. doi:10.1038/ni.1877.
- Slebos RJC, Yi Y, Ely K, Carter J, Evjen A, Zhang X, Shyr Y, Murphy BM, Cmelak AJ, Burkey BB, et al. Gene expression differences associated with human papillomavirus status in head and neck squamous cell carcinoma. Clin Cancer Res. 2006;12:701–709. doi:10.1158/1078-0432.CCR-05-2017.
- Näsman A, Andersson E, Nordfors C, Grün N, Johansson H, Munck-Wikland E, Massucci G, Dalianis T, Ramqvist T. MHC class I expression in HPV positive and negative tonsillar squamous cell carcinoma in correlation to clinical outcome. Int J Cancer. 2013;132:72–81. doi:10.1002/ijc.v132.1.
- Lechner A, Schlößer H, Rothschild SI, Thelen M, Reuter S, Zentis P, Shimabukuro-Vornhagen A, Theurich S, Wennhold K, Garcia-Marquez M, et al. Characterization of tumor-associated T-lymphocyte subsets and immune checkpoint molecules in head and neck squamous cell carcinoma. Oncotarget. 2017;8:44418–44433. doi:10.18632/oncotarget.17901.
- Nguyen N, Bellile E, Thomas D, McHugh J, Rozek L, Virani S, Peterson L, Carey TE, Walline H, Moyer J, et al. Tumor infiltrating lymphocytes and survival in patients with head and neck squamous cell carcinoma. Head Neck. 2016;38:1074–1084. doi:10.1002/hed.24406.
- Reuschenbach M, Waterboer T, Wallin KL, Einenkel J, Dillner J, Hamsikova E, Eschenbach D, Zimmer H, Heilig B, Kopitz J, et al. Characterization of humoral immune responses against p16, p53, HPV16 E6 and HPV16 E7 in patients with HPV-associated cancers. Int J Cancer. 2008;123:2626–2631. doi:10.1002/ijc.23837.
- Russell S, Angell T, Lechner M, Liebertz D, Correa A, Sinha U, Kokot N, Epstein A. Immune cell infiltration patterns and survival in head and neck squamous cell carcinoma. Head Neck Oncol. 2013;5:24.
- Distel LV, Fickenscher R, Dietel K, Hung A, Iro H, Zenk J, Nkenke E, Buttner M, Niedobitek G, Grabenbauer GG, et al. Tumour infiltrating lymphocytes in squamous cell carcinoma of the oro- and hypopharynx: prognostic impact may depend on type of treatment and stage of disease. Oral Oncol. 2009;45:e167–74. doi:10.1016/j.oraloncology.2009.05.640.
- Svensson MC, Warfvinge CF, Fristedt R, Hedner C, Borg D, Eberhard J, Micke P, Nodin B, Leandersson K, Jirström K. The integrative clinical impact of tumor-infiltrating T lymphocytes and NK cells in relation to B lymphocyte and plasma cell density in esophageal and gastric adenocarcinoma. Oncotarget. 2017;8:72108–72126. doi:10.18632/oncotarget.v8i42.
- Laban S, Atanackovic D, Luetkens T, Knecht R, Busch CJ, Freytag M, Spagnoli G, Ritter G, Hoffmann TK, Knuth A, et al. Simultaneous cytoplasmic and nuclear protein expression of melanoma antigen-A family and NY-ESO-1 cancer-testis antigens represents an independent marker for poor survival in head and neck cancer. Int J Cancer. 2014;135:1142–1152. doi:10.1002/ijc.28752.
- Näsman A, Andersson E, Marklund L, Tertipis N, Hammarstedt-Nordenvall L, Attner P, Nyberg T, Masucci GV, Munck-Wikland E, Ramqvist T, et al. HLA class I and II expression in oropharyngeal squamous cell carcinoma in relation to tumor HPV status and clinical outcome. PLoS One. 2013;8:1–12. doi:10.1371/journal.pone.0077025.
- Goeppert B, Frauenschuh L, Zucknick M, Roessler S, Mehrabi A, Hafezi M, Stenzinger A, Warth A, Pathil A, Renner M, et al. Major histocompatibility complex class I expression impacts on patient survival and type and density of immune cells in biliary tract cancer. Br J Cancer. 2015;113:1343–1349. doi:10.1038/bjc.2015.337.
- Pentcheva-Hoang T, Egen JG, Wojnoonski K, Allison JP. B7-1 and B7-2 selectively recruit CTLA-4 and CD28 to the immunological synapse. Immunity. 2004;21:401–413. doi:10.1016/j.immuni.2004.06.017.
- Stransky N, Egloff AM, Tward AD, Kostic AD, Sougnez C, Mckenna A, Shefler E, Ramos AH, Stojanov P, Carter SL, et al. The mutational landscape of head squamous cell carcinoma. Science. 2011;333:1157–1160. doi:10.1126/science.1205623.
- Bauer K, Michel S, Reuschenbach M, Nelius N, Von Knebel Doeberitz M, Kloor M. Dendritic cell and macrophage infiltration in microsatellite-unstable and microsatellite-stable colorectal cancer. Fam Cancer. 2011;10:557–565. doi:10.1007/s10689-011-9449-7.
- Mansuet-Lupo A, Alifano M, Cuchet NP, Biton JR, Becht E, Goc J, Germain C, Ouakrim H, Gnard JFR, Cremer I, et al. Intratumoral immune cell densities are associated with lung adenocarcinoma gene alterations. Am J Respir Crit Care Med. 2016;194:1403–1412. doi:10.1164/rccm.201510-2031OC.
- Lindner S, Dahlke K, Sontheimer K, Hagn M, Kaltenmeier C, Barth TFE, Beyer T, Reister F, Fabricius D, Lotfi R, et al. Interleukin 21–induced granzyme B–expressing B cells infiltrate tumors and regulate T cells. Cancer Res. 2013;73:2468–2479.
- Yuen GJ, Demissie E, Pillai S. B lymphocytes and cancer: a love-hate relationship. Trends Cancer. 2016;2:747–757. doi:10.1016/j.trecan.2016.10.010.
- Zhou X, Su Y-X, Lao X-M, Liang Y-J, Liao G-Q. CD19+IL-10+ regulatory B cells affect survival of tongue squamous cell carcinoma patients and induce resting CD4+ T cells to CD4+Foxp3+ regulatory T cells. Oral Oncol. 2016;53:27–35. doi:10.1016/j.oraloncology.2015.11.003.
- Huber U, Ziebart A, Schwarz S, Jerg M, Laban S, Hoffmann TK, Schuler P. 21 adenosine-producing B cells in patients with head and neck cancer. Oral Oncol. 2015;51:e34. doi:10.1016/j.oraloncology.2015.02.023.
- Andreu P, Johansson M, Affara NI, Pucci F, Tan T, Junankar S, Korets L, Lam J, Tawfik D, DeNardo DG, et al. FcRgamma activation regulates inflammation-associated squamous carcinogenesis. Cancer Cell. 2010;17:121–134. doi:10.1016/j.ccr.2009.12.019.
- Lohr M, Edlund K, Botling J, Hammad S, Hellwig B, Othman A, Berglund A, Lambe M, Holmberg L, Ekman S, et al. The prognostic relevance of tumour-infiltrating plasma cells and immunoglobulin kappa C indicates an important role of the humoral immune response in non-small cell lung cancer. Cancer Lett. 2013;333:222–228. doi:10.1016/j.canlet.2013.01.036.
- DeKosky BJ, Ippolito GC, Deschner RP, Lavinder JJ, Wine Y, Rawlings BM, Varadarajan N, Giesecke C, Dörner T, Andrews SF, et al. High-throughput sequencing of the paired human immunoglobulin heavy and light chain repertoire. Nat Biotechnol. 2013;31:166–169. doi:10.1038/nbt.2595.
- Franz B, May KF, Dranoff G, Wucherpfennig K. Ex vivo characterization and isolation of rare memory B cells with antigen tetramers. Blood. 2011;118:348–357. doi:10.1182/blood-2011-02-334870.
- Correa I, Ilieva KM, Crescioli S, Lombardi S, Figini M, Cheung A, Spicer JF, Tutt ANJ, Nestle FO, Karagiannis P, et al. Evaluation of antigen-conjugated fluorescent beads to identify antigen-specific B cells. Front Immunol. 2018;9:493. doi:10.3389/fimmu.2018.00493.
- Wennhold K, Thelen M, Schlößer HA, Haustein N, Reuter S, Garcia-Marquez M, Lechner A, Kobold S, Rataj F, Utermöhlen O, et al. Using antigen-specific B cells to combine antibody and T cell–based cancer immunotherapy. Cancer Immunol Res. 2017;5:730–743. doi:10.1158/2326-6066.CIR-16-0236.
- Brierley J, Gospodarowicz MK, Wittekind C. TNM classification of malignant tumours. 8th ed. Hoboken, NJ: Wiley-Blackwell; 2016.
- Wieland U, Ritzkowsky A, Stoltidis M, Weissenborn S, Stark S, Ploner M, Majewski S, Jablonska S, Pfister HJ, Fuchs PG. Papillomavirus DNA in basal cell carcinomas of immunocompetent patients: an accidental association? J Invest Dermatol. 2000;115:124–128. doi:10.1046/j.1523-1747.2000.00015.x.
- Lawrence MS, Sougnez C, Lichtenstein L, Cibulskis K, Lander E, Gabriel SB, Getz G, Ally A, Balasundaram M, Birol I, et al. Comprehensive genomic characterization of head and neck squamous cell carcinomas. Nature. 2015;517:576–582. doi:10.1038/nature14129.
- Kim D, Pertea G, Trapnell C, Pimentel H, Kelley R, Salzberg SL. TopHat2: accurate alignment of transcriptomes in the presence of insertions, deletions and gene fusions. Genome Biol. 2013;14:R36. doi:10.1186/gb-2013-14-4-r36.
- R Development Core Team. R: A language and environment for statistical computing. R foundation for statistical computing, Vienna, Austria; 2011. http://www.R-project.org/.
- Gentleman RC, Carey VJ, Bates DM, Bolstad B, Dettling M, Dudoit S, Ellis B, Gautier L, Ge Y, Gentry J, et al. Bioconductor: open software development for computational biology and bioinformatics. Genome Biol. 2004;5:R80. doi:10.1186/gb-2004-5-10-r80.
- Lawrence M, Huber W, Pagès H, Aboyoun P, Carlson M, Gentleman R, Morgan MT, Carey VJ. Software for computing and annotating genomic ranges. PLoS Comput Biol. 2013;9:e1003118. doi:10.1371/journal.pcbi.1003118.
- Love MI, Huber W, Anders S. Moderated estimation of fold change and dispersion for RNA-seq data with DESeq2. Genome Biol. 2014;15:550. doi:10.1186/s13059-014-0550-8.
- Benjamini Y, Hochberg Y. Controlling the false discovery rate: a practical and powerful approach to multiple testing. J R Stat Soc Ser B. 1995;57:289–300.
- Wickham H. ggplot2: elegant graphics for data analysis. New York, NY: Springer; 2009.