
ABSTRACT
Suppression of immune reactivity by increased expression of co-inhibitory receptors has been discussed as a major reason as to why the immune system fails to control tumor development. Elucidating the co-inhibitory expression pattern of tumor-infiltrating lymphocytes in different cancer types will help to develop future treatment strategies. We characterized markers reflecting and affecting T-cell functionality by flow cytometry on lymphocytes isolated from blood, ascites and tumor from advanced ovarian cancer patients (n = 35). Significantly higher proportions of CD4+ and CD8+ T-cells expressed co-inhibitory receptors LAG-3, PD-1 and TIM-3 in tumor and ascites compared to blood. Co-expression was predominantly observed among intratumoral CD8+ T-cells and the most common combination was PD-1 and TIM-3. Analysis of 26 soluble factors revealed highest concentrations of IP-10 and MCP-1 in both ascites and tumor. Correlating these results with clinical outcome revealed the proportion of CD8+ T-cells without expression of LAG-3, PD-1 and TIM-3 to be beneficial for overall survival. In total we identified eight immune-related risk factors associated with reduced survival. Ex vivo activation showed tumor-derived CD4+ and CD8+ T-cells to be functionally active, assessed by the production of IFN-γ, IL-2, TNF-α, IL-17 and CD107a. Blocking the PD-1 receptor resulted in significantly increased release of IFN-γ suggesting potential reinvigoration. The ovarian tumor environment exhibits an inflammatory milieu with abundant presence of infiltrating immune cells expressing inhibitory checkpoints. Importantly, we found subsets of CD8+ T-cells with double and triple expression of co-inhibitory receptors, supporting the need for multiple checkpoint-targeting agents to overcome T-cell dysfunction in ovarian cancer.
Introduction
Ovarian cancer is the fifth most common cancer type leading to death among women.Citation1 The majority of patients are diagnosed at an advanced stage (III-IV) due to the late onset of symptoms and the 5-year relative survival for these patients is only 29%.Citation1 Patients with advanced disease commonly develop an accumulation of ascites fluid in the peritoneal cavity, facilitating the dissemination of tumor cells within the abdomen. Standard treatment includes tumor debulking to surgically reduce tumor volume, followed by platinum-based chemotherapy. Despite improvements in the treatment of ovarian cancer, the majority of patients will relapseCitation2 and there is a need for better treatments to improve the outcome.
In ovarian cancer, increased infiltration of tumor-infiltrating lymphocytes (TILs) and more specifically CD8+ T-cells, has been correlated to improved clinical outcome.Citation3–Citation7 However, the mere presence of TILs does not necessarily ensure an active anti-tumor immune response. Due to immune escape mechanisms, tumor cells can alter the extent of infiltration as well as phenotype and functionality of TILs either directly or through the tumor microenvironment. Persistent exposure to antigen, presence of suppressive immune subsets and inflammatory components can further drive T-cells into a state of exhaustion with resulting loss of functionality.Citation8 Exhausted T-cells frequently express multiple co-inhibitory receptors (such as LAG-3, PD-1, TIM-3 and CTLA-4), and with tumor cells or suppressive immune cells commonly expressing the ligands, this further limits the ability of T-cells to respond and limit tumor progression.Citation9
Importantly, it has been shown that the exhausted, dysfunctional state does not have to be permanent. In recent years, immunotherapeutic strategies such as checkpoint blockade have been developed to reinvigorate T-cells by blocking the interaction between co-inhibitory receptors and their ligands, thereby restoring anti-tumor immunity. The introduction of checkpoint inhibitors in a clinical setting, such as anti-CTLA-4 and anti-PD-1, has shown promising results in many different cancer types and the list of approved indications keeps growing.Citation10 A recent phase III study comparing monotherapy of anti-CTLA-4 with anti-PD-1 showed superiority of the latter in prolonging patient overall survival.Citation11 However, far from all patients show durable responses and combining different checkpoint blockers has become an attractive strategy. Combination treatment has improved outcome compared to monotherapy but at the cost of increased treatment-related toxicities.Citation12,Citation13 It is clear that much remains to be explored regarding identification of targets, treatment modality, cancer types and benefitting patient groups to further improve the use of checkpoint blockade. Limited results have been published on the use of checkpoint inhibitors in ovarian cancer, two studiesCitation14,Citation15 have reported approximately 15% overall response rate but there are many active clinical trials from which the results will be published in upcoming years.
Detailed ex vivo characterization of the phenotype of TILs in ovarian cancer could help to identify which immunotherapeutic approaches could be options for ovarian cancer. By comparing the phenotype of immune cells from different sites within the same patient, improved knowledge can be obtained regarding tumor-immune cell interactions. Due to its important role in ovarian cancer, ascites may reflect these interactions by mirroring both the tumor environment and the immune system as it contains both tumor cells and immunological components such as immune cells, cytokines and chemokines.Citation7 Ovarian cancer rarely disseminates in blood,Citation16 making phenotypic comparisons between peripheral blood lymphocytes (PBLs), tumor-associated lymphocytes (TALs) from ascites and TILs from tumor tissue valuable.
In the current study, we profiled the immune composition and phenotype, with primary focus on co-inhibitory and co-stimulatory receptors on T-cells isolated from blood, ascites and tumor tissue from patients diagnosed with advanced ovarian cancer. Our findings demonstrate an active inflammatory tumor environment with abundance of co-inhibitory checkpoints and the identification of eight immune-related risk factors in ascites and tumor tissue associated with a reduced survival.
Results
General immune cell subset composition in blood, ascites and ovarian tumor tissue
We first examined the presence of the main immune cell subsets to get an overview of the general immune cell composition in blood, ascites and tumor tissue samples obtained from 35 ovarian cancer patients (). Patient characteristics are presented in . The proportion of total CD3+ T-cells was similar in all three sample types, however, they were of different subtypes (). TILs had a higher proportion of CD8+ T-cells (median 51.6%) than observed in PBLs (23.9%)(-B). The majority of ascites samples had similar proportions of CD4+ and CD8+ T-cells (46.5% and 44.5% respectively). The T-cell memory phenotype also differed between the sample types, with naïve memory T-cells (CCR7+ CD45RO-) being the most abundant memory subset in blood (43.8%) and least abundant in tumor (6.4%)(,C). The opposite was found for effector memory T-cells (CCR7-CD45RO+) (14.4% of blood-derived T-cells and 53.1% of tumor-derived T-cells). Again, ascites showed a more equal distribution of the different memory phenotypes. Maturation of CD4+ and CD8+ T-cells independently can be seen for all sample types in Fig. S1A-C. Majority of both CD4+ and CD8+ T-cells in tumor tissue had an effector memory phenotype (Fig. S1A-C).
Table 1. Characteristics of ovarian cancer patients (n = 35).
Figure 1. Characterization of general immune cell composition in peripheral blood (n = 35), ascites (n = 30) and tumor tissue (n = 35) of ovarian cancer patients. (A) Median proportion of CD3+ and CD3- cells (gated from lymphocytes), CD4+ and CD8+ T-cells (gated from CD3+ T-cells), and memory/maturation stages of total T-cells (gated from CD3+ T-cells): TN (naïve), TCM (central memory), TEM (effector memory), and TTD (terminally differentiated). Results from Friedman test are presented for each row. All individual values are shown for (B) CD4+ and CD8+ T-cells; (C) maturation stages of total T-cells; (D) γδ T-cells; E) regulatory T-cells (Treg, defined as CD4+/CD25highCD127-/low); (F) NK-cells and B-cells; and (G) CD14+ monocytes; myeloid marker CD33 and co-expression of CD14/CD33. (H) Representative plots from all presented populations are shown from patient 45, values in plots represent percentages. Significant differences were obtained by Wilcoxon signed rank test followed by Bonferroni correction. Median values and interquartile ranges are plotted in graphs. Significance levels were set to p < 0.05 (*), p < 0.01 (**), and p < 0.001 (***).
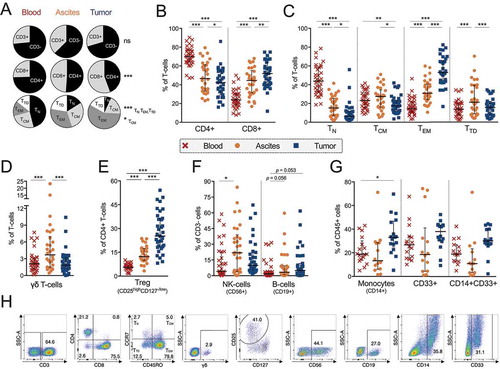
Similar percentages of γδ T-cells were found in tumor and blood (1.8% and 2.1%), but there was an increased percentage observed in ascites (3.7%) compared to both other sample types (). The majority of γδ T-cells lacked expression of CD4 and CD8, while a subset expressed either CD4 or CD8 (Fig. S1D). There were significantly more CD4+ γδ T-cells in tumor tissue (13.1% of total γδ T-cells) compared to ascites (3.6%)(Fig. S1D). Looking into proportions of potential regulatory T-cells (Tregs, defined as CD4+/CD25highCD127−/low) revealed twice as many among TALs (12.3%) and approximately five fold among TILs (25.2%) compared to PBLs (5.6%)().
Analyzing other immune cell types revealed an increased percentage of NK-cells in ascites (21.9%) compared to blood (4.1%), while there was a strong trend towards an increased proportion of B-cells in TILs (5.0%) and TALs (3.4%) compared to PBLs (1.8%) (). Monocytes were more prevalent in tumor tissue (33.1%) compared to blood (18.8%) and a large proportion of this subset expressed myeloid marker CD33 (). This CD14+CD33+ subset could represent myeloid-derived suppressor cells, however more markers and functional experiments are needed to confirm this. We conclude that the infiltration of cells in both ascites and tumor consists of a broad variety of different immune cell types. The phenotypes of CD4+ and CD8+ T-cells were studied in more detail.
Co-inhibitory receptor profiling of t-cells
Due to advances in recent years regarding checkpoint blockade, the four co-inhibitory receptors LAG-3, PD-1, TIM-3 and CTLA-4 were characterized on CD4+ and CD8+ T-cells (). PD-1 and TIM-3 were most commonly expressed by both CD4+ and CD8+ T-cells in tumor tissue (53.3% PD-1+ and 20.2% TIM-3+ of CD8+ T-cells; 41.8% PD-1+ and 15.9% TIM-3+ of CD4+ T-cells). LAG-3, PD-1 and TIM-3 were expressed primarily by CD8+ T-cells but also to a large degree by CD4+ T-cells in both tumor and ascites (). Expression of all co-inhibitory receptors was significantly more frequent among TALs and TILs compared to PBLs for both CD4+ and CD8+ T-cells. The only exception was CTLA-4 on CD8+ T-cells where no significant difference was found (). Out of the four analyzed checkpoints, CTLA-4 was the co-inhibitory receptor found to be expressed by the lowest proportion of T-cells in all sample types (with the highest proportion observed among tumor-derived CD4+ T-cells, of which a median of 3.2% expressed CTLA-4).
Figure 2. Co-inhibitory receptor profiling on CD4+ and CD8+ T-cells isolated from peripheral blood (n = 35), ascites (n = 30) and tumor tissue (n = 35) of ovarian cancer patients. (A) Proportion of CD4+ (left) or CD8+ (right) T-cells expressing co-inhibitory receptors LAG-3, PD-1, TIM-3 or CTLA-4. Representative plots of LAG-3, PD-1, TIM-3 and CTLA-4 in tumor tissue (gated from total CD3+ T-cells) from patient 27 are shown. (B) Correlations between CD4+ (left) and CD8+ (right) T-cells expressing LAG-3, PD-1 or TIM-3 in ascites and tumor tissue. (C) Boolean gating analysis was performed on LAG-3, PD-1 and TIM-3. Graphs show number of co-inhibitory receptors expressed on CD4+ T-cells (left) and CD8+ T-cells (right). Dashed vertical lines in graphs are plotted to emphasize changes in axis. (D) Median values of total number of co-inhibitory receptors expressed by CD4+ or CD8+ T-cells (by Boolean gating). (E) Co-expression of LAG-3, PD-1 and/or TIM-3 in ascites (left) and tumor tissue (right). Significant differences were obtained by Wilcoxon signed rank test followed by Bonferroni correction. Spearman’s rank coefficient was used for correlation analysis and non-linear regression was also applied. Median values and interquartile ranges are plotted in graphs. Significance levels were set to p < 0.05 (*), p < 0.01 (**), and p < 0.001 (***).
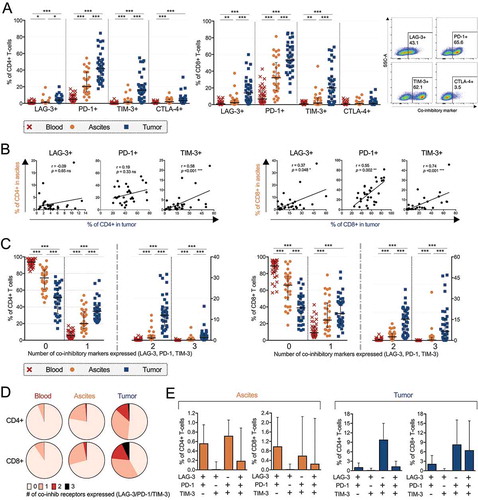
Next, we investigated how ascites fluid reflects the tumor tissue environment. To this end, the percentage of T-cells expressing co-inhibitory receptors in tumor tissue and ascites was compared. We observed a significant positive correlation between ascites and tumor tissue for CD8+ T-cells expressing LAG-3, PD-1 or TIM-3 and also CD4+ T-cells expressing TIM-3 (). There was no correlation for LAG-3+ or PD-1+ CD4+ T-cells () or for CTLA-4 in either T-cell subset (data not shown).
To explore simultaneous expression of multiple co-inhibitory receptors, we used Boolean gating to assess the different co-inhibitory receptor combinations. We analyzed whether CD4+ or CD8+ T-cells had absent, single, double or triple expression of LAG-3, PD-1 and TIM-3. CTLA-4 was not included in this assessment due to not being co-stained with the other markers. The proportion of T-cells with absent expression of co-inhibitory receptors was highest in blood (93.7% of CD4+ T-cells and 89.7% of CD8+ T-cells) compared to ascites (72.0% of CD4+ T-cells and 65.4 % of CD8+ T-cells) and tumor tissue (51.2% of CD4+ T-cells and 38.9% in CD8+ T-cells) (-D).
In contrast, we found significantly increased proportions of CD4+ and CD8+ T-cells expressing multiple co-inhibitory receptors in TILs and TALs compared to PBLs (-D). Double and triple co-inhibitory receptor expression was predominantly observed among CD8+ T-cells isolated from tumor tissue (-D). Median 21.8% of tumor-isolated CD8+ T-cells were expressing multiple (≥ 2 co-inhibitory receptors) compared to 2.9% of ascites-isolated CD8+ T-cells (and 0.3% of blood-derived CD8+ T-cells). Among CD4+ T-cells, 13.3% of tumor-isolated cells had multiple expression (≥ 2 co-inhibitory receptors) compared to 1.3% of ascites-isolated CD4+ T-cells and 0.2% of blood-isolated CD4+ T-cells. The limited multiple expression in ascites was still significantly increased compared to the absent expression in blood. Among TALs, the limited double expression consisted of the equally common combinations PD-1&TIM-3 and PD-1&LAG-3 (). Among TILs, the most common double expression combination was PD-1&TIM-3 for both CD4+ and CD8+ T-cells (). Expression of LAG-3&TIM-3 without PD-1 was absent in both ascites and tumor tissue (). There was a positive correlation between the proportion of CD8+ T-cells expressing none, single, double and triple co-inhibitory receptor types in ascites and tumor tissue (Fig. S2A). There was no correlation for any numerical combination of co-inhibitory receptors on CD4+ T-cells in ascites and tumor tissue (data not shown). LAG-3, PD-1 and TIM-3 were more commonly expressed by CCR7- (effector memory and terminally differentiated) T-cells, both for CD4+ and CD8+ subsets (Fig. S3). In contrast, CTLA-4 was expressed predominantly by CCR7+ (naïve and central memory) T-cells (Fig. S3).
Next, we looked at the expression of CD127 on CD4+ and CD8+ T-cells expressing LAG-3, PD-1 or TIM-3 (Fig. S2B-C). CD127 is part of the IL-7 receptor (IL-7Rα) and can reflect the activation state of T-cells as they tend to down regulate this receptor in response to activation signals.Citation17 The proportion of CD127-expressing T-cells was significantly decreased among TILs compared to PBLs (for both CD4+ and CD8+ T-cells, one example being 15.7% PD-1+ CD127+ of tumor-isolated CD8+ T-cells compared to 48.6% in blood). TALs also had a significantly decreased proportion of T-cells expressing CD127 in all populations except PD-1+ CD4+ T-cells compared to PBLs but not as large decrease as observed in tumor (for example 30.8% PD-1+ CD127+ CD8+ T-cells) (Fig. S2B-C).
We conclude that there is a large presence of T-cells, in particularly CD8+ T-cells, expressing co-inhibitory receptors in tumor tissue of ovarian cancer patients. A majority of these express co-inhibitory receptor PD-1 and a subset co-express TIM-3 and/or LAG-3. In ascites fluid, there is also a large proportion of T-cells expressing PD-1 but the co-expression of additional co-inhibitory receptors is more limited than observed in tumor but nonetheless more prevalent than in peripheral blood.
Activation and co-stimulatory receptor profiling of t-cells
We wanted to further characterize CD4+ and CD8+ T-cell expression of activation markers, co-stimulatory receptors and cytokine receptors to obtain further insight into their phenotype (). Activation markers CD25 (IL-2Rα) and HLA-DR were expressed by a larger proportion of CD4+ T-cells in both ascites (25.8% and 14.8% respectively) and tumor (38.5% CD25+ and 42.8% HLA-DR+) compared to blood (19.2% CD25+ and 3.4% HLA-DR+)(). The same pattern was observed for CD8+ T-cells expressing HLA-DR. In contrast, CD25 was expressed by a larger proportion of CD8+ PBLs compared to TALs albeit at low frequencies ().
Figure 3. Characterization of activation markers, co-stimulatory receptors and cytokine receptors on CD4+ and CD8+ T-cells isolated from peripheral blood (n = 35), ascites (n = 30) and tumor tissue (n = 35) of ovarian cancer patients. Proportion of (A) CD4+ and (B) CD8+ T-cells expressing various markers. Stainings for HLA-DR and CD103 are presented with fewer samples due to being added later in the study panel (n = 8 for blood and tumor, n = 7 for ascites). (C) Representative histograms for each marker is presented from patient 45 (gated from total T-cells), isotype controls were made on cells isolated from tumor. Significant differences were obtained by Wilcoxon signed rank test followed by Bonferroni correction. Median values and interquartile ranges are plotted in graphs. Significance levels were set to p < 0.05 (*), p < 0.01 (**), and p < 0.001 (***).
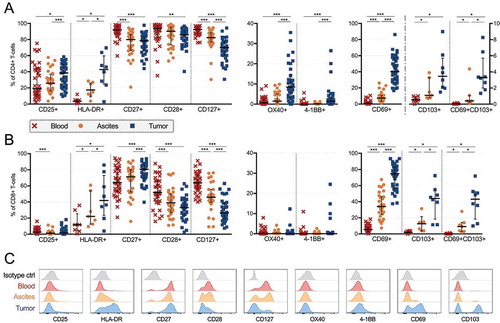
Co-stimulatory receptors CD27, CD28 and IL-7Rα CD127 were expressed by a majority of CD4+ T-cells in all sample types. However, significantly lower proportions of all three were observed among TILs (78.5% CD27+, 86.0% CD28+, 70.0% CD127+) compared to PBLs (91.9% CD27+, 93.9% CD28+, 92.3% CD127+). The same was observed for CD8+ T-cells expressing CD127 or CD28. Co-stimulatory receptors OX40 (CD134) and 4-1BB (CD137) were primarily expressed by CD4+ T-cells in tumor tissue (8.5% and 1.4% respectively), at significantly higher proportions compared to both ascites (1.5% OX40+ and 0.2% 4-1BB+) and blood (0.6% OX40+ and 0.0% 4-1BB+) ().
We found large differences in the proportion of T-cells (both CD4+ and CD8+) expressing CD69 across the different sampling origins (). CD69 was expressed by a median of 40.2% of CD4+ T-cells isolated from tumor compared to 7.4% in ascites and 0.8% in blood. Among CD8+ T-cells, equivalent proportions were 74.4% in tumor, 34.2% in ascites and 5.6% in blood. CD69 is traditionally considered as an early activation marker, however, expression in tissues has been recognized as a marker for tissue-resident memory T-cells.Citation18 To explore this subset further, we included another marker for tissue residency, CD103, a subunit of the αE/β7 integrin which helps to retain expressing cells to epithelium.Citation19 In the limited sample numbers (n = 8), we found co-expression of CD69 and CD103 to be common among tumor tissue-derived CD8+ T-cells (median 44.0%) but limited among CD4+ T-cells (3.5%), consistent with previous studies.Citation19–Citation22 T-cells expressing CD103 was limited in blood (0.6% of CD4+ T-cells and 2.1% of CD8+ T-cells), and less abundant in ascites (1.1% of CD4+ T-cells and 14.3% of CD8+ T-cells) compared to tumor tissue (-B).
Cytokine and chemokine profiling of peripheral blood, ascites and tumor tissue
Next, we analyzed the content of soluble factors in plasma, ascites fluid and tumor supernatants collected during the processing with multiplex immunoassay (Luminex). Nine soluble factors were excluded (IL-2, IL-3, IL-4, IL-5, IL-12(p70), IL-13, IL-17A, IFN-γ, and TNF-β) due to having a median below the detection limit (< 3.2 pg/mL) in all three sample types. All soluble factors with a median above the detection limit in tumor supernatants are presented in . The most abundant cytokine in both ascites and tumor tissue was interferon-gamma inducible protein 10 (IP-10 also called CXCL10) and, for many samples, the upper detection limit was reached. IP-10 was also the cytokine with the highest median concentration in blood, however at much lower levels (). Interleukin (IL)-6, IL-8 (CXCL8) and monocyte chemoattractant protein 1 (MCP-1, also called CCL2) were also present in high concentrations in both ascites fluid and tumor supernatant ().
Table 2. Cytokine and chemokine profiling by multiplex immunoassay on ascites supernatants, blood plasma and tumor tissue supernatants.
Comparing ascites and peripheral blood revealed significant differences in levels of 13 cytokines (, ). Eotaxin (CCL11) was significantly lower in ascites compared to blood. Remaining 12 cytokines were significantly elevated in ascites compared to blood (GM-CSF, IL-15, IL-1α, MIP-1α/CCL3, IL-12(p40), TNF-α, G-CSF, IL-8/CXCL8, IL-10, MCP-1/CCL2, IL-6 and IP-10/CXCL10).
Figure 4. Cytokine and chemokine profiling by multiplex immunoassay on blood plasma (n = 32), ascites fluid (n = 28) and tumor tissue supernatant (n = 32) from ovarian cancer patients. (A) Significant differences between ascites and blood. Soluble factors increased in ascites are shown to the left while the only soluble which was decreased in concentration in ascites compared to blood is presented to the right. (B) All analytes which had a median above detection limit (> 3.2 pg/mL) in tumor supernatants are plotted with equivalent analyte concentrations found in ascites. Only significant differences where concentrations were elevated in tumor were specified (left part of graph) due to dilution of tumor supernatants. Statistical comparisons were made using Wilcoxon signed rank test. Median values and interquartile ranges are plotted in graphs. Significance levels were set to p < 0.05 (*), p < 0.01 (**), and p < 0.001 (***).
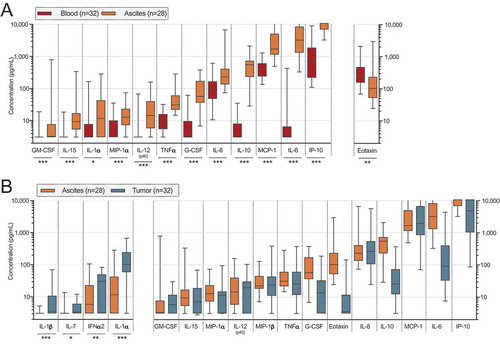
In order to obtain supernatants to reflect the tumor tissue cytokine and chemokine content, the tissue was placed in PBS during processing. Despite this external dilution, we felt it was relevant to compare with ascites to gain insight into the secretion and cytokine profile within tumor tissue. We performed univariate analysis and only plotted statistical significances where the concentration was increased in tumor compared to ascites (IL-1α, IL-7, IL-1β, IFNα2). Other differences are difficult to assess as we cannot be sure if they are due to dilution or not ().
Clinical parameters and survival
Due to the observed heterogeneity with the analyzed surface markers and soluble factors, we next investigated if clinical parameters and survival could be correlated to these data. We compared all the results from the phenotyping and multiplex immunoassay based on the clinical groupings provided below and only significant differences are presented.
FIGO stage
Patients at the most advanced stage, stage IV (n = 11), had an increased proportion of total T-cells in both ascites (57.6% CD3+ of lymphocytes) and tumor (49.3%) compared to patients at stage III (n = 24) (22.2% CD3+ of TALs and 23.4% CD3+ of TILs). A corresponding significant decrease of CD3- cells in both sample types was observed ().
Figure 5. Clinical parameters and differences in proportion of cell subsets and concentrations of soluble factors in ascites (left) and tumor tissue (right) of ovarian cancer patients. Patients were grouped according to (A) FIGO stage (stage III n = 24; IV n = 11); (B) remaining residual tumor after surgery (optimal n = 20; suboptimal n = 15); (C) pre-surgery serum (s-) measurement of cancer antigen (CA)-125 (≤ median 911 IU/mL n = 18; > 911 IU/mL n = 17). Groups were compared using Mann Whitney U-test. Box plots show median values, interquartile ranges and min-max values. Significance levels were set to p < 0.05 (*), p < 0.01 (**), and p < 0.001 (***). Soluble factors distinguished by filled pattern.
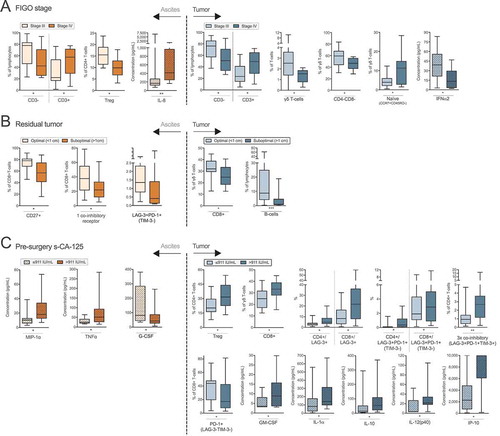
Interestingly, TALs of stage IV patients had a reduced proportion of potential Tregs (9.9% compared to 15.5%). Lower frequencies of γδ T-cells were found in TILs of stage IV patients (1.5%) compared to those at stage III (2.5%)(). This was observed for CD4-CD8- γδ T-cells, but there were no differences between CD4+ or CD8+ γδ T-cells (data not shown). Lastly, the proportion of naïve γδ T-cells (CCR7+CD45RO-) appeared to be increased among stage IV patients compared to those with stage III (11.3% vs. 4.0% naïve γδ T-cells). Investigating soluble factors revealed higher levels of IL-8 in ascites of stage IV patients (169 pg/mL) and lower levels of IFNα2 in tumor supernatants (13.5 pg/mL) compared to stage III patients (413 pg/mL ascites IL-8 and 38.9 pg/mL tumor IFNα2)().
Residual tumor burden after surgery
Patients with a suboptimal surgery outcome (> 1 cm residual tumor, n = 20) had a decreased frequency of ascites-isolated CD8+ T-cells expressing CD27 compared to those with an optimal outcome (< 1 cm residual tumor, 56.9% vs. 78.0%). Among ascites-derived CD8+ T-cells, there were decreased proportions of cells with single co-inhibitory receptor expression (either LAG-3, PD-1 or TIM-3) (22.0%) and co-expression of LAG-3&PD-1 (without TIM-3) (0.4%) in patients with suboptimal surgical outcome compared to those with optimal surgerical outcome (37.7% and 1.4% respectively).
In the TIL population, patients who had a suboptimal tumor debulking had a reduced proportion of CD8+ γδ T-cells (24.8%) and B-cells (1.0%) at the tumor site compared to patients with optimal surgical outcome (n = 15) (32.0% CD8+ γδ T-cells and 8.8% B-cells) ().
Pre-surgery levels of CA-125 in serum
Increased levels of cancer antigen-125 (CA-125) in blood has been linked to reduced progression-free survival and overall survival in ovarian cancer.Citation23,Citation24 Normal reference value is < 35 IU/mLCitation23 and all patients in our cohort had abnormal levels (). We grouped the patients based on the cohort median, 911 IU/mL, creating a high and low group.
No cellular subsets in ascites correlated to the levels of CA-125. However, among TILs, the CA-125high group had an increased proportion of potential Tregs (31.6%) and CD8+ γδ T-cells (33.3%) compared to CA-125low patients (20.4% Tregs and 25.0% CD8+ γδ T-cells) (). CA-125high patients also had an increased proportion of both CD4+ and CD8+ T-cells expressing LAG-3 (4.9% and 21.7%) compared to the CA-125low group (3.0% LAG3+ CD4+ and 8.3% LAG-3+ CD8+ T-cells) (). Similarly, both CD4+ and CD8+ T-cells co-expressing LAG-3&PD-1 (but not TIM-3) in tumor were increased among CA-125high patients (0.4% and 2.9% respectively) compared to CA-125low patients (0.1% and 1.9%). The same was found for CD4+ T-cells co-expressing all three co-inhibitory receptors LAG-3, PD-1 and TIM-3 in tumor (2.7% compared to 0.9%). In contrast, the proportion of tumor-isolated CD8+ T-cells expressing only PD-1 (with absent expression of LAG-3 and TIM-3) was decreased in the CA-125high group (17.2% vs 43.9%).
Investigating the levels of soluble factors and measurement of CA-125 revealed several significant findings in both ascites and tumor. The CA-125high group had increased levels of MIP-1α and TNF-α in ascites, and GM-CSF, IL-1α, IL-10, IL-12(p40) and IP-10 in tumor supernatant, compared to the CA-125low group. In contrast, G-CSF in ascites was found to be significantly lower in the CA-125high group ().
Impact on survival
We analyzed if clinical parameters were prognostic for the overall survival of the patients in our cohort. Both according to literatureCitation24-Citation26 and our analysis, we found residual tumor burden after surgery to be associated to survival. Analysis revealed a better prognosis for patients who had an optimal surgical outcome compared to patients who had a suboptimal result (p = 0.017, median survival 39.6 months compared to 16.0 months) (). Other clinical factors (age, FIGO stage, WHO performance score, pre-surgery blood measurements of CA-125, albumin and white blood count) were not found to be associated with survival in our cohort. The overall survival of the complete cohort can be seen in Fig. S4.
Figure 6. Identification of risk factors in ascites and tumor tissue for reduced survival of ovarian cancer patients. Prognosis for patients was affected by (A) residual tumor burden after surgery. Also, survival was correlated to eight immune-related factors (B-I). Increased concentrations of soluble (B) IFNα2, (C) MIP-1α and (D) MIP-1β in ascites were correlated to a worse prognosis for patients in our cohort. Also, the proportion of ascites-isolated (E) CD8+ T-cells expressing only TIM-3 (and being negative for LAG-3 and PD-1); (F) CD4+ γδ T-cells; and tumor tissue-derived (G) CD4+ γδ T-cells; (H) CD8+ T-cells without expression of LAG-3, PD-1 or TIM-3; I) TIM-3+ CD8+ T-cells expressing CD127 were identified to be significantly correlated with survival. Groups were made based on median values of the complete cohort and significances were obtained by log-rank test. Differences in number of patients are due to full profiling not being performed for all patients. Significance levels were set to p < 0.05 (*), p < 0.01 (**), and p < 0.001 (***).
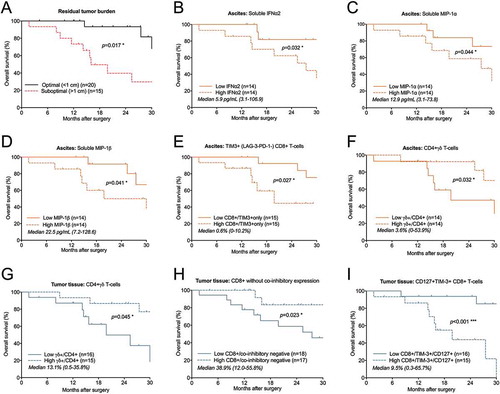
In ascites fluid, higher concentrations of soluble factors IFNα2, MIP-1α and MIP-1β were associated with a decreased survival (> 5.9, 12.9 and 22.5 pg/mL respectively; p = 0.032, p = 0.044 and p = 0.041) (-D). Also, ascites-isolated CD8+ T-cells expressing only TIM-3 (with absent expression of LAG-3 and PD-1) had a prognostic impact. A larger proportion of this subset (> 0.6%) in ascites was associated with reduced survival (). Interestingly, the proportion of γδ T-cells expressing CD4 were prognostic for outcome in both ascites and tumor tissue, where a decreased proportion (< 3.6% in ascites and < 13.1% in tumor) correlated to a reduced survival (-G).
Numerous studies have found TIL populations to be correlated with survival in ovarian cancer. Interestingly, patients with a higher presence of intratumoral CD8+ T-cells without co-inhibitory receptor expression (absent expression of LAG-3, PD-1 and TIM-3) had significantly increased survival compared to patients who had a lower proportion of this subset (based on median 38.9%, p = 0.023)(). Also, patients with higher proportion of TIM-3+ CD8+ T-cells expressing CD127 (> 9.5%) were found to have a significantly reduced survival compared to those who had a lower proportion of this subset (< 9.5%, p < 0.001) (). At 30 months, 85% of patients with less than 9.5% of this subset were still alive compared to 0% with higher proportion.
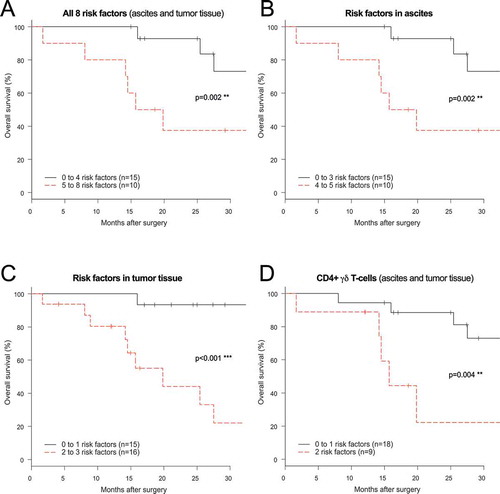
Combination of risk factors unfavorable for outcome
After identifying a total of eight immune-related risk factors for reduced survival in ascites and tumor tissue of ovarian cancer patients, the factors were clustered to see if combinations would be significantly worse for outcome (). Risk factor analysis revealed that patients with a high number of soluble or cellular risk factors (5–8) had a significantly reduced survival compared to those with lower number of risk factors (0–4) (p = 0.002) (). Analysis of risk factors according to origin (ascites and tumor tissue separately) also showed a significantly reduced survival for patients with a higher number of risk factors for both sample types (-C). Since lower proportion of CD4+ γδ T-cells was associated to a reduced survival in both ascites and tumor tissue, we combined these two risk factors and found a significantly reduced survival for patients with lower proportions of this subset in both sample origin types compared to those with only one (p = 0.004) ().
Figure 7. Risk factor analysis based on prognostic immune-related findings in ascites and tumor tissue of ovarian cancer patients. Risk factors were grouped using: (A) all eight immune-related risk factors (= high levels of soluble IFNα2/MIP-1α/MIP-1β in ascites, high % TIM-3+(PD-1-LAG-3-) CD8+ T-cells in ascites, low % CD4+ γδ T-cells in ascites and tumor, low % tumor-isolated CD8+ co-inhibitory negative T-cells, high % tumor-isolated CD127+TIM3+ CD8+ T-cells; (B) the five (three soluble and two cellular) ascites-related risk factors; (C) the three cellular tumor tissue-related risk factors; (D) and CD4+ γδ T-cells in ascites and tumor tissue. Low and high indicate below or above median value. Risk factor analysis was performed using log-rank test and survival curves were plotted using Kaplan-Meier. Significance levels were set to p < 0.05 (*), p < 0.01 (**), and p < 0.001 (***).
Assessment of functionality of tils
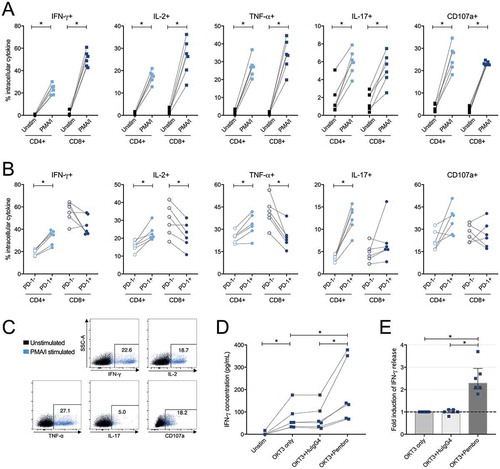
To explore the functional capacity of tumor-derived T-cells, isolated TILs from six patients were stimulated with phorbol 12-myristate 13-acetate (PMA) and ionomycin for 6 hours (-C). Analysis of intracellular production of IFN-γ, IL-2, TNF-α, IL-17 and CD107a revealed that both CD4+ and CD8+ T-cells were functionally active ex vivo upon stimulation with PMA/ionomycin compared to an untreated control (p = 0.031 for all, ). However, when assessing the functionality based on expression of PD-1, opposing patterns were observed for CD4+ and CD8+ T-cells. IFN-γ, IL-2, TNF-α and IL-17 were produced by a larger proportion of PD-1+ CD4+ T-cells as compared to the PD-1- counterparts (median 35.5% vs. 20.2% IFN-γ+; 21.6% vs. 16.0% IL-2+; 32.8% vs. 25.4% TNF-α; 13.0% vs. 3.7% IL-17+ for PD-1+ and PD-1- CD4+ T-cells respectively) (). Among CD8+ T-cells, the opposite was observed for IL-2 and TNF-α, which were produced by a significantly lower proportion of cells if PD-1 was expressed extracellularly compared to absent expression (21.8% vs. 29.7% IL-2+ and 23.7% vs. 40.9% TNF-α+ for PD-1+ and PD-1- CD8+ T-cells, respectively) (). No differences were found regarding intracellular production of degranulation marker CD107a in PD-1+ or PD-1- CD4+ or CD8+ T-cells ().
Figure 8. Intracellular cytokine production in CD4+ and CD8+ tumor-derived T-cells upon stimulation with phorbol 12-myristate 13-acetate/ionomycin (PMA/I) and release of IFN-γ after stimulation with anti-CD3 and PD-1 blockade. (A) Tumor-infiltrating lymphocytes isolated from tumor tissue from six ovarian cancer patients were assessed at two conditions; unstimulated (unstim) and stimulated with PMA/I for 6 hours. Intracellular cytokine staining was performed for IFN-γ, IL-2, TNF-α, IL-17 and CD107a on total CD4+ or CD8+ T-cells to assess functional capacity ex vivo. (B) Stimulated CD4+ and CD8+ T-cells were divided based on being PD-1- or PD-1+ and the production of the different analytes was thereafter analyzed. (C) Representative plots from intracellular cytokine staining on total CD4+ T-cells stimulated with PMA/I for 6 hours from patient 33. (D) Tumor-derived T-cells (n = 6) were stimulated with anti-CD3 (OKT3) and PD-1-blocking antibody pembrolizumab (pembro) or negative control (human IgG4, HuIgG4) for 48 hours. The release of IFN-γ was analyzed in the supernatants by ELISA. The data has been normalized to reflect the same number of T-cells and the concentration refers to per 500,000 T-cells. Dashed lines connects the same patient. (E) Fold increase of released IFN-γ by addition of PD-1 blocking antibody (pembro) or negative control (HuIgG4) relative to when adding only anti-CD3. Significant differences were obtained by Wilcoxon signed rank test and significance levels were set to p < 0.05 (*), p < 0.01 (**), and p < 0.001 (***).
Reinvigoration of TIL response using PD-1 blockade
To explore the effect on functionality by blocking the most abundantly expressed co-inhibitory receptor PD-1, TILs isolated from six patients were stimulated with anti-CD3 and PD-1-targeting antibody pembrolizumab (Keytruda®, Merck & Co., Inc) or a negative control (human IgG4) for 48 hours. The results showed a significantly increased release of IFN-γ when the PD-1 blocking antibody was present (-E). The relative fold induction of IFN-γ when adding pembrolizumab was median 2.3x higher compared to the stimulated control consisting of only anti-CD3 (in absolute concentrations median 136 pg/mL compared to 53.1 pg/mL, p = 0.031) (-E). There was no fold induction of IFN-γ when the negative control was present (in absolute concentration median 54.7 pg/mL, comparable to the condition with only anti-CD3, 53.1 pg/mL)().
Discussion
Increased infiltration of TILs has been associated with favorable clinical outcome in many cancer types,Citation27–Citation29 including ovarian cancer.Citation3–Citation6 However, the composition and phenotype of TILs play an important role for their functionality and anti-tumor responses. Detailed characterization of TILs is necessary for the development of future treatment strategies, in particular profiling of co-inhibitory receptors as checkpoint blockade continues to be a promising treatment for a wide range of cancer types at advanced stage.
The current study provides a detailed co-inhibitory receptor mapping including expression and co-expression of major co-inhibitory receptors LAG-3, PD-1, TIM-3 (and CTLA-4 in single expression) in tumor tissue and ascites obtained from advanced ovarian cancer patients. We found a large proportion of tumor-infiltrating and tumor-associated CD4+ and CD8+ T-cells to express one or more of these receptors (). Double and triple expression was mostly observed in tumor tissue, particularly among CD8+ T-cells. In a recent study, up-regulation of additional co-inhibitory receptors was observed as a compensatory mechanism to single checkpoint blockade in mice bearing ovarian tumors.Citation30 In the same study, a large proportion of ascites-derived T-cells from ten ovarian cancer patients were found to express co-inhibitory receptors.Citation30 Our material and data supports the putative importance of using multiple checkpoint agents to reverse T-cell dysfunction in patients, as single checkpoint blockade might not render sufficient response due to other present or induced inhibitory mechanisms.
There was a correlation between the number of different co-inhibitory receptor types expressed on CD8+ T-cells in ascites and tumor tissue (Fig. S2). These correlations should be studied on a larger cohort of patients, as they might be useful in future individualized treatment approaches. This is especially true for CD8+ T-cells with absent expression of co-inhibitory receptors as this subset was found to be prognostic for overall survival (). Many previous studies have found increased amount of CD8+ T-cells to be favorable for the prognosis of ovarian cancer patients.Citation3–Citation7 Based on our cohort, we suggest that it is the CD8+ T-cell without co-inhibitory receptor expression that are beneficial for survival. In theory, these should not be inhibited in their effector functions the way their co-inhibitory receptor-expressing counterparts are. The reasons behind the beneficial association to outcome remains to be elucidated and whether these CD8+ T-cells somehow are able to avoid up-regulation of co-inhibitory receptors.
Numerous studies have reported gradual loss of functionality by up-regulation of co-inhibitory receptors.Citation31–Citation37 The observed common expression of co-inhibitory receptors most likely reflects the process in which gradual exhaustion results from long-term inflammation, contact with tumor cells, antigen exposure, immunosuppressive cell types and soluble factors. We assessed functional capacity by stimulating tumor-derived TILs with PMA/ionomycin and analyzed the response by production of various important cytokines and degranulation marker CD107a (). Our findings regarding a decreased proportion of PD-1+ CD8+ T-cells producing IL-2 and TNF-α compared to the PD-1- CD8+ T-cells suggests that the PD-1+ subset appear to be in an exhausted state and maintain this state ex vivo. In contrast, PD-1 expression among CD4+ T-cells was found to be associated with a higher proportion of cells producing IFN-γ, IL-2, TNF-α and IL-17. Although this was performed for a limited number of tumor samples, this suggests that these cells are more readily activated once removed from the tumor microenvironment. Importantly, we observed a potential reinvigoration of T-cell response, assessed by increased release of IFN-γ by ELISA, when adding PD-1 blocking antibody pembrolizumab to T-cells stimulated with anti-CD3 (). More extensive experiments focusing on the functionality of T-cells isolated from tumor sites and also ascites of ovarian cancer patients are warranted to confirm and explore the suggested exhaustion further and in particular continued attempts to reinvigorate TIL responses using checkpoint blocking reagents.
The proportions of CD4+ and CD8+ T-cells expressing LAG-3, PD-1 or TIM-3 and CD127+ were all reduced in ascites and tumor compared to blood (Fig. S2). This is most likely another reflection of exhaustion. Persistent antigen stimulation has been shown to cause permanent down regulation of CD127 resulting in reduced memory development and survival of T-cells.Citation38 Exhausted T-cells have been discussed to express low levels of CD127Citation9,Citation39 and CD127 has been found to be expressed to a low degree on PD-1+ TILs,Citation33 in line with our findings. Interestingly in our study, increased proportions of CD127+TIM-3+ CD8+ TILs were associated with reduced survival (). Since TIM-3-expressing CD8+ TALs were also found to be prognostic for outcome, it seems TIM-3+ TILs and TALs warrant further exploration. The role of CD127 in this context remains unclear.
In a large meta-analysis of 25 different malignancies, the prognostic associations of different immune cell types was analyzed.Citation40 Interestingly, intratumoral γδ T-cells were identified as the most favorable, significant cancer-wide prognostic immune cell population.Citation40 In our study, more specifically CD4+ γδ T-cells were identified in both ascites and tumor tissue to be beneficial for outcome (). Numerous studies have highlighted the anti-tumor properties of γδ T-cellsCitation41-Citation44 and it is clear that the role of CD4+ γδ T-cells in the context of ovarian cancer remains to be further studied.
There was a hierarchy in the proportion of T-cells expressing many of the analyzed markers, such as CD25, HLA-DR and OX40 (as well as all co-inhibitory receptors)(–). The highest frequencies were often observed among TILs, followed by TALs and then PBLs. For some markers, such as CD28 and CD127, the opposite pattern was observed and the lowest frequencies were instead found among intratumoral T-cells and highest among peripheral blood T-cells. Again, ascites-derived T-cells had a frequency between tumor and blood. Ascites fluid can be considered to be part of a diluted tumor microenvironment as tumor cells, soluble factors and immune cells move around freely in the large abdominal space. Seemingly, proximity to tumor cells and exposure to the tumor microenvironment drives and skews these changes in phenotype and composition.
Soluble factors in blood, ascites fluid and tumor tissue reflect the secretion from present cells. We found IP-10, IL-6 and MCP-1 to be present at highest concentrations in ascites fluid (), similar to a previous study.Citation7 In line with our phenotypic findings, abundance of cytokines and chemokines in both ascites and tumor suggests a highly active and inflammatory environment, affecting the composition and functions of present cells. In a previous study, virally exhausted T-cells had increased mRNA levels of chemokines MIP-1α, MIP-1β and IP-10.Citation45 In our cohort, ascites levels of IFNα2, MIP-1α and MIP-1β were found to be prognostic for the overall survival (). MIP-1α and MIP-1β are both pro-inflammatory chemokines secreted by monocytes, lymphocytes and other hematopoietic cell types.Citation46 In our study, we found increased proportions of monocytes in tumor tissue compared to blood () but were unable to analyze the presence of macrophages. Further evaluation of these populations would be of interest in a follow-up study. The secretion of the mentioned soluble factors reflect the ongoing inflammation, but why they are prognostic for outcome remains to be elucidated. The most abundant lymphokines in blood were found to be IP-10, MCP-1, IL-8 and Eotaxin. In a previous study of healthy individuals, all of these factors were found at lower levels.Citation47 The subjects of our study would need to be age-matched to healthy controls for any conclusions to be made, but it is nonetheless an interesting observation that there is an abundancy of these lymphokines in the blood of the patients in our cohort.
Our prognostic findings should be further studied with a longer follow-up and larger cohort of patients. For example, it is unsure how censored patients would have affected the results if follow-up had been longer. Furthermore, it is possible that with a longer follow-up, other subsets or soluble factors could be used to predict prognosis. The grouping of patients based on clinical parameters also revealed differences which need further confirmation. The identification of eight immune-related risk factors for reduced survival could have clinical significance in the continual search to use biomarkers to predict survival and individualize treatment. Sampling of ascites or tumor tissue at the time point of surgery to measure prognostic markers could help to guide continuing treatment.
There is currently limited data published on single and multiple expression of co-inhibitory receptors in human ovarian cancer. Knowledge guiding current and future immunotherapy approaches is highly needed. Functional studies are necessary to obtain insight into the anti-tumor reactivity of infiltrating immune cells and evaluate possible combinations of checkpoint blockade to reinvigorate TIL responses. The ultimate aim will be to enhance functionality to achieve tumor cell elimination. In this study, we provided a foundation on which additional research can build and provides a rationale for using multiple checkpoint-targeting agents in ovarian cancer.
Material and methods
Patient characteristics
This study was performed in accordance with the declaration of Helsinki and approved by the Regional Ethical Review Board of Stockholm, Sweden (2013/2161–31/2, 2016/1136–32, 2016/1631–32). A total of 35 patients with median age 64 years (range 41–78 years) undergoing primary tumor debulking for advanced epithelial ovarian, tubal or peritoneal cancer with presence of ascites were included in the study (). None of the patients received chemotherapy treatment prior to surgery/sampling. Patients were informed about the study prior to their surgery and gave their written consent at the Women’s Health Clinic at Karolinska University Hospital (Solna, Sweden). Twelve additional patients were initially enrolled but were excluded due to absent sampling (n = 6) or histological findings not suitable for the study (n = 6, including stage < III or not specified tumor type).
Median time between admission to the clinic until surgery was 20 days (range 12–45 days). After surgery, 24 patients were diagnosed as stage III and 11 patients were diagnosed as stage IV according to the Fédération Internationale de Gynécologie et d’Obstétrique (FIGO) classification system. Optimal resection (complete resection or < 1 cm of residual tumor) was achieved in 20 out of 35 patients (). At time point of analysis, 40 % (14/35) of the included patients had died after a median of 15.8 months after surgery (range 1.7–41.3 months). 21 patients were still alive after a median follow-up of 21.1 months (range 4.1–40.4 months).
Sample collection, processing and isolation of lymphocytes
Peripheral blood (median 16 mL, range 8–27 mL) was obtained from all 35 patients in heparinized vacutainer tubes the evening prior to surgery and collected after approximately 15 hours of storage at room temperature (RT). Heparinized ascites fluid (n = 30, median 550 mL, range 50–950 mL) and tumor tissue samples (n = 35, median 21.1 g, range 0.5–75.6 g) were obtained during surgery. The tumor tissue was of omental origin with visual carcinosis resected by the surgeon and was immediately placed in phosphate-buffered saline (PBS). Processing of all sample types began within one hour of collection.
Tumor tissue was processed as previously published.Citation48 Briefly, the tissue was mechanically dissociated using a scalpel and gentleMACS Dissociator (Miltenyi Biotec). The obtained suspension was filtered using 70 μm nylon cell strainers (Miltenyi Biotec) and was washed with PBS at 400 × g for 7 min. Tissue supernatant was saved from 50 mL of processed cell-PBS suspension for later lymphokine profiling. Plasma and ascites supernatants were collected after centrifugation at 400 × g for 7 min. All supernatants were stored at −80°C.
Mononuclear cells in blood, ascites and tumor tissue suspension were obtained by density gradient centrifugation with Lymphoprep (1.077g/cm2, Fresenius Kabi) and PBS at a ratio of 1:2 for blood and 1:4 for tumor/ascites. Samples were centrifuged at 800 × g for 20 min without brake. Cells were harvested and washed twice with PBS at 500 × g for 10 min. Cells were counted manually and/or using a Sysmex KX-21N (Sysmex Inc.).
Cryopreservation of cells
Some samples were frozen for later analysis, all others were characterized fresh after processing. Cells were cryopreserved in HyClone RPMI-1640 medium (GE Healthcare Life Sciences) containing 10% heat-inactivated AB serum (Karolinska University Hospital, Huddinge, Sweden) and 10% CryoSure dimethyl sulfoxide (WAK-Chemie Medical GmbH). Contents were mixed and kept overnight in −80°C and thereafter kept in −192°C until use. Cells were thawed at RT in AB serum-supplemented RPMI-1640 medium and washed twice in PBS before extracellular staining.
Extracellular marker characterization by flow cytometry
Cells were divided onto a pre-stained plate with titrated antibodies or isotype controls according to a nine-color panel (for antibody specification see Table S1). Maximum one million cells were used per well and in cases with low cell numbers, the panel was reduced. Towards the end of the study, the panel was expanded explaining the lower sample numbers for some markers. The plate was incubated for 20 min in dark at 4°C, and thereafter centrifuged at 700 × g for 4 min. The plate was washed once with PBS. Cells were diluted with PBS and 7-aminoactinomycin D (7-AAD, BD Biosciences) was used according to the manufacturer to stain for viability. Cells were incubated in dark for 10 min at RT and thereafter diluted 1:4 with PBS.
Samples were acquired on a BD FACSCanto (BD Biosciences) with BD FACSDiva Software v. 7.0 (BD Biosciences). Data was analyzed using FlowJo v. 10 (Becton, Dickinson and Company). Background in isotype controls and fluorescence-minus-one controls was subtracted from analyzed populations. Hierarchical gating strategy included forward scatter singlets (height vs. area)/alive cells (7AAD-)/lymphocytes (forward scatter vs. side scatter)/and then marker of interest. The Boolean gating tool in FlowJo was used to assess all possible co-inhibitory receptor combinations.
Cytokine and chemokine profiling by luminex
Concentrations of 26 cytokines and chemokines were analyzed in plasma samples (n = 33), supernatants of ascites (n = 28), and PBS-diluted supernatants of tumor tissue (n = 32) using MILLIPLEX MAP Human Cytokine/Chemokine Premixed 26 Plex (Millipore Corporation). The assay was performed according to the manufacturer’s instructions. Samples were analyzed using Luminex IS 2.3 software (Luminex Corporation) on a LABScan100 (One Lambda Inc.). Range of the analysis was 3.2–10,000 pg/mL and off-range values were adjusted to 3.1 and 10,001 pg/mL respectively.
Ex vivo activation using PMA/ionomycin and intracellular cytokine staining on tumor-derived TILs
Frozen mononuclear cells isolated from six tumor tissue samples were thawed in 10% AB serum-supplemented RPMI-1640 medium and incubated at a concentration of 2 × 10⁶ cells/mL for 6 hours at 37°C with Brefeldin A (10 μg/mL, Sigma-Aldrich), GolgiStop (BD Biosciences) and BV 510-conjugated ANTI-CD107a (clone H4A3, BD). Phorbol 12-myristate 13-acetate (PMA, 25 ng/mL, Sigma-Aldrich) and ionomycin (1 μg/mL, Sigma-Aldrich) were also added to a fraction representing the stimulated condition. After 6 hours, cells were washed with PBS at 500 × g for 10 min twice. Cells were extracellularly stained as previously described using FITC-conjugated ANTI-CD4 (RPA-T4), PE-conjugated PD-1 (MIH4), PE Cy7-conjugated ANTI-CD3 (SK7) and APC Cy-7-conjugated ANTI-CD8 (SK1) (all from BD Biosciences). The cells were washed and fixated using Fixation/Permeabilization solution (BD Biosciences) at 4°C for 7 min, followed by washing in PBS. Fixated cells were kept at 4°C over night and permeabilized the following day using Perm/Wash Buffer (BD Biosciences). Cells were intracellularly stained with PerCP Cy 5.5-conjugated ANTI-IL-17 (N49-653, BD Biosciences), PE eFlour 610-conjugated ANTI-TNF-α (Mab11, Ebioscience), APC-conjugated ANTI-IFN-γ (4S.B3, BD Biosciences) and Alexa 700-conjugated ANTI-IL-2 (MQ1-17H12, BioLegend) for 30 min at 4°C. Cells were washed with Perm/Wash Buffer and subsequently washed in PBS before acquisition on the flow cytometer and software previously described.
Reinvigoration of TIL response using PD-1 blockade and analysis by ELISA
For assessment of the effects of PD-1 blockade, frozen mononuclear cells isolated from six tumor tissue samples were thawed and incubated at a concentration of 1 × 10⁶ cells/mL for 48 hours at 37°C with 5% CO2 in presence of anti-CD3 (OKT3; Biolegend) at 50 ng/mL for activation of T-cells together with clinically used PD-1-directed antibody pembrolizumab (MK-3475, trade name Keytruda®, Merck & Co., Inc.) or negative control (Human IgG4λ, Sigma-Aldrich) at 100 nM in complete RPMI-1640 medium (containing 10% AB serum and 1% Penicillin-Streptomycin, GE Healthcare Life Sciences). After 48 hours, supernatants were collected and stored at −80°C until analysis with ELISA. Concentrations of IFN-γ in the supernatants were analyzed using the Human IFN-γ ELISAPRO Kit (Mabtech). The procedure was performed as instructed by the manufacturer. VMax kinetic microplate reader (Molecular Devices) and SoftMax Pro 6 Software (Molecular Devices) were used to measure the absorbance at 450 nm with subtraction of reference λ at 630 nm. The data was analyzed using Prism 6 (Graphpad Software Inc.) and Microsoft Excel (Microsoft Corporation). The data was thereafter normalized to reflect the same number of T-cells (per 500,000 T-cells). This was performed by analyzing the proportion of CD3+ T-cells out of the number of plated lymphocytes in an unstimulated sample after 48 hours using flow cytometry as previously described. Relative fold induction was calculated as a ratio of the response observed when only adding anti-CD3 and the condition including anti-PD-1 or negative control.
Statistical analysis
Prism 6 was used for univariate statistical analysis and graphic representation. Paired samples were initially compared using Friedman test followed by Wilcoxon signed-rank test. Bonferroni correction was used to adjust for multiple comparisons, multiplying the obtained p-values with the number of groups. Mann-Whitney U-test was used when comparing groups of patients. Phenotypic and soluble findings were compared based on clinical parameters including FIGO stage, residual tumor burden after surgery and pre-surgery serum levels of CA-125. Where possible, two groups were made based on the median value of the complete cohort. When determining correlations, Spearman’s rank coefficient was used and when plotted, non-linear regression (least squares ordinary fit) was also applied. Median values are presented throughout the results section.
Overall survival was measured from the date of primary surgery until death of any cause and patients still alive at last follow-up were censored. Log-rank test was used to determine univariate differences between groups and Kaplan Meier survival curves were used to plot the data. Median values of the complete cohort were used for grouping the patients, determining association to survival and performing risk factor analysis using log-rank test and Kaplan-Meier survival curves in EZR version 1.37.Citation49 All statistical analysis were two-tailed and significance levels were set to p < 0.05 (*), p < 0.01 (**), and p < 0.001 (***).
Disclosure of interest
The authors declare no potential conflicts of interest.
Supplemental Material
Download PDF (44.7 KB)Supplemental Material
Download PDF (1.4 MB)Acknowledgments
The authors would like to especially thank all patients who participated in this study and also Berit Legerstam at Kvinnohälsan as well as involved staff at central surgery at Karolinska University Hospital, Solna for making the logistics of this study possible. We would also like to thank Melissa Norström and Berit Sundberg for their contributions to the study.
Supplemental material
Supplemental data for this article can be accessed here.
Additional information
Funding
Related Research Data
References
- American Cancer Society. Cancer facts and figures 2017. Genes Dev. 2017;21:2525–2538. PMID:17938238. doi:10.1101/gad.1593107.
- Rizzuto I, Stavraka C, Chatterjee J, Borley J, Hopkins TG, Gabra H, Ghaem-Maghami S, Huson L, Blagden SP. Risk of ovarian cancer relapse score: A prognostic algorithm to predict relapse following treatment for advanced ovarian cancer. Int J Gynecol Cancer. 2015;25:416–422. PMID:25647256. doi:10.1097/IGC.0000000000000361.
- Zhang L, Conejo-Garcia JR, Katsaros D, Gimotty PA, Massobrio M, Regnani G, Makrigiannakis A, Gray H, Schlienger K, Liebman MN, et al. Intratumoral T cells, recurrence, and survival in epithelial ovarian cancer. N Engl J Med. 2003;348:203–213. PMID:12529460. doi:10.1056/NEJMoa020177.
- Sato E, Olson SH, Ahn J, Bundy B, Nishikawa H, Qian F, Jungbluth AA, Frosina D, Gnjatic S, Ambrosone C, et al. Intraepithelial CD8+ tumor-infiltrating lymphocytes and a high CD8+/regulatory T cell ratio are associated with favorable prognosis in ovarian cancer. Proc Natl Acad Sci U S A. 2005;102:18538–18543. PMID:16344461. doi:10.1073/pnas.0509182102.
- Hamanishi J, Mandai M, Iwasaki M, Okazaki T, Tanaka Y, Yamaguchi K, Higuchi T, Yagi H, Takakura K, Minato N, et al. Programmed cell death 1 ligand 1 and tumor- infiltrating CD8+ T lymphocytes are prognostic factors of human ovarian cancer. Proc Natl Acad Sci U S A. 2007;104:3360–3365. PMID:17360651. doi:10.1073/pnas.0611533104.
- Goode EL, Block MS, Kalli KR, Vierkant RA, Chen W, Fogarty ZC, Gentry-Maharaj A, Toloczko A, Hein A, Bouligny AL, et al. Dose-response association of CD8 + Tumor-infiltrating lymphocytes and survival time in high-grade serous ovarian cancer. JAMA Oncol. 2017;55905:e173290. PMID:29049607. doi:10.1001/jamaoncol.2017.3290.
- Giuntoli RL, Webb TJ, Zoso A, Rogers O, Diaz-Montes TP, Bristow RE, Oelke M. Ovarian cancer-associated ascites demonstrates altered immune environment: implications for antitumor immunity. Anticancer Res. 2009;29:2875–2884. PMID:19661290.
- Wherry EJ, Kurachi M. Molecular and cellular insights into T cell exhaustion. Nat Rev Immunol. 2015;15:486–499. PMID:26205583. doi:10.1038/nri3862.
- Wherry EJ. T cell exhaustion. Nat Immunol. 2011;131:492–499. doi:10.1038/ni.2035.
- Callahan MK, Postow MA, Wolchok JD. Targeting T cell co-receptors for cancer therapy. Immunity. 2016;44:1069–1078. PMID:27192570. doi:10.1016/j.immuni.2016.04.023.
- Schachter J, Ribas A, Long GV, Arance A, Grob JJ, Mortier L, Daud A, Carlino MS, McNeil C, Lotem M, et al. Pembrolizumab versus ipilimumab for advanced melanoma: final overall survival results of a multicentre, randomised, open-label phase 3 study (KEYNOTE-006). Lancet. 2017;390:1853–1862. PMID:28822576. doi:10.1016/S0140-6736(17)31601-X.
- Larkin J, Chiarion-Sileni V, Gonzalez R, Grob JJ, Cowey CL, Lao CD, Schadendorf D, Dummer R, Smylie M, Rutkowski P, et al. Combined Nivolumab and Ipilimumab or monotherapy in untreated melanoma. N Engl J Med. 2015;373:23–34. PMID:26027431. doi:10.1056/NEJMoa1504030.
- Wolchok JD, Chiarion-Sileni V, Gonzalez R, Rutkowski P, Grob -J-J, Cowey CL, Lao CD, Wagstaff J, Schadendorf D, Ferrucci PF, et al. Overall survival with combined Nivolumab and Ipilimumab in advanced melanoma. N Engl J Med. 2017;NEJMoa1709684. PMID:28889792. doi:10.1056/NEJMoa1709684.
- Hamanishi J, Mandai M, Ikeda T, Minami M, Kawaguchi A, Murayama T, Kanai M, Mori Y, Matsumoto S, Chikuma S, et al. Safety and antitumor activity of Anti-PD-1 antibody, nivolumab, in patients with platinum-resistant ovarian cancer. J Clin Oncol. 2015;33:4015–4022. PMID:26351349. doi:10.1200/JCO.2015.62.3397.
- Varga A, Piha-Paul SA, Ott PA, Mehnert JM, Berton-Rigaud D, Morosky A, Zhao GQ, Rangwala RA, Matei D. Pembrolizumab in patients (pts) with PD-L1–positive (PD-L1+) advanced ovarian cancer: updated analysis of KEYNOTE-028. J Clin Oncol. 2017;35:5513. doi:10.1200/JCO.2017.35.15_suppl.5513.
- Lengyel E. Ovarian cancer development and metastasis. Am J Pathol. 2010;177:1053–1064. PMID:20651229. doi:10.2353/ajpath.2010.100105.
- Foxwell BM, Taylor-Fishwick DA, Simon JL, Page TH, Londei M. Activation induced changes in expression and structure of the IL-7 receptor on human T cells. Int Immunol. 1992;4:277–282. PMID:1535786.
- Park CO, Kupper TS. The emerging role of resident memory T cells in protective immunity and inflammatory disease. Nat Med. 2015;21:688–697. PMID:26121195. doi:10.1038/nm.3883.
- Schenkel JM, Masopust D. Tissue-resident memory T cells. Immunity. 2014;41:886–97;. doi:10.1016/j.immuni.2014.12.007.
- Boddupalli CS, Bar N, Kadaveru K, Krauthammer M, Pornputtapong N, Mai Z, Ariyan S, Narayan D, Kluger H, Deng Y, et al. Interlesional diversity of T cell receptors in melanoma with immune checkpoints enriched in tissue-resident memory T cells. JCI Insight. 2016;1. PMID:28018970. doi:10.1172/jci.insight.88955.
- Watanabe R, Gehad A, Yang C, Scott LL, Teague JE, Schlapbach C, Elco CP, Huang V, Matos TR, Kupper TS, et al. Human skin is protected by four functionally and phenotypically discrete populations of resident and recirculating memory T cells. Sci Transl Med. 2015;7:279ra39. PMID:25787765. doi:10.1126/scitranslmed.3010302.
- Webb JR, Milne K, Watson P, DeLeeuw RJ, Nelson BH. Tumor-infiltrating lymphocytes expressing the tissue resident memory marker cd103 are associated with increased survival in high-grade serous ovarian cancer. Clin Cancer Res. 2014;20:434–444. PMID:24190978. doi:10.1158/1078-0432.CCR-13-1877.
- Zorn KK, Tian C, McGuire WP, Hoskins WJ, Markman M, Muggia FM, Rose PG, Ozols RF, Spriggs D, Armstrong DK. The prognostic value of pretreatment CA 125 in patients with advanced ovarian carcinoma: A gynecologic oncology group study. Cancer. 2009;115:1028–1035. PMID:19156927. doi:10.1002/cncr.24084.
- Fu Y, Wang X, Pan Z, Xie X. Clinical outcomes and prognostic factors of patients with epithelial ovarian cancer subjected to first-line treatment: a retrospective study of 251 cases. Front Med. 2014;8:91–5;. doi:10.1007/s11684-014-0305-7.
- Du BA, Reuss A, Pujade-Lauraine E, Harter P, Ray-Coquard I, Pfisterer J. Role of surgical outcome as prognostic factor in advanced epithelial ovarian cancer: A combined exploratory analysis of 3 prospectively randomized phase 3 multicenter trials: by the arbeitsgemeinschaft gynaekologische onkologie studiengruppe ovarialkarzin. Cancer. 2009;115:1234–1244. PMID:19189349. doi:10.1002/cncr.24149.
- Dahm-Kähler P, Borgfeldt C, Holmberg E, Staf C, Falconer H, Bjurberg M, Kjölhede P, Rosenberg P, Stålberg K, Högberg T, et al. Population-based study of survival for women with serous cancer of the ovary, fallopian tube, peritoneum or undesignated origin - on behalf of the Swedish gynecological cancer group (SweGCG). Gynecol Oncol. 2017;144:167–73;. doi:10.1016/j.ygyno.2016.10.039.
- Balch CM, Riley LB, Bae YJ, Salmeron MA, Cd P, von Eschenbach A, Itoh K. Patterns of human tumor-infiltrating lymphocytes in 120 human cancers. Arch Surg. 1990;125:200–205. PMID:1689143. doi:10.1001/archsurg.1990.01410140078012.
- Pagès F, Galon J, Dieu-Nosjean M-C, Tartour E, Sautès-Fridman C, Fridman W-H. Immune infiltration in human tumors: a prognostic factor that should not be ignored. Oncogene. 2010;29:1093–1102. PMID:19946335. doi:10.1038/onc.2009.416.
- Fridman WH, Pagès F, Sautès-Fridman C, Galon J. The immune contexture in human tumours: impact on clinical outcome. Nat Rev Cancer. 2012;12:298–306. PMID:22419253. doi:10.1038/nrc3245.
- Huang RY, Francois A, McGray AR, Miliotto A, Odunsi K. Compensatory upregulation of PD-1, LAG-3, and CTLA-4 limits the efficacy of single-agent checkpoint blockade in metastatic ovarian cancer. Oncoimmunology. 2017;6. PMID:28197366. doi:10.1080/2162402X.2016.1249561.
- Thommen DS, Schreiner J, Muller P, Herzig P, Roller A, Belousov A, Umana P, Pisa P, Klein C, Bacac M, et al. Progression of lung cancer is associated with increased dysfunction of T Cells defined by coexpression of multiple inhibitory receptors. Cancer Immunol Res. 2015;3:1344–1355. PMID:26253731. doi:10.1158/2326-6066.CIR-15-0097.
- Gros A, Robbins PF, Yao X, Li YF, Turcotte S, Tran E, Wunderlich JR, Mixon A, Farid S, Dudley ME, et al. PD-1 identifies the patient-specific CD8+ tumor-reactive repertoire infiltrating human tumors. J Clin Invest. 2014;124:2246–2259. PMID:24667641. doi:10.1172/JCI73639.
- Ahmadzadeh M, Johnson LA, Heemskerk B, Wunderlich JR, Dudley ME, White DE, Rosenberg SA, Dc W. Tumor antigen − specific CD8 T cells infiltrating the tumor express high levels of PD-1 and are functionally impaired Tumor antigen – specific CD8 T cells infiltrating the tumor express high levels of PD-1 and are functionally impaired. Blood. 2009;114:1537–1544. PMID:19423728. doi:10.1182/blood-2008-12-195792.
- Blackburn SD, Shin H, Haining WN, Zou T, Workman CJ, Polley A, Betts MR, Freeman GJ, Vignali DAA, Wherry EJ. Coregulation of CD8+ T cell exhaustion by multiple inhibitory receptors during chronic viral infection. Nat Immunol. 2009;10:29–37. PMID:19043418. doi:10.1038/ni.1679.
- Fourcade J, Sun Z, Benallaoua M, Guillaume P, Luescher IF, Sander C, Kirkwood JM, Kuchroo V, Zarour HM. Upregulation of Tim-3 and PD-1 expression is associated with tumor antigen–specific CD8 + T cell dysfunction in melanoma patients. J Exp Med. 2010;207:2175–2186. PMID:20819923. doi:10.1084/jem.20100637.
- Fourcade J, Sun Z, Pagliano O, Guillaume P, Luescher IF, Sander C, Kirkwood JM, Olive D, Kuchroo V, Zarour HM. CD8+ T cells specific for tumor antigens can be rendered dysfunctional by the tumor microenvironment through upregulation of the inhibitory receptors BTLA and PD-1. Cancer Res. 2011;72:887–896. PMID:22205715. doi:10.1158/0008-5472.CAN-11-2637.
- Matsuzaki J, Gnjatic S, Mhawech-Fauceglia P, Beck A, Miller A, Tsuji T, Eppolito C, Qian F, Lele S, Shrikant P, et al. Tumor-infiltrating NY-ESO-1-specific CD8+ T cells are negatively regulated by LAG-3 and PD-1 in human ovarian cancer. Proc Natl Acad Sci U S A. 2010;107:7875–7880. PMID:20385810. doi:10.1073/pnas.1003345107.
- Lang KS, Recher M, Navarini AA, Harris NL, Löhning M, Junt T, Probst HC, Hengartner H, Zinkernagel RM. Inverse correlation between IL-7 receptor expression and CD8 T cell exhaustion during persistent antigen stimulation. Eur J Immunol. 2005;35:738–745. PMID:15724249. doi:10.1002/eji.200425828.
- Radziewicz H, Ibegbu CC, Fernandez ML, Workowski KA, Obideen K, Wehbi M, Hanson HL, Steinberg JP, Masopust D, Wherry EJ, et al. Liver-infiltrating lymphocytes in chronic human hepatitis c virus infection display an exhausted phenotype with high levels of PD-1 and low levels of CD127 expression. J Virol. 2007;81:2545–2553. PMID:17182670. doi:10.1128/JVI.02021-06.
- Gentles AJ, Newman AM, Liu CL, Bratman SV, Feng W, Kim D, Nair VS, Xu Y, Khuong A, Hoang CD, et al. The prognostic landscape of genes and infiltrating immune cells across human cancers. Nat Med. 2015;21:938–945. PMID:26193342. doi:10.1038/nm.3909.
- Girardi M. Regulation of Cutaneous Malignancy by gamma delta T Cells. Science (80-). 2001;294:605–609. PMID:11567106. doi:10.1126/science.1063916.
- Gao Y, Yang W, Pan M, Scully E, Girardi M, Augenlicht LH, Craft J, Yin Z. γδ T Cells Provide an Early Source of Interferon γ in Tumor Immunity. J Exp Med. 2003;198:433–442. PMID:12900519. doi:10.1084/jem.20030584.
- Mattarollo SR, Kenna T, Nieda M, Nicol AJ. Chemotherapy and zoledronate sensitize solid tumour cells to Vγ9Vδ2 T cell cytotoxicity. Cancer Immunol Immunother. 2007;56:1285–1297. PMID:17265022. doi:10.1007/s00262-007-0279-2.
- D’Asaro M, La Mendola C, Di Liberto D, Orlando V, Todaro M, Spina M, Guggino G, Meraviglia S, Caccamo N, Messina A, et al. V 9V 2 T lymphocytes efficiently recognize and kill zoledronate-sensitized, imatinib-sensitive, and imatinib-resistant chronic myelogenous leukemia cells. J Immunol. 2010;184:3260–3268. PMID:20154204. doi:10.4049/jimmunol.0903454.
- Wherry EJ, Ha S-J, Kaech SM, Haining WN, Sarkar S, Kalia V, Subramaniam S, Blattman JN, Barber DL, Ahmed R. Molecular signature of CD8+ T cell exhaustion during chronic viral infection. Immunity. 2007;27:670–684. PMID:17950003. doi:10.1016/j.immuni.2007.11.006.
- Rollins BJ. Chemokines. Blood. 1997;90:909–928. PMID:9242519.
- Kleiner G, Marcuzzi A, Zanin V, Monasta L, Zauli G. Cytokine levels in the serum of healthy subjects. Mediat Inflamm. 2013;2013:434010. PMID:23533306. doi:10.1155/2013/434010.
- Norström MM, Rådestad E, Stikvoort A, Egevad L, Bergqvist M, Henningsohn L, Mattsson J, Levitsky V, Uhlin M. Novel method to characterize immune cells from human prostate tissue. Prostate. 2014;74:1391–1399. PMID:25111297. doi:10.1002/pros.22854.
- Kanda Y. Investigation of the freely available easy-to-use software “EZR” for medical statistics. Bone Marrow Transplant. 2013;48:452–458. PMID:23208313. doi:10.1038/bmt.2012.244.