
ABSTRACT
Purpose: Anti-PD-1 therapy has revolutionized the treatment and improved the survival of stage IV melanoma patients. However, almost half of the patients fail to respond due to immune evasive mechanism. A known mechanism is the downregulation of major histocompatibility complex (MHC) class I expression, which prevents T cell recognition of the tumor. This study determined the relationship between natural killer (NK) cell numbers and clinical response to anti-PD-1 therapy in metastatic melanoma.
Experimental Design: Twenty-five anti-PD-1 treated metastatic melanoma patients were categorized into responders (complete response (CR)/partial response (PR)/stable disease (SD) ≥ 6 mo, n = 13) and non-responders (SD < 6 days/progressive disease (PD), n = 12) based on RECIST response. Whole transcriptome sequencing and multiplex immunofluorescent staining were performed on pre-treatment and on a subset of early during treatment tumor samples. Spatial distribution analysis was performed on multiplex immunofluorescent images to determine the proximity of NK cells to tumor cells. Flow cytometry was used to confirm NK phenotypes in lymph node metastases of treatment naïve melanoma patients (n = 5). Cytotoxic assay was performed using NK cells treated with anti-PD-1 or with isotype control and co-cultured with 3 different melanoma cell lines and with K562 cells (leukemia cell line).
Results: Differential expression analysis identified nine upregulated NK cell specific genes (adjusted p < 0.05) in responding (n = 11) versus non-responding patients (n = 10). Immunofluorescent staining of biopsies confirmed a significantly higher density of intra- and peri-tumoral CD16+ and granzyme B + NK cells in responding patients (p < 0.05). Interestingly, NK cells were in closer proximity to tumor cells in responding PD-1 treated patients compared to non-responding patients. Patients who responded to anti-PD-1 therapy, despite MHC class I loss had higher NK cell densities than patients with low MHC class I expression. Lastly, functional assays demonstrated PD-1 blockade induces an increase in NK cells’ cytotoxicity.
Conclusions: A higher density of tumoral NK cells is associated with response to anti-PD-1 therapy. NK cells may play an important role in mediating response to anti-PD-1 therapy, including in a subset of tumors downregulating MHC class I expression.
Introduction
Anti-programmed cell death protein-1 (Anti-PD-1) therapy (pembrolizumab or nivolumab) has revolutionized the treatment of stage IV melanoma patients. Prior to anti-PD-1, the median overall survival (OS) for patients with stage IV melanoma was 7.5 months.Citation1,Citation2 Now with pembrolizumab and nivolumab, studies have shown that the median OS for stage IV melanoma is 16.8 months.Citation3,Citation4 Despite this rapid advance in stage IV melanoma treatment, more than half of anti-PD-1 treated patients experience primary resistance to treatment, while approximately 30% of initial responders will eventually acquire resistance to anti-PD-1 therapy.Citation4,Citation5 Therefore, there is a critical unmet need to comprehensively understand the mechanisms of resistance to anti-PD-1 therapy. By doing so, primary and acquired resistance to immunotherapy could be managed more effectively, and as a consequence, enable much higher objective response rates and overall survival of stage IV melanoma patients. Furthermore, given the proven efficacy of anti-PD-1 therapy across many solid tumors, understanding resistance mechanisms, in melanoma, may lead to improved treatment outcomes, not only in patients with melanoma, but also those with other cancers.
It is well established that CD8 + cytotoxic T cells are essential for the therapeutic efficacy of anti-PD-1.Citation6 However, tumors can evade the cytolytic immune response through immunosuppressive countermeasures, such as the upregulation of suppressive ligands, activation of inhibitory immune checkpoints, such as PD-1, infiltration of immunosuppressive cells or dysfunction in antigen presentation that T cell rely upon for activation.Citation7 An example of the latter is the downregulation of MHC class I expression, which is a vital component for T cell recognition, enabling tumor cells to evade an effective CD8 + T cell driven response. Natural killer cells (NK cells), innate immune lymphocytes, are normally inhibited by MHC class I expression, the loss of which steers NK cells towards activation and cytolytic killing of the tumor cells. This cytolytic capacity leads to the release of tumor antigens. Additionally, NK cells also kill immature dendritic cells, promoting Th1 differentiation of CD4 + T cells and directly killing regulatory T cells.Citation8,Citation9
In order to understand the role of NK cells in anti-tumor responses to anti-PD-1 therapy, we investigated whether the presence of higher numbers of intratumoral and peritumoral NK cells is associated with better response. We assessed the gene expression profiles of melanoma patient biopsies, excised before and early during treatment with anti-PD-1 for genes related to NK cell signaling. We further examined the melanoma biopsies to characterize the change in NK densities at pre-treatment to EDT biopsies. Finally, we performed a NK cell cytotoxic assay to investigate the effect of PD-1 blockade on NK cell degranulating capacity.
Results
NK cell related genes are upregulated in anti-PD-1 responders compared to non-responders
The immunotranscriptomic profiles at pre-treatment (PRE) of non-responding and responding tumors demonstrated that NK cell related genes (BH-corrected p < 0.05) were predominately upregulated in responders (). These genes include KLRD1, KLRC4-KLRK1, KLRC4, NKG7, KIR3DX1, KIR2DL4, NCR1 and CD244. Additionally, other genes that were expressed higher in responding patients included antigen presentation machinery related to MHC class I (HLA-A, HLA-B, HLA-E, HLA-F, TABP, TAP1, UBD and UBE2L6) and other immune modulators (HAPLN3, NDST3 and PDCD1).
Figure 1. RNA-sequencing analysis on PRE and EDT FFPE tissue biopsies of stage IV melanoma patients treated with anti-PD-1 therapy.
(a) Unsupervised Euclidean hierarchical cluster heat map of NK cell related genes in PRE treatment tissue between anti-PD-1 responding (n = 10) and non-responding patients (n = 11). (b) Unsupervised Euclidean hierarchical clustering heat map of NK cell related genes in EDT treatment tissue between anti-PD-1 responding (n = 5) and non-responding patients (n = 4).
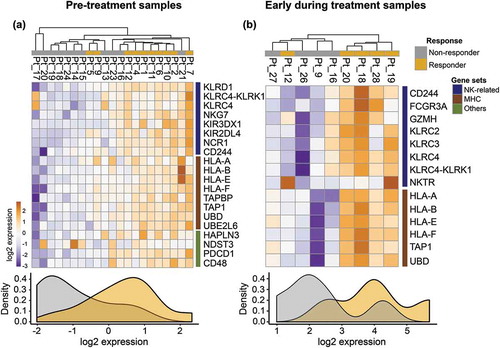
Next, we sought to investigate how the immunotranscriptomic profiles changed in early during treatment (EDT) responding and non-responding tumors (BH-corrected p < 0.2) to PD1 therapy. These analyses revealed a similar pattern of NK cell related genes (GZMH, FRCG3A, NKTGR, CD244, KLRC2, KLRC3, KLRC4, KLRC4-KLRK1) and antigen presentation on MHC class I (HLA-A, HLA-B, HLA-E, HLA-F, UBD) that were significantly upregulated in responding patients compared to non-responding patients in early during treatment biopsies ().
Peritumoral CD56 + CD3- NK cells are significantly higher in responders than non-responders
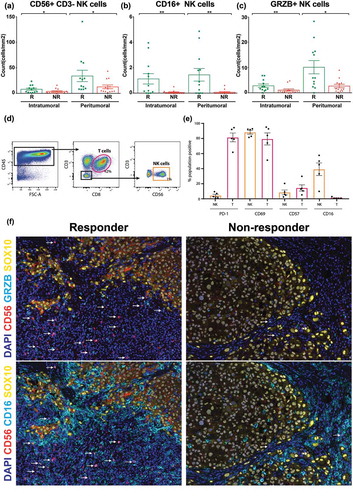
As the NK cell related gene set (KLRD1, KLRC4-KLRK1, KLRC4, NKG7, KIR3DX1, KIR2DL4, NCR1 and CD244) obtained from RNAseq analysis could also be expressed by a subset of T cells, we next queried whether there was an increased density of NK cells in the tumors of responders (n = 12) compared with non-responders (n = 13). CD56 and CD3 were used to mark NK cells (CD56 + CD3-) in the same tumor specimen used to generate the RNAseq data. The peritumoral density of NK cells was significantly higher in responders (34.1 ± 11.1 cells/mm2) compared with non-responders (12.8 ± 3.7 cells/mm2; p = 0.026). Similarly, responders had a significantly higher density of intratumoral NK cells than non-responders as depicted in (8.1 ± 2.1 cells/mm2 versus 3.8 ± 1.4 cells/mm2; p = 0.040).
Figure 2. Quantitative multiplex fluorescent image analysis of NK cells in baseline FFPE and NK cell phenotyping by flow cytometry.
NK cell phenotype and activation were evaluated on baseline FFPE tissue biopsies in 12 responding (R) and 13 non-responding (NR) stage IV melanoma patients treated with anti-PD-1 therapy (a) Intratumoral vs. peritumoral count of NK cells/mm2 in responders and non-responders. (b) Intratumoral vs. peritumoral count of CD16+ NK cells/mm2 in responders and non-responders. (c) Intratumoral vs. peritumoral count of GRZB+ NK cells/mm2 in responders and non-responders. Tumor dissociates from five stage III melanoma patients were analyzed for CD69, PD-1, CD16 and CD57 expression on NK (orange) and CD8+ (red) T cells. (d) Gating strategy used to identify CD56 + CD3- NK cells and CD3 + CD8 + T cells. (b) PD-1, CD69, CD57 and CD16 expression (%) on NK and CD8 + T cells. (e) PD-1, CD69, CD57 and CD16 expression (%) on NK and CD8 + T cells. (f) Multiplex fluorescent images comparing CD56, CD16 and GRZB staining in responders and non-responders. DAPI represents the nucleus. The arrows represent colocalization of CD56 and CD16 or CD56 and GRZB. Error bars represent the standard error of the mean. P values were obtained by Mann-Whitney U test. *P < 0.03; **P < 0.0021. Error bars represent the standard error of the mean. Abbrev. T: T cells; NK: Natural killer cells.
Anti-PD-1 responders exhibit higher levels of differentiated and activated NK cells
Next, we sought to determine whether these NK cells were differentiated or activated through CD16 or Granzyme B (GRZB) expression. Responding patients to anti-PD-1 treatment had a significantly higher density of intratumoral (responders: 1.1 ± 0.4 cells/mm2 vs. non-responders: 0.06 ± 0.04 cells/mm2; p = 0.0041) and peritumoral CD16 + NK cells than non-responders (responders: 1.4 ± 0.5 cells/mm2 vs. non-responders: 0.07 ± 0.05 cells/mm2; p = 0.0039) as shown in . Similarly, the counts of intratumoral (responders: 2.8 ± 0.7 cells/mm2 vs. non-responders: 1.1 ± 0.4 cells/mm2; p = 0.0079) and peritumoral GRZB + NK cells (responders: 10.2 ± 2.6 cells/mm2 vs. non-responders: 2.7 ± 0.7 cells/mm2; p = 0.015) were significantly higher in responders when compared to non-responders on anti-PD-1 treatment (). shows a visual representation of the activated (GRZB+) and differentiated (CD16+) NK cells in responding and non-responding patients.
Furthermore, as phenotypical data on intratumoral NK-cells is limited, we sought to phenotype the NK cells present in lymph nodes metastases from treatment naïve melanoma patients to confirm the above phenotypes. The flow cytometry of stage III treatment-naïve melanoma patients, found that 1% of the CD45+ cells present in the melanoma biopsies were NK cells (CD56+/CD3-), which is consistent with the above data and with previous study,Citation10(). Moreover, these intratumoral NK cells frequently expressed the activation marker CD69 (88 ± 3%), less frequently expressed the differentiation marker CD16 (39 ± 8%) and a lower proportion of NK cells expressed PD−1 (mean frequency; 4 ± 2%) and a marker of terminal differentiation, CD57 (8 ± 3%) ().
NK cells are in closer proximity to melanoma cells in responders compared to non-responders
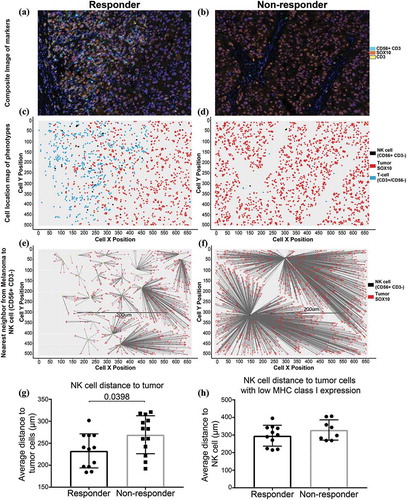
We conducted spatial distribution analysis of NK cells in relation to melanoma cells to determine if the intercellular distances play a role in response to anti-PD-1 therapy. Analysis of the cells within their X- and Y- coordinates within the tissue revealed NK-cells are significantly closer to melanoma cells in the tumor biopsies of responding patients (n = 12, median distance NK to tumor cell = 238 μm) compared to non-responders (n = 13, median = 283 μm, Mann-Whitney test p = 0.0398) (). Additionally, NK cells were closer to melanoma cells with low HLA expression in responding patient biopsies (median = 301 μm) compared to non-responding patients (median = 320 μm), however, this did not reach statistical significance (Mann-Whitney test p = 0.3511; ).
Figure 3. Spatial distribution of NK cells with melanoma cells.
Representative images of an area from a responding patient (a) and a non-responding patient (b) to PD-1 treatment for spatial distribution analysis. (c) and (d) Cell location maps of the T cells, NK cells and tumor cells in representative responding and non-responding patients. (e) and (f) Visual depiction of the nearest neighbor calculation between NK cells and tumor cells. (g) NK cell distance to tumor cells. (h) NK cell distance to tumor cells with low MHC class I expression.
NK cell densities are higher in responders than non-responders with MHC class i loss
In order to determine the relationship between NK cell and their possible target cells that lost MHC class I expression, we quantified MHC class I expression by examining the HLA class I genes (HLA-A, -B and -C) expression of SOX10+ melanoma cells through quantitative multiplex fluorescent imaging. When the count of HLA+ melanoma cells was taken as a percentage of the total SOX10+ melanoma cells there was a non-significant trend towards responders having a higher proportion of HLA expressing melanoma cells than non-responders (83 ± 5% vs. 63 ± 9%; ). However, we found no correlation between MHC class I expression in melanoma cells with intratumoral (spearman r = −0.003; p = 0.98) or peritumoral (spearman r = 0.11; p = 0.59) NK cell density ().
Figure 4. Anti-PD-1 treated patients with high tumor infiltrating NK cells and low MHC class I+ melanomas have improved survival.
(a) Percentage of MHC class I+ melanoma cells between responders and non-responders. (b) Correlation between MHC class I and intra- or peri-tumoral NK cells. (c) Kaplan-Meier analysis of patients with high MHC class I expression (n = 14; low MHC high NK vs high MHC log-rank p = 0.91), low MHC class I expression with low NK cell density (n = 9) and low MHC class I expression with high NK cell density (n = 2; low MHC high NK vs low MHC low NK log-rank p = 0.12). Both patients with low MHC class I expression and high NK cell density category were responders to anti-PD-1 therapy. (d) Intratumoral CD3- CD56+ NK cells were investigated by multiplex IHC in PRE-EDT matched samples from 5 responding and 2 non-responding stage IV melanoma patients treated with anti-PD-1 therapy. (e) Proportion of intratumoral PD-1+ NK cells in matched PRE-EDT samples from stage IV melanoma patients treated with anti-PD-1 therapy. (f) Multiplex fluorescent IHC images of PRE-EDT biopsies from a representative responder and non-responder stage IV melanoma patient treated with anti-PD-1. CD56+ (red) NK cells are shown to co-localize (white arrow) with PD-1 (blue). (g) The effect of PD-1 blockade on NK cell cytotoxicity. Four stage IV melanoma patients had NK cells isolated from their PBMCs and they were co-cultured with either A375, MM200, K562 or SK-MEL-28 cell lines after the addition of a PD-1 blocking antibody or IgG isotype control. LAMP-1 expression on NK cells was measured by flow cytometry as readout of cytotoxicity. (h) Example density plot of LAMP1 + NK cells treated with IgG isotype control (blue) or anti-PD-1 (red).
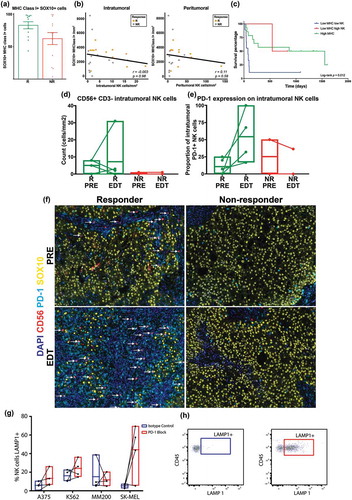
With anti-PD−1 therapy largely depending on CD8+ T cells, the loss of MHC class I expression would render melanoma cells resistant to CD8+ T cell mediated killing. Therefore, we sought to determine the association between NK cell density and anti-PD−1 response in the context of loss of MHC class I. The Cutoff Finders software was used to stratify patients based on MHC expression,Citation11 and revealed that patients with higher MHC class I+ melanoma expression (>3034 cells/mm2) had longer overall survival than those with low expression (<3034 cells/mm2, p = 0.023) (Supplementary Figure 1). We then selected the patients with low MHC class I+ melanoma (<3034 cells/mm2) and further stratified them based on their intratumoral and peritumoral NK cell densities. We found that despite MHC class I loss, responding patients had the top four highest intratumoral NK cell density out of all the patients in this cohort. They also had a similar PFS to patients with high MHC class I expression (; Pt 10 and 11).
Proportion of PD-1+ NK cells increase at EDT in responders to anti-PD-1 therapy
A unique cohort of paired PRE-EDT FFPE biopsies obtained from patients treated with anti-PD-1 was assessed for changes in NK cell densities and PD-1 positivity. Given that EDT samples are difficult to obtain, due to the invasive nature of the biopsies and this not being standard clinical practice, we analyzed 5 responding and 2 non-responding paired samples treated with anti-PD-1 therapy. Notably, a responding patient (Pt 26) had a large increase in intratumoral NK cells in the EDT biopsy. However, across all patients, there were no specific trends for changes in intratumoral NK cell density during treatment in this small cohort (). Nevertheless, we noted an increase in the proportion of PD-1 expressing intratumoral NK cells between the PRE-EDT biopsies of responding patients ( and ).
PD-1 blockade improves NK cell cytotoxicity against tumor cells
Given that responders to PD-1 treatment had a higher density of NK cells at baseline and as NK cells express PD-1, we sought to investigate how PD-1 blockade affects NK cell cytotoxicity. We firstly isolated NK cells (through negative selection) from peripheral blood of 4 treatment naïve stage IV melanoma patients and stimulated them overnight with IL-2. We then treated these NK cells with either anti-PD-1 blocking antibody or IgG isotype control for 30 min before performing the cytotoxic assay. As part of the cytotoxic assay, we co-cultured these stimulated and treated NK cells with three melanoma cell lines (A375, MM200 and SK-MEL-28) or a leukemia cell line (K562), and added LAMP-1 along with monensin to the co-culture. After four hours of co-culture, LAMP-1 expression was measured by flow cytometry as a read-out of cytotoxic activity. Interestingly, there was a trend towards NK cells treated with PD1 having higher cytotoxic activity (higher LAMP-1 expression) when compared with NK cells treated with IgG isotype control against all four cell lines, including A375 (5.74% vs 10.03%; p = 0.20), MM200 (7.75% vs 10.35%; p = 0.89), K562 (15.3% vs 21.95%%; p = 0.34) and SK-MEL-28 (5.28% vs 50.45%%; p = 0.11), confirming a direct effect of PD1 treatment on NK cells’ function ( and ).
Discussion
Anti-PD-1 therapy is highly dependent on CD8 + T cells, and one of the mechanisms tumors use to evade CD8 + T cell responses is to disable the activation signals produced by peptide loaded MHC class I.Citation7 Despite the important role of NK cells in monitoring and eliminating MHC class I deficient cells, determining how this axis contributes to clinical responses with anti-PD-1 therapy is unknown. In this study, we have shown that responding patients have higher expression of NK cell related genes than non-responding patients. Our RNAseq data at EDT revealed that the expression of markers for NK cell differentiation and activation were significantly higher in responding patients. Using multiplex immunofluorescent staining we have shown that patients responding to anti-PD-1 have a higher density of differentiated and activated NK cells in pre-treatment tumors and that these NK cells are in closer proximity to melanoma cells when compared to non-responding patients. Furthermore, responding patient’s display increased proportion of PD-1 expressing intratumoral NK cells in their early during treatment biopsy when compared to their pre-treatment biopsy. Finally, we showed that blocking PD-1 on NK cells increased their cytotoxicity against tumor cells.
The RNAseq analysis on pre-treatment tumor samples demonstrated that responding patients had a higher expression of NK related genes than non-responding patients. Furthermore, the gene expression analysis on early during treatment tumors from responding patients had higher expressions of a marker for NK cell maturation (FCGR3A), activating receptor CD244 and also a receptor responsible for NK cell-target cell binding (Natural Killer Cell Triggering Receptor [NKTR]), which is upregulated upon IL-2 stimulation of NK cells.Citation12 Remarkably, GZMH, a protein highly expressed in NK cells,Citation13 which induces an alternative, caspase independent cell death,Citation14 was significantly upregulated in responding patients. The increased NK cell gene signatures in the pre-treatment and in the early during treatment biopsies of responders to PD-1 treatment is consistent with a previous study.Citation15 In that study, the authors also highlight that the changes in the proportion of CD8T cells, NK cells and macrophages were higher in responders when compared to non-responders between pre-treatment and early during treatment biopsies. These RNA signatures suggest that NK-cells are important in the response of patients to anti-PD-1 therapies.
Interestingly, our study found higher expression of NK-cell related genes in responders corresponds to higher MHC class I expression. However, NK-cells can still contribute to tumor killing even in the context of high MHC expression through alternate activating ligands for NK cell activation receptors such as CD48, MICA, MICB, CD155 and CD112.Citation16 Another possibility is that NK-cells are important for eliminating MHC class I deficient melanoma cells and preventing immunoediting and expansion of MHC deficient melanoma clones. We have previously shown that loss of HLA-A expression occurs in patients’ tumors that acquire resistance to anti-PD-1 therapies.Citation17 This study found that MHC expression was present in the pretreatment tumors but expression was lost in the lesions resected at the disease progression on PD-1 treatment. Therefore, NK cells may be able to control the growth of the clonal expanded MHC class I deficient melanoma cells, whilst leaving the MHC class I expressing melanoma cells for CD8 + T cell killing.
Furthermore, our study showed in patients with MHC class I loss, NK cells may play a critical role in the response to anti-PD-1 therapy. Because CD8 + T cells are known to be essential for anti-PD-1 therapy, and given that MHC class I expression by target cells is essential for T cell recognition and killing, we would expect patients with MHC class I loss not to respond well to anti-PD-1 therapy. The fact that there are patients that respond to anti-PD-1 despite MHC class 1 loss suggests that anti-PD-1 may also be targeting other immune cells, besides T cells, which are capable of functioning in the absence of MHC class I. We propose that in light of our work, NK cells could be a likely candidate, where anti-PD-1 reinvigorates NK cell function and eliminates tumors which are capable of evading CD8 + T cell responses through the downregulation of MHC class I. More recently, studies have highlighted the important role of NK cells in mediating the therapeutic efficacy of current drug treatments. In mice treated with anti-cytotoxic T-lymphocyte-associated protein-4 (anti-CTLA-4), depletion of either CD8 + T cells or NK cells increased tumor growth; however, when CD8 + T cells and NK cells were concurrently depleted, tumor growth resembled the control group, emphasizing that the therapeutic efficacy of anti-CTLA-4 depended on the cooperation between NK and CD8 + T cells.Citation18
In Kaposi sarcoma, PD-1 expressing NK cells have been shown to be hyporesponsive and inhibits NK cell effector functions.Citation19 For this reason, in this study we have hypothesized that PD-1 blockade would improve NK cell cytotoxicity against melanoma cells. In our unique and rare cohort of matched PRE-EDT biopsies with patients stratified into responders and non-responders, we were able to show that the proportion of intratumoral PD-1+ NK cells increases between PRE and EDT tumors in responding patients to anti-PD-1 therapy, with no obvious change in non-responding patients. PD-1 blockade on NK cells, T cells and other immune cells will activate and stimulate the release of pro-inflammatory cytokines,42 which would cause NK cell activation. This is supported by the functional assays that found PD-1 blockade improved NK cell cytotoxicity against melanoma cells and therefore NK-cells may have both direct and indirect affect in the response of patients to anti-PD-1 treatment.
Collectively, the present findings suggest that melanomas that responded to anti-PD-1 therapy, with MHC class I loss, had higher NK cell densities, highlighting the possibility that NK cells mediate removal of MHC class I deficient cells, leaving MHC class I expressing melanoma cells that are vulnerable to attack by CD8 + T cells. This work supports the concept that NK cells and T cells cooperate to produce clinical responses to anti-PD-1 therapy.
Materials and methods
Patient samples
Twenty-five patients with stage IV melanoma treated with either pembrolizumab or nivolumab (Supplementary table 1) were identified from the Melanoma Institute Australia Research Database. The formalin-fixed, paraffin-embedded (FFPE) tissue blocks and blood samples analyzed in the current study were obtained from the Melanoma Institute Australia biospecimen bank with written informed patient consent and institutional review board approval (The Sydney Local Health District Human Research Ethics Committee, Protocol No. X15-0454 and HREC/11/RPAH/444). The FFPE tissue blocks were reviewed by a pathologist (RAS) to confirm the presence of tumor. Patient response and progression-free survival (PFS) was determined using RECIST v1.1.Citation20 Patients with a RECIST response of complete response (CR), partial response (PR) or stable disease (SD) ≥6 days were classified as responders. Non-responders were classified as those with a RECIST response of PD or SD < 6 months.
Multiplexed immunofluorescence staining
FFPE tumor specimens were cut at 4 µM and air dried overnight. The tissue was baked at 65°C for 30 minutes then deparaffinized and rehydrated through xylene and ethanol. Heat induced antigen retrieval was performed by boiling the samples at 100°C for 15 minutes in pH 9 antigen retrieval (AR) buffer (ThermoFisher Scientific, USA). Sequential immunofluorescence staining was performed using a Dako Autostainer Plus. Primary antibody panels consisting of 1) CD56 (1/4000; CM156R95), granzyme B (1/1000; M7235), SOX10 (1/800; ACI3099C), CD16 (1/30,000; ab198507), CD3 (1/15,000; CM103R95), PD-1 (1/400; ab137132) HLA-A, B and C (1/32,000; ab70328) and SOX10 were incubated for 30 minutes. Because HLA is a major component of MHC class I and consists of either one of three HLA loci – HLA-A, HLA-B and HLA-C – an antibody that detects all three loci was used. Primary antibodies were detected either with MACH 3 Rb or Ms HRP-polymer (Biocare, USA) for 5 minutes and visualized using Tyramide Signal Amplification with 5-minute incubations (Opal 7-Colour IHC, Perkin Elmer, USA). Between subsequent staining runs, tissues were boiled in pH 9 AR buffer for 15 minutes to strip the antibody-HRP complex from the sample. On the last staining run, DAPI was added to the sample for 5 minutes. The samples were cover slipped using Vectashield (H-1400) and imaged on the Vectra 3.0 multispectral imaging system.
Image and statistical analysis
Representative high-power images (20 x MSI images) were selected from whole slide scans of the tumor biopsies. Areas of necrosis were avoided. Images were analyzed using Inform 2.2.1 to phenotype cells within the images and to quantify the expression of the above markers on a cell by cell basis (Perkin Elmer, USA). Quantitative analysis was conducted using TIBCO® Spotfire® 3.3.1. 1. The flow cytometry data were processed and quantified using FlowJo software 10.3 (Treestar, Ashland, USA). Comparison of values was performed using Mann-Whitney U test for unpaired data unless otherwise stated. The median and mean ± standard error of mean (SEM) were done using GraphPad Prism v7 (GraphPad Software, La Jolla, USA).
Spatial distribution analysis of NK cell and tumor cell populations
The multiplex immunofluorescent images were processed using the Inform analysis software (Perkin Elmer) to obtain the individual cell segmentation files for all images and phenotype of cells as NK-cells (CD56+ and CD3-) and melanoma cells (SOX10+). These files were then analyzed using the R package Phenoptr (https://perkinelmer.github.io/phenoptr/) to compute the inter-cellular distances of NK-cells to the nearest tumor cells based of the X- and Y-coordinates contained in the cell segmentation files. The distance of each NK cell to the nearest tumor cell (SOX10+) was calculated. Additionally, the distance to the nearest HLA low tumor cell (<3034 SOX10 + HLA + cells) was calculated and added to the segmentation file. Secondary analysis was performed in Spotfire (Tibco) and Prism to analyze differences in the intercellular distances between response groups.
NK cell cytotoxic assay
Peripheral blood mononuclear cells (PBMCs) from four stage IV melanoma patients were thawed and the NK cells were isolated using the EasySepTM Human NK cell Isolation kit (negative selection) per manufacturer’s instructions (Stem Cell Technologies, USA). Afterwards, NK cells were plated, at a 5:1 effector to tumor cell ratio, into a 96-well plate with RPMI-1640 (Life Technologies, USA) + 10% FBS (Life Technologies, USA) + 1000 U/mL IL-2 (PeproTech, USA) for 18 hours at 37°C and 5% CO2. Afterwards, 10 µg/mL recombinant human PD-1 (Biolegend, USA) or 10 µg/mL mouse IgG1, k isotype control (Biolegend, USA) was added to the NK cells and incubated for 30 minutes at 37°C and 5% CO2. SK-MEL-28, MM200, A375 and K562 cells were co-cultured with the NK cells, 1X monesin (Thermofisher, USA) and LAMP-1-AF647 (Biolegend; 1/20) for four hours at 37°C and 5% CO2.
Following this, flow cytometry staining was performed. Each well was stained with Zombie AquaTM viability stain for 20 minutes in the dark at 4°C. The samples were then stained with CD56 (5.1H11; 1/20; Biolegend), CD16 (3G8; 1/20; Biolegend), PD-1 (EH12.1; 1/5; BD) and CD45 (HI30; 1/20; Biolegend). The samples were fixed with 2% paraformaldehyde, before analyzing the samples using the LSR II flow cytometer (BD, USA).
Flow cytometry
Five Melanoma positive lymph nodes tissue from stage III treatment-naïve patients were individually dissociated in 1 mg/ml of Liberase (Roche,USA) to enable efficient dissociation of lymphocytes from the tumor cells and stromal tissues. The specimens were then finely chopped and incubated with the Liberase at 37 °C in a water bath for 90 minutes. Following incubation, partially digested tumors were mashed and forced through a 40 µm cell strainer and washed twice in 1× phosphate buffered saline (PBS). Isolated cells were then counted using a hemocytometer and cryopreserved.
Lymphocytes from cryopreserved samples were stained with fluorochrome conjugated monoclonal antibodies (mAbs) for 20 minutes at 4 °C in the dark. NK cells and their subtypes were identified using the following mAbs: CD56 (5.1H11; 1/20; Biolegend, USA), CD57 (HCD57; 1/20; Biolegend, USA), CD16 (3G8; 1/20; BD, USA), CD3 (SK7; 1/20; BD, USA), CD69 (FN10; 1/20; Biolegend, USA), PD-1 (EH12.1; 1/5; BD, USA) and CD8 (SK1; 1/20; BD, USA). Stained cells were then washed and fixed with 2% paraformaldehyde before analysis using the LSRFortessa flow cytometer (BD, USA).
Whole transcriptome sequencing and differentially expressed gene analysis
Data were obtained from our prior whole transcriptome RNA sequencing (European Nucleotide Archive accession number PRJEB23709) of anti-PD-1 responders and non-responding metastatic melanoma patients (100-bp paired-end, Illumina Hiseq 2500, median of 47 M reads per sample). Briefly, the R package DESeq2Citation21 and HTSeq version 0.6.1Citation22 were used respectively to perform gene count and differentially expressed gene analysis of anti-PD-1 responding and non-responding patients as previously described. Briefly, the normalized expression values were displayed as counts per million (cpm). To determine fold change differences, the log ratio of expression levels for each gene between non-responders and responders were computed using DESeq2. Significantly differentially expressed genes were identified as those with a P value of <0.05 with Benjamini-Hochberg (BH) multiple testing correction at 5% false-discovery rate (FDR).
Statistical analysis
Quantitative image analysis was conducted using TIBCO® Spotfire® 6.0.0. Calculation of log-rank test and Kaplan-Meier survival curves were analyzed in R environment (‘survminer’ package). Other general statistics including Mann-Whitney U Test, median and mean ± SD were done using GraphPad Prism 7.0.
Conflicts of interest
G.V.L. is a consultant advisor to Amgen, Array, BMS, Merck MSD, Novartis, Roche, and Pierre Fabre. A.M.M is a consultant advisor for BMS, Merck MSD, Novartis, Roche and Pierre Fabre. M.S.C is a consultant advisor for Amgen, BMS, Merck MSD, Novartis and Pierre Fabre. All other authors declare no conflicts of interest.
Supplemental Material
Download Zip (1.7 MB)Acknowledgments
This work was supported by Melanoma Institute Australia, the New South Wales Ministry of Health, NSW Health Pathology, National Health and Medical Research Council of Australia (NHMRC) and Cancer Institute NSW. J.S.W. is supported by CINSW and NHMRC Early Career Fellowships. A.M.M is supported by Cancer Institute NSW fellowship. R.A.S., and G.V.L. are supported by NHMRC Fellowships. G.V.L. and J.F.T are supported by the Medical Foundation of the University of Sydney. H.L. is supported by an APEX Foundation scholarship.
Supplementary Material
Supplemental data for this article can be accessed here.
Additional information
Funding
Related Research Data
References
- Barth A, Wanek LA, Morton DL. Prognostic factors in 1,521 melanoma patients with distant metastases. J Am Coll Surg. 1995;181:193–201.
- Balch CM, Gershenwald JE, Soong SJ, Thompson JF, Atkins MB, Byrd DR, Buzaid AC, Cochran AJ, Coit DG, Ding S, et al. Final version of 2009 AJCC melanoma staging and classification. J Clin Oncol. 2009;27:6199–6206. doi:10.1200/JCO.2009.23.4799.
- Wolchok JD, Chiarion-Sileni V, Gonzalez R, Rutkowski P, Grob JJ, Cowey CL, Lao CD, Wagstaff J, Schadendorf D, Ferrucci PF, et al. Overall survival with combined nivolumab and ipilimumab in advanced melanoma. N Engl J Med. 2017;377:1345–1356. doi:10.1056/NEJMoa1709684.
- Topalian SL, Sznol M, McDermott DF, Kluger HM, Carvajal RD, Sharfman WH, Brahmer JR, Lawrence DP, Atkins MB, Powderly JD, et al. Survival, durable tumor remission, and long-term safety in patients with advanced melanoma receiving nivolumab. J Clin Oncol. 2014;32:1020–1030. doi:10.1200/JCO.2013.53.0105.
- Larkin J, Chiarion-Sileni V, Gonzalez R, Jj G, Cl C, Cd L, Schadendorf D, Dummer R, Smylie M, Rutkowski P, et al. Combined nivolumab and ipilimumab or monotherapy in untreated melanoma. N Engl J Med. 2015;373:23–34. doi:10.1056/NEJMoa1504030.
- Taube JM, Anders RA, Young GD, Xu H, Sharma R, McMiller TL, Chen S, Klein AP, Pardoll DM, Topalian SL, et al. Colocalization of inflammatory response with B7-h1 expression in human melanocytic lesions supports an adaptive resistance mechanism of immune escape. Sci Transl Med. 2012;4:127ra37. doi:10.1126/scitranslmed.3003689.
- Sharma P, Hu-Lieskovan S, Wargo JA, Ribas A. Primary, adaptive, and acquired resistance to cancer immunotherapy. Cell. 2017;168:707–723. doi:10.1016/j.cell.2017.01.017.
- Ferlazzo G, Moretta L. Dendritic cell editing by natural killer cells. Crit Rev Oncog. 2014;19:67–75.
- Pallmer K, Oxenius A. Recognition and regulation of T cells by NK cells. Frontiers in Immunology. 2016;7:251.
- Battaglia A, Ferrandina G, Buzzonetti A, Malinconico P, Legge F, Salutari V, Scambia G, Fattorossi A. Lymphocyte populations in human lymph nodes. Alterations in CD4 + CD25 + T regulatory cell phenotype and T-cell receptor Vbeta repertoire. Immunology. 2003;110:304–312.
- Budczies J, Klauschen F, Sinn BV, Gyorffy B, Schmitt WD, Darb-Esfahani S, Denkert C, van Diest P. Cutoff finder: a comprehensive and straightforward web application enabling rapid biomarker cutoff optimization. PLoS One. 2012;7:e51862. doi:10.1371/journal.pone.0051862.
- Rinfret A, Anderson SK. IL-2 regulates the expression of the NK-TR gene via an alternate RNA splicing mechanism. Mol Immunol. 1993;30:1307–1313.
- Sedelies KA, Sayers TJ, Edwards KM, Chen W, Pellicci DG, Godfrey DI, Trapani JA. Discordant regulation of granzyme H and granzyme B expression in human lymphocytes. J Biol Chem. 2004;279:26581–26587. doi:10.1074/jbc.M312481200.
- Fellows E, Gil-Parrado S, Jenne DE, Kurschus FC. Natural killer cell-derived human granzyme H induces an alternative, caspase-independent cell-death program. Blood. 2007;110:544–552. doi:10.1182/blood-2006-10-051649.
- Riaz N, Havel JJ, Makarov V, Desrichard A, Urba WJ, Sims JS, Hodi FS, Martín-Algarra S, Mandal R, Sharfman WH, et al. Tumor and microenvironment evolution during immunotherapy with nivolumab. Cell. 2017;171:934–49 e15. doi:10.1016/j.cell.2017.09.028.
- Vivier E, Ugolini S, Blaise D, Chabannon C, Brossay L. Targeting natural killer cells and natural killer T cells in cancer. Nat Rev Immunol. 2012;12:239–252. doi:10.1038/nri3174.
- Kakavand H, Jackett LA, Menzies AM, Gide TN, Carlino MS, Saw RPM, Thompson JF, Wilmott JS, Long GV, Scolyer RA. Negative immune checkpoint regulation by VISTA: a mechanism of acquired resistance to anti-PD-1 therapy in metastatic melanoma patients. Mod Pathol. 2017;30:1666–1676. doi:10.1038/modpathol.2017.89.
- Kohlhapp FJ, Broucek JR, Hughes T, Huelsmann EJ, Lusciks J, Zayas JP, Dolubizno H, Fleetwood VA, Grin A, Hill GE, et al. NK cells and CD8 + T cells cooperate to improve therapeutic responses in melanoma treated with interleukin-2 (IL-2) and CTLA-4 blockade. J Immunother Cancer. 2015;3:18. doi:10.1186/s40425-015-0063-3.
- Beldi-Ferchiou A, Lambert M, Dogniaux S, Vely F, Vivier E, Olive D, Dupuy S, Levasseur F, Zucman D, Lebbé C, et al. PD-1 mediates functional exhaustion of activated NK cells in patients with Kaposi sarcoma. Oncotarget. 2016;7:72961–72977. doi:10.18632/oncotarget.12150.
- Eisenhauer EA, Therasse P, Bogaerts J, Schwartz LH, Sargent D, Ford R, Dancey J, Arbuck S, Gwyther S, Mooney M, et al. New response evaluation criteria in solid tumours: revised RECIST guideline (version 1.1). Eur J Cancer. 2009;45:228–247. doi:10.1016/j.ejca.2008.10.026.
- Love MI, Huber W, Anders S. Moderated estimation of fold change and dispersion for RNA-seq data with DESeq2. Genome Biol. 2014;15:550. doi:10.1186/s13059-014-0550-8.
- Anders S, Pyl PT, Huber W. HTSeq–a Python framework to work with high-throughput sequencing data. Bioinformatics. 2015;31:166–169. doi:10.1093/bioinformatics/btu638.