
ABSTRACT
As key players in HCC antitumor response, the functions of tumor infiltrated CD8+ T cells are significantly affected by surrounding microenvironment. A detailed profiling of their genomic and transcriptional changes could provide valuable insights for both future immunotherapy development and prognosis evaluation. We performed whole exome and transcriptome sequencing on tumor infiltrated CD8+ T cells and CD8+ T cells isolated from other tissue origins (peritumor tissues and corresponding PBMCs) in eight treatment-naive HCC patients. The results demonstrated that transcriptional changes, rather than genomic alterations were the main contributors to the functional alterations of CD8+ T cells in the process of tumor progression. The origins of CD8+ T cells defined their transcriptional landscape, while the tumor infiltrated CD8+ T cells shared more similarity with peritumor-derived CD8+ T cells compared with those CD8+ T cells in blood. In addition, tumor infiltrated CD8+ T cells also showed larger transcriptional heterogeneity among individuals, which was modulated by clinical features such as HBV levels, preoperative anti-viral treatment and the degree of T cell infiltration. We also identified multiple inter-connected pathways involved in the activation and exhaustion of tumor infiltrated CD8+ T cells, among which IL-12 mediated pathway could dynamically reflect the functional status of CD8+ TILs and activation of this pathway indicated a better prognosis. Our results presented an overview picture of CD8+ TILs’ genomic and transcriptional landscape and features, as well as how the functional status of CD8+ TILs correlated with patients’ clinical course.
Introduction
Hepatocellular carcinoma (HCC), which is considered as the most common primary liver malignancy in China, ranks the third among the causes of cancer mortality.Citation1 At present, treatment of HCC, still faced great challenges.Citation2 Cancer immunotherapies are under rapid development, providing a promising strategy to deal with various cancers by boosting the body’s natural immune response.Citation3 CD8+ T cells are the essential effector cells in antitumor immunityCitation4 and generation of CD8+ cytotoxic T lymphocytes (CTLs) is one of the major immunity response for encountering tumor progression and possible hepatitis virus infection. When migrated into tumor, these CD8+ Tumor-infiltrating lymphocytes (TILs) become the first line of defense, with their abundance closely correlating to patients’ prognosis and clinical outcomes.Citation5
To resist adaptive immunity, HCC developed multiple mechanisms to hamper the induction of functional TILs. One of the mechanisms is cancer immunoediting, which reshapes tumor immunogenicity via evolutionary selection of mutations with weak immunogenicity,Citation6 leading to tumor escape from immune surveillance.Citation7 Besides, when entering into the tumor microenvironment, under the pressure provided by tumor cells as well as inflammatory background, the tumor-infiltrating effector T cells often become ‘exhausted’.Citation8 Exhaustive T cells only retained impaired effector functions, which often lead to dysfunction in tumor cytotoxicity. Studies have been conducted to investigate how T cell exhaustion come to place, and several intrinsic mechanisms have been discovered. The lack of proper expression of co-stimulatory molecules (such as CD80 and CD86) can prevent T cells’ normal activation, while the existence of high level inhibitory receptors further worsens the scenario.Citation9 Several different types of co-inhibitory signals, such as PD-1and CTLA-4, have already been identified in past decades, and the blockade of these inhibitory receptors can restore or even further enhance T cell function in cancers.Citation10 At present, immunotherapies to block the checkpoints of T cells, have achieved effective immune response in several cancer types, but there are limited clinical response in HCC, which may be resulted from the chronic HBV-mediated immunosuppression.Citation11
To improve the immunotherapy based on tumor-infiltrated CD8+ T cells, the functional diversity of CD8+ TILs in HCC and the underlying mechanisms should be fully investigated. Recent study from Chunhong Zheng et al. discovered the functional composition of T cells in HCC by transcriptome analysis, demonstrating a comprehensive picture of T cell subpopulations. However, crosstalk between pathways involved in functional alteration of CD8+ TILs and their clinical relevance have not been thoroughly discussed. Here, we present an extensive analysis of CD8+ TILs’ multi-dimensional profile including both genomic and transcriptional levels to reveal the functional heterogeneity, clinical relevance and transcriptional features of CD8+ TILs. Tumor, peritumor tissues and match PBMCs were collected from 8 HCC patients with clinical variety to investigate the dynamic changes of CD8+ TILs’ cell function, which could provide valuable knowledges for future prognosis evaluation and immunotherapy development in HCC treatment.
Results
Genomic and transcriptional landscape of CD8+ T cells in HCC patients
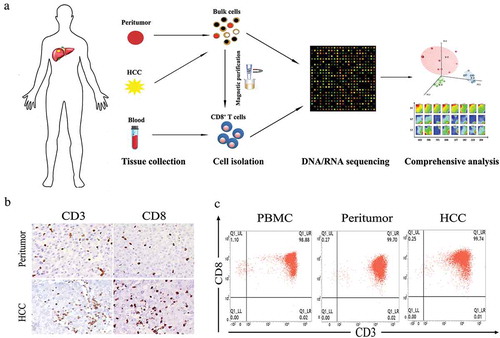
To investigate the multi-dimensional landscape of CD8+ T cells in HCC patients, eight treatment-naive patients diagnosed with HCC were enrolled. Detailed information regarding to patients’ clinical information is available in . Tumor tissues, peritumor tissues and matched PBMCs were collected and the CD8+ T cells from these origins were isolated respectively (). The presence of infiltrating CD8+ T cells in HCC tissues as well as peritumor tissues was confirmed using immunohistochemistry (IHC) with CD3 and CD8 antibodies ( and Figure S1). Isolated CD8+ T cells with high purity (≥ 90%) were subjected to whole exome and transcriptome sequencing ().
Table 1. Clinical characteristics of HCC patients in present study.
Figure 1. Isolation and purification of CD8+ T cells from HCC patients. (a) Flow chart of study design. (b) Representative immunohistochemistry staining images of CD3 and CD8 for HCC and peritumoral biopsies from patient 2129. (c) Representative flow cytometry plots of CD8+ T cells collected from different tissue origins after MACs purification.
Somatic alteration identification revealed extremely low burden of mutations in both CD8+ TILs and peritumor-derived CD8+ T cells ( and ). Detailed information of somatic SNPs and CNVs was listed in online supplementary Table S1. The low burden and relatively low frequency (88% of the somatic mutations occur at mutation frequencies of less than 0.2, Table S2) of the somatic mutations in CD8+ TILs and peritumor-derived CD8+ T cells indicated that the genome of CD8+ T cells did not change significantly compared with corresponding PBMCs and thus might have limited contribution to functional variation.
Figure 2. Genomic and transcriptomic landscapes of CD8+ T cells from different origins in HCC patients. (a and b) Circos plots of somatic SNVs and CNVs. Somatic SNVs and CNVs identified in CD8+T cells from tumor and peritumor tissues of all the eight patients were shown. The outermost ring shows the chromosome location. Black spots indicate somatic mutations, blue/red lines represent somatic deletions/duplications respectively. (c) The X axis represents the fold changes of gene expression between peritumor-derived CD8+ T cells versus PBMC-derived CD8+ T cells while the Y axis represents the fold changes between CD8+ TILs versus peritumor-derived CD8+ T cells. Genes significantly differentially expressed (adjusted P < 0.05) in both comparisons were colored with red, and genes only showed significant different expression in either CD8+ TILs vs peritumor-derived CD8+ T cells or peritumor-derived CD8+ T cells vs PBMC-derived CD8+ T cells were colored with blue and golden respectively. Other genes were colored with grey. (d) PID pathway analysis of DE genes. The outline color of each node represents the normalized significance for comparison between peritumor-derived CD8+ T cells and PBMC-derived CD8+ T cells while the inner color represents that of comparison between CD8+ TILs and peritumor-derived CD8+ T cells. Nodes are connected if the genes within two pathways were significantly overlapped (Fisher’s exact test P < 0.05). (e) Heatmap of normalized FPKM of DE genes within IL-12 mediated signal pathway.
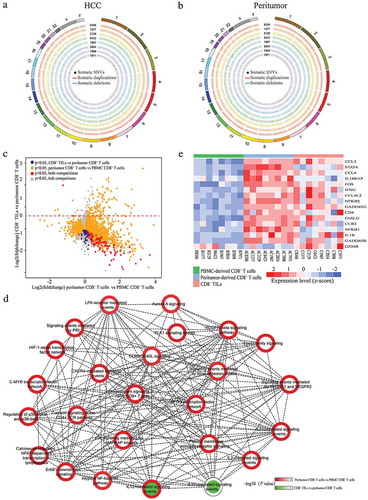
To explore whether changes on transcriptional level affect CD8+ T cells’ function in different microenvironments, differentially expressed (DE) genes among CD8+ T cells from different tissue origins were extracted. The existence of large amount of DE genes between CD8+ TILs/peritumor-derived CD8+ T cells and corresponding PBMC-derived CD8+ T cells clearly demonstrated significant differences on transcriptome level (2200 and 3919 DE genes, respectively, ), while CD8+ TILs and peritumor-derived CD8+ T cells exhibited more similarity on expression patterns (162 DE genes, ). Furthermore, for DE genes identified from comparisons of either CD8+ TILs vs PBMC-derived CD8+ T cells or peritumor-derived CD8+ T cells vs PBMC-derived CD8+ T cells, pathway analysis was conducted to understand how the expression profile changes impacted different biological pathways. Significant enrichment of multiple inter-connected pathways focusing on “downstream signaling of naive CD8+ T cells” was discovered (), indicating the functional changes of CD8+ TILs and peritumor-derived CD8+ T cells were triggered by naive CD8+ T cell related signal alterations. Interestingly, “IL-12 mediated signaling events” was the only pathway enriched in DE genes identified in both comparisons, suggesting the importance of this pathway during the entire process of adaptive immunity. Most DE genes involved in IL-12 mediated signaling events were up-regulated in peritumor-derived CD8+ T cells while down-regulated in CD8+ TILs (). Intriguingly, expression pattern of this pathway was in well consistence with T cell functional status since peritumoral immune cells exhibited activated phenotypes for battling against tumor cells,Citation12 while T cells in HCC tumor tissue were more likely to display exhausted phenotypes.Citation8
Principal component analysis revealed how microenvironment affect CD8+ TILs’ transcriptome profiles
Given the complicated interactions among the biological pathways identified in T cells from different tissue origins, principal component analysis (PCA) of transcriptome data was carried out to provide a more in-depth description of the CD8+ T cells’ function. As demonstrated in , CD8+ TILs, peritumor-derived CD8+ T cells and PBMC-derived CD8+ T cells could be well separated by the first three principal components (PCs), indicating the inherent transcriptional similarities of CD8+ T cells within the same tissue origin. PC1, which accounted for 23.9% of the total variance, could clearly separate PBMC-derived CD8+ T cells from the CD8+ T cells resided in tumor or peritumor tissue (P < 0.001). Although PC2 accounted for 16.8% of the total variance, no significant difference could be observed among different groups (P = 0.49). Furthermore, PC3 (accounted for 11.5% of the total variance) could nicely separate CD8+ TILs from peritumor-derived CD8+ T cells, with all CD8+ TILs from different patients have higher PC3 scores (P < 0.001). This excellent separation of CD8+ T cells from different tissue origins indicated that PC1 and PC3 might reflect the transcriptome changes affected by surrounding microenvironment.
Figure 3. PCA analysis on transcription profiles of CD8+ T cells. (a) The left subplot showed the distribution of CD8+ T cells from different tissue origins according to the first three PCs. Blue dots represent PBMC-derived CD8+ T cells, green dots represent peritumor-derived CD8+ T cells and red dots represent CD8+ TILs. The right subplot showed the relationship between tissue origin of CD8+ T cells and the three PCs, the significance was examined by one-way ANOVA. (b) Heatmap of normalized FPKM of genes that most correlated to PC1 and PC3. For better visualization, only top ten most correlated genes were shown in left subplot. Additionally, histone genes, HSPs and cell proliferation regulator genes positively correlated to PC3 were also shown in the right subplot. (c) The left subplot showed PC3 score of peritumor-derived CD8+ T cells (green) and PBMC-derived CD8+ T cells (red) from each patient. The right subplot displayed the correlation between PC1/PC3 scores and expression of known signatures of CD8+ T cell subtypes from HCC patients.Citation13 Spearman’s rank correlation was performed and significant correlations (P < 0.05) were colored according to their correlation coefficient.
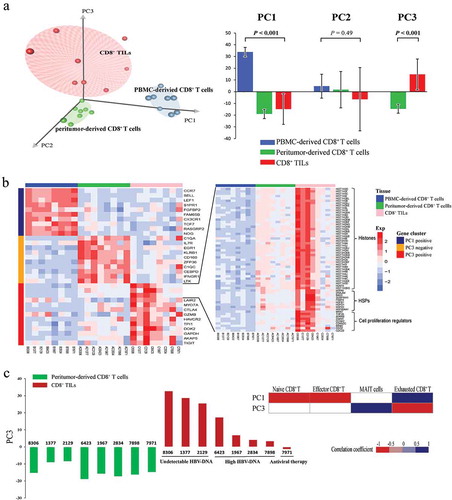
To further explore these two PCs, their most correlated genes were extracted. No surprising, genes significantly positively correlated with PC1 were overexpressed in PBMC-derived CD8+ T cells. These genes included two categories of T cell markers: naive T cell markers such as CCR7, SELL and LEF1, and effector T cell markers such as FGFBP2 and CX3CR1 ().Citation13–Citation15 As expected, PC1 scores were positively correlated with naive and effector CD8+ T cell signatures (). These results supported the idea that naive and effector T cells were two main components of CD8+ T cells from PBMCs, which is in consistence with previous report.Citation13
PC3 correlated genes could be divided into two groups with distinct expression tendency in CD8+ TILs and peritumor-derived CD8+ T cells. Genes negatively correlated to PC3 were significantly up-regulated in peritumor-derived CD8+ T cells, which included genes acting as inhibitors of inflammation or immune system, such as C1QA, C1QC, CEBPD,Citation16,Citation17 together with some pro-inflammatory factors such as EGR1, CD161.Citation18,Citation19 These results indicated that this part of PC3 could reflect the balance of pro- and anti-inflammatory process, which has been reported to play a crucial role in immunity response involved in protecting human body from inflammatory disease.Citation20,Citation21 Interestingly, PC3 was also negatively correlated with HCC mucosal-associated invariant T (MAIT) cell signature (), indicating an enrichment of MAIT cells within CD8+ T cells from peritumor. On the other hand, genes positively correlated with PC3 showed significantly higher expression in CD8+ TILs, which consisted of genes related to both T cell exhaustion and proliferation. In this cluster of genes, several T cell exhaustion associated genes including HAVCR2 (also known as TIM-3), CTLA4 and TIGHT were identified.Citation22 Furthermore, PC3 also showed positive correlation with exhaustive CD8+ T cell signature (). Moreover, other genes in this cluster were closely related to DNA synthesis and T cell proliferation, including histones, heat shock proteins (HSP), and many other key regulators involved in cell proliferation such as TOP2A and MKI67 (also known as Ki-67).Citation23
Interestingly, three patients with undetectable levels of serum HBV-DNA have the highest PC3 scores (sample 8306, 1377, 2129), with relatively higher expression levels of genes representing T cell exhaustion and proliferation. The higher expression levels of proliferation associated genes in CD8+ TILs may reflect the existence of more HBV-specific CD8 + T cells, which is required to sustain low levels of HBV. Likewise, hepatitis B patients with lower levels of HBV have also been reported to possess higher fraction of HBV-specific CD8 + T cells.Citation24 Moreover, co-expression of proliferation and exhaustion markers indicate that these two important biological processes of CD8+ T cells might be somehow linked. Additionally, the CD8+ TILs from the patient who received antiviral therapy (entecavir) before surgery (sample 7971) have the lowest PC3 scores, with the lowest expression of exhaustion genes and the highest expression of effector T cell markers. This result is in consistent with previous reports that T cells could be activated by antiviral drugs such as abacavir.Citation25 Collectively, our analysis revealed that HBV burden and antiviral therapy might affect T cell functional status in HCC and further studies with larger sample size may be valuable.
Transcriptional similarity and heterogeneity of CD8+ T cells in HCC patients
As demonstrated above, T cell function alterations showed great variety among different HCC patients. To intuitively visualize the transcriptional similarities and differences of each individuals, SOM analysis was conducted by translating transcriptional data into 1600 metagenes representing sets of co-expressed genes. The landscape of expression portraits for each CD8+ T cells was shown in . Clustering samples according to these 1600 metagenes demonstrated that CD8+ T cells from the same tissue origin were usually transcriptionally similar ( and ), while CD8+ TILs exhibited significant transcriptional heterogeneity, which is related to their clinical features.
Figure 4. Transcriptional similarity and heterogeneity of CD8+ T cells. (a) SOM analysis results showing the expression pattern of each sample. Grey rectangles indicate significantly upregulated spots for each sample. (b) Sample clustering according to all the metagenes. (c) Distribution of all identified significantly regulated spots. (d) Sample level enrichment scores of each spot.
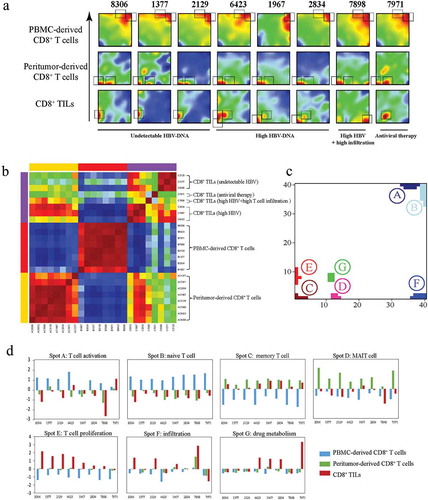
In general, seven statistically differentially expressed spots (labeled A-G) were identified (), and each of them were named according to the gene set enrichment analysis of the protein coding genes within the spots, namely: A) naive T cell, B) Effector T cell C) memory T cell, D) MAIT cell, E) T cell proliferation, F) drug metabolism, G) infiltration (Detailed annotation information of the spots were provided in and Table S3). Sample level enrichment of each spot was shown in .
Generally, all plasma CD8+ T cells displayed similar expression patterns, with all of them consistently overexpressing spot A and most (7/8) of them also overexpressing spot B. As to spot A, enrichment analysis showed significant overlap with several known naive CD8+ T cell associated signatures (Table S3). Spot B shows significant overlap with HCC effector CD8+ T cell signature, accompanied with significant enrichment in multiple integrin related pathways, suggesting that integrins are crucial for effector T cell function. This observation is in consistent with previous report that several members of integrin family take part into effector T cells’ migration.Citation26 Furthermore, the specially presence of spot A and spot B in plasma CD8+ T cells confirmed the idea that naive and effector T cells were prevalent in PBMCs.
On the other hand, peritumor-derived CD8+ T cells were characterized by increased expression of spot C and spot D. Genes from spot C were significantly overlapped with several memory CD8+ T cell signatures. The higher density of memory T cells in peritumor has been reported in previous studies.Citation27 Furthermore, spot D, which was specially expressed in peritumor-derived CD8+ T cells, represented the functional status of MAIT cells. MAIT cells are highly enriched in liver tissue and was considered as the first line of defense against viral infections.Citation28 These results suggested that MAIT cells were enriched in peritumor tissue and diminished in HCC tissue, indicating an impaired immune microenvironment in HCC tissue. Interestingly, peritumor-derived CD8+ T cells from patients with undetectable levels of serum HBV-DNA (patient 8306, 1377, 2129) and the patient received antiviral therapy (patient 7971) have higher expression levels of spot D, further proving the importance of MAIT cells in viral infection control.
Large heterogeneity was observed for CD8+ TILs, showing four spots of differentially expressed genes (C, E, F and G). For 3 of 4 patients with high level of serum HBV (patient 6423, 1967 and 2834), spot C (memory T cell spot) was reserved but expressed at a lower level in CD8+ TILs compared to corresponding peritumor-derived CD8+ T cells, indicating high level of serum HBV might benefit the retainment of memory T cells in tumor microenvironment
Meanwhile, CD8+ TILs from patients with undetectable level of serum HBV all have increased expression level of spot E, which was characterized by enriched cell proliferation related genes, including numerous histones, HSPs genes, both are critical for DNA synthesis, and some classical proliferation markers such as TOP2A and MKI67.Citation23 Spot E was largely resembled to PC3 positive correlated gene cluster, and both of them were upregulated in patients with undetectable serum HBV level. In addition, spot E was significant overlapped with two CD8+ effector T cell associated gene clusters,Citation29 suggesting a more cytotoxic phenotype of CD8+ TILs from patients with undetectable serum level of HBV.
Interestingly, patient 7898, the only patient with large amounts of T cell infiltration in tumor tissue (Figure S1 and ), showed dramatic upregulation of spot F. No CD8+ T cell signature was significantly enriched for spot F, while PID pathway enrichment analysis revealed that this spot contained genes involved in T cell infiltration associated pathways including “CXCR3-mediated signaling events” and “IL6-mediated signaling events”.Citation30,Citation31
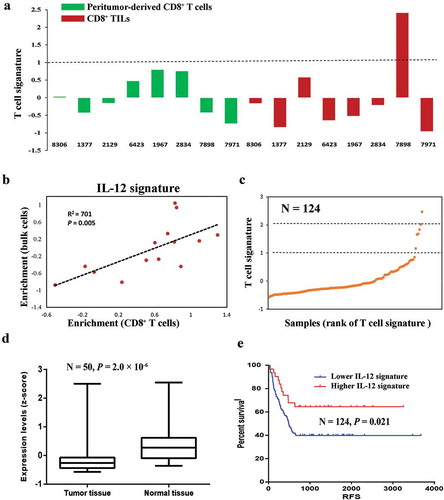
Figure 5. Downregulation of IL12-mediated signal events is associated with worse clinical outcome. (a) T cell signature enrichment of peritumor-derived CD8+ T cells (green) and CD8+ TILs cells (red) from each patient using expression profiles of bulk cells. (b) Correlation of IL-12 signature enrichment between CD8+ T cells and corresponding bulk cells. P value and coefficient of correlation were calculated using spearman’s rank correlation. (c) Scatter plot of T cell signature enrichment of TCGA samples included in survival analysis (N = 124). (d) Expression levels of IL-12 signature in HCC tissues and paired peritumor tissues from TCGA data set (N = 50). P values were evaluated by Wilcoxon matched-pairs singed rank test. (e) Kaplan–Meier plot of HCC patients stratified by IL-12 signature expression levels (N = 124). Patients expressing higher levels (higher than 75th percentile) of IL-12 signature had better disease-free survival than other patients (log-rank P = 0.021).
The only patient who have received antiviral therapy before surgery (patients 7971) was characterized by overexpression of spot G. Though no known CD8+ T cell signature was significantly overlapped with spot G, GO analysis indicated that this spot was closely related to “drug metabolic process”. Interestingly, spot G contained multiple Cytochrome P450s (CYP) genes such as CYP2D6, CYP2E1 and CYP3A4, all of which play critical roles in drug metabolism.Citation32 Their existence may reflect the influence of the antiviral treatment.
Intriguingly, CD8+ TILs from patient 6423 showed overexpression of three spots (C, E and F) simultaneously. Since sample 6423 had largest tumor and his tumor had occupied in multiple regions of liver including liver segments IV, VI, VII and VIII), we speculated that his clinical conditions could lead to higher heterogeneity of TILs.
The above results demonstrated that the CD8+ TILs’ functional phenotype was greatly influenced by patients’ clinical course, which in turn could result in different clinical outcomes.
Clinical correlation between IL12-mediated pathway and HCC prognosis
Since IL-12 mediated pathway has been identified in two of these spots (spot C and spot D) that closely related to CD8+ T cell phenotype, and its vital function has been also demonstrated in DE gene analysis, we further investigated how this pathway correlated with patients’ prognosis. Genes involved in IL-12 mediated pathway within spot C and spot D were extracted and defined as IL-12 signature. Since most of IL-12 signature genes were interleukins, chemokines and TNFs, which are mostly exclusively expressed in T cells, we hypothesized that bulk sequencing of corresponding tissue samples could reflect their expression in CD8+ T cells. This hypothesis was confirmed by the significant correlation of the expression patterns in CD8+ T cells and tissue samples except patient 7898 (P = 0.005, correlation coefficient = 0.701, ). However, extremely high pan-T cell infiltration in HCC tissue of this patient was observed by immunohistochemistry (IHC) staining (Figure S1), which could explain the disruption of correlation. A pan-T cell signature consisted of 13 genes was also adopted to evaluate the T cell infiltration degree via bulk sequencing data,Citation33 which provided consistent results to show high pan-T cell infiltration level in HCC tissue of patient 7898 (). Further analysis with TCGA dataset also suggested the existence of a very small proportion of HCC patients with high level of T cell signature related to T cell infiltration (). We then compared the expression levels of IL-12 pathway with patients’ prognosis using TCGA data. Interestingly, we find significantly decreased expression levels of IL-12 signature in tumor tissue compared with peritumor tissue (P = 1.2 × 10⁻⁶,) and lower expression levels of IL−12 signature indicated a worse disease-free survival (log rank P = 0.021). The expression of IL−12 signature could reflect the functional activation of CD8+ T cells, which could be further utilized for both immunotherapy development and patients’ prognosis evaluation.
Discussion
Serving as an essential component of adaptive immunity, CD8+ T cells play important roles in antitumor immune responses.Citation4 Activation and dysfunction of T cells during the process of tumor progression have become the major focus of related research fields, particularly after breakthrough of immunotherapy in cancer treatment. Our analysis presented a detailed depiction for the dynamic change of CD8+ T cells from different origins on both genomic and transcriptional levels, showing that the functional alterations of TILs could greatly vary among patients.
After infiltrating into the inflammatory or cancer tissues, CD8+ T cells face the influence of the changed microenvironment.Citation8 The interaction between T cells and their surroundings can significantly affect their functions on multiple levels. Except the commonly known transcriptional alterations, the genome of CD8+ T cell is also under the pressure of mutational processes which is similar to somatic mutation accumulation in cancer cells. Our analysis did prove that small number of somatic mutations, including both SNVs and CNVs, can indeed take place on CD8+ T cell’s genome from both tumor tissues and peritumor tissues, however, the functional alterations caused by these mutations seem to be weak compared with transcriptional changes. On transcriptional level, similar transcriptome changes were observed when CD8+ T cells entered into tumor or peritumor tissues, indicating similar microenvironment surrounding T cells could shape the CD8+ T cells into similar transcriptomes or phenotypes. Our results identified multiple connected pathways involved in the functional regulation of T cells, among which IL-12 signaling pathway was one of the most important ones. The expression pattern of IL-12 pathway was in consistent with the expected T cell activity, since CD8+ T cells in peritumor were considered to be activated to against tumor invasion while become exhausted in HCC microenvironment.Citation12,Citation34 This correlation suggested that this pathway might dynamically reflect T cell functional status and could be utilized for T cell functional evaluation or immunotherapy development. Noteworthily, IL-12 also plays critical roles in natural killer (NK) cell activation,Citation35,Citation36 which might provide a paralleled/joint effect in tumor immunology. However, whether or how these two immunity mechanisms interact with each other still needs further investigations.
Substantial functional difference among TILs from different patients has been reported,Citation37 while our analysis further revealed that the difference of TIL function was greatly affected by patients’ clinical conditions including HBV-DNA level, anti-viral treatment and degree of infiltration. One intriguing fact is that HBV infection level might somehow reflect antitumor immune activity, since patients with low level of HBV tended to show higher expression of T cell proliferation signature. One possible explanation is that proliferation of CD8+ T cells might contribute to the low HBV-DNA microenvironment while excessive T cell proliferation lead to exhaustion. Consistent with our hypothesis, CD8+ T cells have been reported to play roles in viral control during hepatitis B virus infection, and higher frequency of HBV-specific CD8+ T cells have been detected in hepatitis B patients with a lower level of HBV replication.Citation38 Moreover, antiviral treatment also contribute to T cell functional alteration, since TILs from the patient who received antiviral treatment before surgery showed increased expression of effector T cell markers and reduced expression of T cell exhaustion markers. Previous reports have suggested that T cell would be activated by anti-HBV drugs such as abacavir,Citation25 and entecavir which has also been reported to improve the function of T cell immunity.Citation39 Additionally, several epidemiological investigations suggested that antiviral treatment could improve the survival and decrease the recurrence of HBV-related HCC.Citation40 Taken together, serum HBV level might be utilized for patients’ immunity response evaluation, while combine therapy with antiviral drugs in antitumor treatment could greatly benefit for T cell activation in HBV-related HCC patients.
In conclusion, our analysis revealed the multi-dimensional profiles of tumor infiltrated CD8+ T cells in HCC patients and demonstrated that how their functional change was related to patients’ clinical course. Our study also could further improve the fundamental understanding of CD8+ T cell functional alteration in HCC by discovering multiple inter-connected pathways in T cells activation. Selectively targeting the common hub genes in these pathways may provide a more effective strategy for future immunotherapy development.
Materials and methods
Sample collection
Eight HCC patients who received surgical operation in Mengchao Hepatobiliary Hospital of Fujian Medical University were recruited. None of these patients received any chemotherapy and radiation before surgical resection. Primary tumor tissue, paired peritumoral tissue (at least 2 cm away from the primary HCC lesion) and corresponding peripheral blood were collected after hepatectomy. A written informed consent was obtained from each participant. All of the study protocols were approved by the Institution Review Board of Mengchao Hepatobiliary Hospital of Fujian Medical University and were conducted according to the principles of the Declaration of Helsinki.
Single cell suspension preparation and CD8+ T cell purification
Fresh tumor and peritumor excisions were minced to small pieces in 35mm dishes, and then dispersed in 10 ml RPMI 1640 containing 0.1% type I collagenase (Solarbio, China, C8140), 0.01% hyaluronidase (Solarbio, China, D8030) and 0.002% DNA enzyme (Solarbio, China, D8070) at 37 ◦C for 30–40 min. Further filtering was conducted with 40μm BD Falcon Cell Strainer to remove undigested tissues. The cell suspensions were then washed and re-suspended with PBS. Isolation of mononuclear cells were conducted with discontinuous percoll density gradient centrifugation (density gradient: 30% and 60%) in 50ml tubes. The tubes were centrifuged at 800g for 20 min. Enriched cells between 60% percoll and 30% percoll solution were gathered, and washed with PBS. Matched peripheral blood mononuclear cells (PBMCs) were isolated from peripheral blood collected before surgery by Ficoll-Paque PLUS kit (GE Healthcare).
Afterwards, single-cell suspensions were incubated with anti-CD8 magnetic beads (Milteny, Germany, 130–045-201), according to the manufacturer’s protocol. The cells were then washed and separated using charged MACS columns (Milteny, Germany, 130–042-201). The columns were washed and the flow-through was discarded. The columns were then removed from the magnet and the CD8+ T cells were eluted from the column. Finally, the cells were stained with CD3+ and CD8+ antibody and subjected to FACS analysis for cell purity evaluation and CD8+ T cells with high purity (≥ 90%) were subjected to subsequent sequencing.
Exome and transcriptome sequencing
Total genomic DNA and RNA from acquired CD8+ T cells and corresponding tissue samples were extracted using QIAamp DNA mini Kit (Qiagen) and RNeasy Mini Kit (Qiagen) respectively. Exome regions of qualified DNA were enriched using Agilent SureSelect Human All Exon V6 Kit. Genomic DNA were subjected to DNA library preparation, and exome regions of qualified DNA were enriched using Agilent SureSelect Human All Exon V6 Kit. RNAseq libraries were prepared from total RNA with removal of ribosomal RNA (rRNA) according to manufacturer’s instruction. Both enriched exome and transcriptome libraries were sequenced by Ruibo (Beijing, China) on Illumina HiSeq3000 platform (paired end, 150 bp).
WES data analysis
All sequencing reads were first evaluated for sequencing quality to remove reads with low quality based on the following criteria: containing adaptor sequence; with > 10% ambiguous bases (N) of total read length; containing > 20% low quality base (base quality ≤ 20) of total read length. WES Sequencing read pairs were aligned to UCSC human reference genome hg19 (GRCh37) using BWA (v0.7.15) with default parameters. Possible PCR duplicates were marked and removed using Picard (v2.9.3).Citation41 Both local insertion/deletion (indel) realignment and base quality score recalibration were performed using Broad’s Genome Analysis Toolkit (GATK, v3.6). Somatic mutations of T cells were detected with Mutect2 in GATK (v3.6), using matched T cells from PBMC as normal reference.Citation42 Mutations were then further filtered with following criteria: ≥ 20X depth in both samples of comparison; variant reads ≥ 5 and variant allele frequency ≥ 10%. CopywriteR (v2.10.0) and cn.MOPS (v1.24.0) were used to infer somatic CNVs.Citation43,Citation44 For CopywriteR, bin size of 20 kb was used and the depth of coverage were corrected for both GC-content and mappability. The output of CopywriteR was further analyzed by circular binary segmentation (CBS) algorithm to determine segment mean value of each region. The cut-off value for duplications was set as segment mean value > 0.25, and deletions was set as segment mean value < −0.25. Meanwhile, cn.MOPS was run with default parameters and regions < 1kb were excluded. Finally, CNVs identified by CopywriteR with more than half segment overlapping with cn.MOPS results were included for further analysis.
Transcriptome data analysis
The quality control for raw sequencing reads were performed using the same criteria as WES data. Qualified reads were aligned to ribosomal rRNA sequences download from RNAcentral database.Citation45 Then unmapped reads were aligned to human genome reference (GRCh37) with GENCODE gene annotation using STAR.Citation46 LncRNAs were further defined as those with transcript biotypes of “antisense”, “3prime_overlapping_ncRNA”, “lincRNA”, “misc_RNA”, “processed_transcript”, “sense_intronic” and “sense_overlapping”. Transcripts shorter than 200 bp or showed low expression level (average reads count < 10 within all samples) were excluded. Protein coding genes were defined as those with gene biotype of “protein_coding” and genes with no mapped reads across all samples were removed. To quantify the expression levels for each gene, fragments per kilobase of exon per million mapped fragments (FPKM) were calculated. Differentially expressed protein coding genes and lncRNAs between different group of samples were identified using DESeq2,Citation47 and limma.Citation48 Significantly changed genes with adjusted p value < 0.05 (Benjamini-Hochberg correction) were selected for Pathway Interaction Database (PID) pathway enrichment using the web tool ConsensusPathDB.Citation49
Principal component analysis (PCA)
PCA was performed on log2-transformed expression matrix consisting of all the qualified protein coding genes and lncRNAs. The relationships between tissue origin of CD8+ T cells and the first three PCs were examined by one-way ANOVA. Top genes positively correlated with PC1/PC3 and negatively correlated with PC3 were extracted according to their coefficients of eigenvectors. To better characterize different PCs, the correlation between overall expression of reported signatures representing different subtypes of CD8+ T cells and the PC scores was evaluated by spearman’s rank correlation. Single-cell RNA-seq data for different subtype of HCC lymphocytes was download from Gene Expression Omnibus database (accession number: GSE98638).Citation13 Expression data of naive, effector, mucosal-associated invariant T (MAIT) cells and exhausted CD8+ T cells were subjected to subtype specific signature gene identification using prediction analysis for microarrays (PAM).Citation50 Top 50 genes with highest PAM scores within each subtype were then defined as signature genes for corresponding subtype of CD8+ T cells.
Self-organizing map (SOM) analysis
SOM analysis was conducted using R package oposSOMCitation51 with default parameters. A total of 20,000 RNAs including top 10,000 protein coding genes and 10,000 lncRNAs showing highest variance across all samples were selected for dimensionality reduction and clustering. Input transcriptional data were translated into 1600 metagenes, each of which represented a set of co-expressed genes and can be visualized by a two-dimensional 40 × 40 mosaic grid. Metagenes of similar expression patterns were clustered and localized in neighboring regions, forming so-called spots of co-expression modules. In addition, all CD8+ T cell samples were clustered by pairwise correlation clustering according to the expression of all the 1600 metegenes. Genes from each spot were extracted (FDR< 0.05) for PID pathway enrichment analysis using ConsensusPathDB.Citation49 Meanwhile, gene sets from aforementioned signatures of HCC CD8+ T cell subtypes,Citation13 CD8+ T cells related C7-immunologic signatures and C5-gene ontology (GO) gene sets taken from the Molecular Signatures Database (MSigDB) were also included for gene set enrichment by Fisher’s exact test. Gene sets with P < 10–10 were considered indicative. In addition, sample level enrichment score of each spot was calculated by single sample gene set enrichment (ssGSEA) using R package GSVA.
Prognostic assessment using TCGA data
RNA-seq and clinical data of HCC patients in The Cancer Genome Atlas (TCGA) was download from TCGA website (http://www.cancergenome.nih.gov). Patients with available transcriptome data for both tumor and adjacent normal tissues were extracted (N = 50) to examine the difference of IL-12 signature expression levels by Wilcoxon matched-pairs singed rank test.
In addition, patients with more than two years’ follow-up were extracted from TCGA dataset for survival analysis (N = 124). IL-12 signature expression level of each individual sample was calculated as the mean z-score of all signature genes. Survival curves of TCGA patients with high (> 75th percentile) or low (< 75th percentile) expression levels of IL-12 signature were estimated using the Kaplan-Meyer method, and the log-rank test was performed to examine the significance.
Author contributions
XL Liu, JF Liu, and ZX Cai - study concept and design; ZL Li, G Chen, and XQ Dong - patient selection and sample collection; HP Xu, YY Zeng, G Chen, LM Qiu and XQ Dong - clinical information collection; ZX Cai and XQ Dong - sequencing data acquisition; ZL Li and G Chen - analysis and interpretation of data; XL Liu and JF Liu - technical support, obtained funding and study supervision; all authors have read and edited the manuscript.
Declaration of interest statement
All authors declare no competitive interests related to this study.
Ethics approval
All of the study protocols were approved by the Institution Review Board of Mengchao Hepatobiliary Hospital of Fujian Medical University.
Supplemental Material
Download Zip (52.9 KB)Supplemental Material
Supplemental data for this article can be accessed here.
Additional information
Funding
References
- Chen W, Zheng R, Baade PD, Zhang S, Zeng H, Bray F, Jemal A, Yu XQ, He J. Cancer statistics in China, 2015. CA Cancer J Clin. 2016;66:115–132. doi:10.3322/caac.21338.
- Rahbari NN, Mehrabi A, Mollberg NM, Muller SA, Koch M, Buchler MW, Weitz J. Hepatocellular carcinoma: current management and perspectives for the future. Ann Surg. 2011;253:453–469. doi:10.1097/SLA.0b013e31820d944f.
- Prieto J, Melero I, Sangro B. Immunological landscape and immunotherapy of hepatocellular carcinoma. Nat Rev Gastroenterol Hepatol. 2015;12:681–700. doi:10.1038/nrgastro.2015.173.
- Apetoh L, Smyth MJ, Drake CG, Abastado JP, Apte RN, Ayyoub M, Starmann J, Tjwa M, Plate KH, Sültmann H, et al. Consensus nomenclature for CD8(+) T cell phenotypes in cancer. Oncoimmunology. 2015;4:e998538. doi:10.1080/2162402X.2015.1008371.
- Gabrielson A, Wu Y, Wang H, Jiang J, Kallakury B, Gatalica Z, Reddy S, Kleiner D, Fishbein T, Johnson L, et al. Intratumoral CD3 and CD8 T-cell densities associated with relapse-free survival in HCC. Cancer Immunol Res. 2016;4:419–430. doi:10.1158/2326-6066.CIR-15-0110.
- Matsushita H, Vesely MD, Koboldt DC, Rickert CG, Uppaluri R, Magrini VJ, Arthur CD, White JM, Chen Y-S, Shea LK, et al. Cancer exome analysis reveals a T-cell-dependent mechanism of cancer immunoediting. Nature. 2012;482:400–404. doi:10.1038/nature10755.
- Dunn GP, Bruce AT, Ikeda H, Old LJ, Schreiber RD. Cancer immunoediting: from immunosurveillance to tumor escape. Nat Immunol. 2002;3:991–998. doi:10.1038/ni1102-991.
- Jiang Y, Li Y, Zhu B. T-cell exhaustion in the tumor microenvironment. Cell Death Dis. 2015;6:e1792. doi:10.1038/cddis.2015.162.
- Wherry EJ, Kurachi M. Molecular and cellular insights into T cell exhaustion. Nat Rev Immunol. 2015;15:486–499. doi:10.1038/nri3862.
- Sharma P, Allison JP. Immune checkpoint targeting in cancer therapy: toward combination strategies with curative potential. Cell. 2015;161:205–214. doi:10.1016/j.cell.2015.03.030.
- Pardee AD, Butterfield LH. Immunotherapy of hepatocellular carcinoma: unique challenges and clinical opportunities. Oncoimmunology. 2012;1:48–55. doi:10.4161/onci.1.1.18344.
- Kuang DM, Zhao Q, Wu Y, Peng C, Wang J, Xu Z, Yin X-Y, Zheng L. Peritumoral neutrophils link inflammatory response to disease progression by fostering angiogenesis in hepatocellular carcinoma. J Hepatol. 2011;54:948–955. doi:10.1016/j.jhep.2010.08.041.
- Zheng C, Zheng L, Yoo JK, Guo H, Zhang Y, Guo X, Kang B, Hu R, Huang JY, Zhang Q, et al. Landscape of Infiltrating T Cells in Liver Cancer Revealed by Single-Cell Sequencing. Cell. 2017;169:1342–56 e16. doi:10.1016/j.cell.2017.05.035.
- Forster R, Davalos-Misslitz AC, Rot A. CCR7 and its ligands: balancing immunity and tolerance. Nat Rev Immunol. 2008;8:362–371. doi:10.1038/nri2297.
- Bailey SR, Nelson MH, Majchrzak K, Bowers JS, Wyatt MM, Smith AS, Neal LR, Shirai K, Carpenito C, June CH, et al. Human CD26(high) T cells elicit tumor immunity against multiple malignancies via enhanced migration and persistence. Nat Commun. 2017;8:1961. doi:10.1038/s41467-017-01867-9.
- Mascarell L, Airouche S, Berjont N, Gary C, Gueguen C, Fourcade G, Bellier B, Togbe D, Ryffel B, Klatzmann D, et al. The regulatory dendritic cell marker C1q is a potent inhibitor of allergic inflammation. Mucosal Immunol. 2017;10:695–704. doi:10.1038/mi.2016.87.
- Rustenhoven J, Scotter EL, Jansson D, Kho DT, Oldfield RL, Bergin PS, Mee EW, Faull RLM, Curtis MA, Graham SE, et al. An anti-inflammatory role for C/EBPdelta in human brain pericytes. Sci Rep. 2015;5:12132. doi:10.1038/srep12132.
- Ramana CV, Cheng GS, Kumar A, Kwon HJ, Enelow RI. Role of alveolar epithelial early growth response-1 (Egr-1) in CD8+ T cell-mediated lung injury. Mol Immunol. 2009;47:623–631. doi:10.1016/j.molimm.2009.09.001.
- Kleinschek MA, Boniface K, Sadekova S, Grein J, Murphy EE, Turner SP, Raskin L, Desai B, Faubion WA, de Waal Malefyt R, et al. Circulating and gut-resident human Th17 cells express CD161 and promote intestinal inflammation. J Exp Med. 2009;206:525–534. doi:10.1084/jem.20081712.
- Keane MP, Strieter RM. The importance of balanced pro-inflammatory and anti-inflammatory mechanisms in diffuse lung disease. Respir Res. 2002;3:5. doi:10.1186/rr177.
- Thakur A, Xue M, Stapleton F, Lloyd AR, Wakefield D, Willcox MD. Balance of pro- and anti-inflammatory cytokines correlates with outcome of acute experimental Pseudomonas aeruginosa keratitis. Infect Immun. 2002;70:2187–2197.
- Chen L, Flies DB. Molecular mechanisms of T cell co-stimulation and co-inhibition. Nat Rev Immunol. 2013;13:227–242. doi:10.1038/nri3405.
- Milde-Langosch K, Karn T, Muller V, Witzel I, Rody A, Schmidt M, Wirtz RM. Validity of the proliferation markers Ki67, TOP2A, and RacGAP1 in molecular subgroups of breast cancer. Breast Cancer Res Treat. 2013;137:57–67. doi:10.1007/s10549-012-2296-x.
- Sobao Y, Tomiyama H, Sugi K, Tokunaga M, Ueno T, Saito S, Fujiyama S, Morimoto M, Tanaka K, Takiguchi M. The role of hepatitis B virus-specific memory CD8 T cells in the control of viral replication. J Hepatol. 2002;36:105–115.
- Bell CC, Faulkner L, Martinsson K, Farrell J, Alfirevic A, Tugwood J, Pirmohamed M, Naisbitt DJ, Park BK. T-cells from HLA-B*57:01+ human subjects are activated with abacavir through two independent pathways and induce cell death by multiple mechanisms. Chem Res Toxicol. 2013;26:759–766. doi:10.1021/tx400060p.
- Lek HS, Morrison VL, Conneely M, Campbell PA, McGloin D, Kliche S, Watts C, Prescott A, Fagerholm SC. The spontaneously adhesive leukocyte function-associated antigen-1 (LFA-1) integrin in effector T cells mediates rapid actin- and calmodulin-dependent adhesion strengthening to ligand under shear flow. J Biol Chem. 2013;288:14698–14708. doi:10.1074/jbc.M112.430918.
- Gao Q, Zhou J, Wang XY, Qiu SJ, Song K, Huang XW, Sun J, Shi Y-H, Li B-Z, Xiao Y-S, et al. Infiltrating memory/senescent T cell ratio predicts extrahepatic metastasis of hepatocellular carcinoma. Ann Surg Oncol. 2012;19:455–466. doi:10.1245/s10434-011-1864-3.
- Kurioka A, Walker LJ, Klenerman P, Willberg CB. MAIT cells: new guardians of the liver. Clin Ttrans Immunol. 2016;5:e98. doi:10.1038/cti.2016.51.
- Luckey CJ, Bhattacharya D, Goldrath AW, Weissman IL, Benoist C, Mathis D. Memory T and memory B cells share a transcriptional program of self-renewal with long-term hematopoietic stem cells. Proc Natl Acad Sci U S A. 2006;103:3304–3309. doi:10.1073/pnas.0511137103.
- McLoughlin RM, Jenkins BJ, Grail D, Williams AS, Fielding CA, Parker CR, Ernst M, Topley N, Jones SA. IL-6 trans-signaling via STAT3 directs T cell infiltration in acute inflammation. Proc Natl Acad Sci U S A. 2005;102:9589–9594. doi:10.1073/pnas.0501794102.
- Li K, Zhu Z, Luo J, Fang J, Zhou H, Hu M, Maskey N, Yang G. Impact of chemokine receptor CXCR3 on tumor-infiltrating lymphocyte recruitment associated with favorable prognosis in advanced gastric cancer. Int J Clin Exp Pathol. 2015;8:14725–14732.
- Yang X, Zhang B, Molony C, Chudin E, Hao K, Zhu J, Gaedigk A, Suver C, Zhong H, Leeder JS, et al. Systematic genetic and genomic analysis of cytochrome P450 enzyme activities in human liver. Genome Res. 2010;20:1020–1036. doi:10.1101/gr.103341.109.
- Spranger S, Luke JJ, Bao R, Zha Y, Hernandez KM, Li Y, Gajewski AP, Andrade J, Gajewski TF. Density of immunogenic antigens does not explain the presence or absence of the T-cell-inflamed tumor microenvironment in melanoma. Proc Natl Acad Sci U S A. 2016;113:E7759–E7768. doi:10.1073/pnas.1609376113.
- Kuang DM, Peng C, Zhao Q, Wu Y, Chen MS, Zheng L. Activated monocytes in peritumoral stroma of hepatocellular carcinoma promote expansion of memory T helper 17 cells. Hepatology. 2010;51:154–164. doi:10.1002/hep.23291.
- Parihar R, Dierksheide J, Hu Y, Carson WE. IL-12 enhances the natural killer cell cytokine response to Ab-coated tumor cells. J Clin Invest. 2002;110:983–992. doi:10.1172/JCI15950.
- Sareneva T, Julkunen I, Matikainen S. IFN-alpha and IL-12 induce IL-18 receptor gene expression in human NK and T cells. J Immunol. 2000;165:1933–1938. doi:10.4049/jimmunol.165.4.1933.
- Weiss SA, Han SW, Lui K, Tchack J, Shapiro R, Berman R, Zhong J, Krogsgaard M, Osman I, Darvishian F. Immunologic heterogeneity of tumor-infiltrating lymphocyte composition in primary melanoma. Hum Pathol. 2016;57:116–125. doi:10.1016/j.humpath.2016.07.008.
- Webster GJ, Reignat S, Brown D, Ogg GS, Jones L, Seneviratne SL, Williams R, Dusheiko G, Bertoletti A. Longitudinal analysis of CD8+ T cells specific for structural and nonstructural hepatitis B virus proteins in patients with chronic hepatitis B: implications for immunotherapy. J Virol. 2004;78:5707–5719. doi:10.1128/JVI.78.11.5707-5719.2004.
- Zhang L, Wang Q, Zhao P, Hu X, Jiang Y. Effects of entecavir on peripheral blood lymphocyte profiles in chronic hepatitis B patients with suboptimal responses to adefovir. Clin Exp Pharmacol Physiol. 2014;41:514–523. doi:10.1111/cep.2014.41.issue-7.
- Huang S, Xia Y, Lei Z, Zou Q, Li J, Yang T, Wang K, Yan Z, Wan X, Shen F. Antiviral therapy inhibits viral reactivation and improves survival after repeat hepatectomy for hepatitis B virus-related recurrent hepatocellular carcinoma. J Am Coll Surg. 2017;224:283–93 e4. doi:10.1016/j.jamcollsurg.2016.11.009.
- DePristo MA, Banks E, Poplin R, Garimella KV, Maguire JR, Hartl C, Philippakis AA, Del Angel G, Rivas MA, Hanna M, et al. A framework for variation discovery and genotyping using next-generation DNA sequencing data. Nat Genet. 2011;43:491–498. doi:10.1038/ng.806.
- Cibulskis K, Lawrence MS, Carter SL, Sivachenko A, Jaffe D, Sougnez C, Gabriel S, Meyerson M, Lander ES, Getz G. Sensitive detection of somatic point mutations in impure and heterogeneous cancer samples. Nat Biotechnol. 2013;31:213–219. doi:10.1038/nbt.2514.
- Klambauer G, Schwarzbauer K, Mayr A, Clevert DA, Mitterecker A, Bodenhofer U, Hochreiter S. cn.MOPS: mixture of Poissons for discovering copy number variations in next-generation sequencing data with a low false discovery rate. Nucleic Acids Res. 2012;40:e69. doi:10.1093/nar/gks003.
- Kuilman T, Velds A, Kemper K, Ranzani M, Bombardelli L, Hoogstraat M, Nevedomskaya E, Xu G, de Ruiter J, Lolkema MP. CopywriteR: DNA copy number detection from off-target sequence data. Genome Biol. 2015;16:49. doi:10.1186/s13059-015-0667-4.
- The RC. RNAcentral: a comprehensive database of non-coding RNA sequences. Nucleic Acids Res. 2017;45:D128–D34. doi:10.1093/nar/gkw1008.
- Dobin A, Davis CA, Schlesinger F, Drenkow J, Zaleski C, Jha S, Batut P, Chaisson M, Gingeras TR. STAR: ultrafast universal RNA-seq aligner. Bioinformatics. 2013;29:15–21. doi:10.1093/bioinformatics/bts635.
- Love MI, Huber W, Anders S. Moderated estimation of fold change and dispersion for RNA-seq data with DESeq2. Genome Biol. 2014;15:550. doi:10.1186/s13059-014-0550-8.
- Ritchie ME, Phipson B, Wu D, Hu Y, Law CW, Shi W, Smyth GK. limma powers differential expression analyses for RNA-sequencing and microarray studies. Nucleic Acids Res. 2015;43:e47. doi:10.1093/nar/gkv007.
- Kamburov A, Stelzl U, Lehrach H, Herwig R. The ConsensusPathDB interaction database: 2013 update. Nucleic Acids Res. 2013;41:D793–800. doi:10.1093/nar/gks1055.
- Tibshirani R, Hastie T, Narasimhan B, Chu G. Diagnosis of multiple cancer types by shrunken centroids of gene expression. Proc Natl Acad Sci U S A. 2002;99:6567–6572. doi:10.1073/pnas.082099299.
- Loffler-Wirth H, Kalcher M, Binder H. oposSOM: R-package for high-dimensional portraying of genome-wide expression landscapes on bioconductor. Bioinformatics. 2015;31:3225–3227. doi:10.1093/bioinformatics/btv342.