
ABSTRACT
Although pediatric malignant extracranial germ-cell tumors (meGCTs) are among the most chemosensitive solid tumors, a group of patients relapse and die of disease. To identify new markers predicting clinical outcome, we examined the prognostic relevance of tumor-infiltrating T lymphocytes (TILs) and the expression of PD-1 and PD-L1 in a cohort of pediatric meGCTs by in situ immunohistochemistry. MeGCTs were variously infiltrated by T cell-subtypes according to the tumor subtype, tumor location and age at diagnosis. We distinguished three different phenotypes: i) tumors not infiltrated by T cells (immature teratomas and half of the yolk sac tumors), ii) tumors highly infiltrated by CD8+ T cells expressing PD-1, which identifies activated tumor-reactive T cells (seminomas and dysgerminomas), iii) tumors highly infiltrated by CD8+ T cells within an immunosuppressive tumor microenvironment characterized by CD4+FOXP3+ Treg cells and PD-L1-expressing tumor cells (embryonal carcinomas, choriocarcinomas and the remaining yolk sac tumors). Tumor subtypes belonging mixed meGCTs were variously infiltrated, suggesting the coexistence of multiple immune microenvironments either facilitating or precluding the entry of T cells.
These findings support the hypothesis that TILs influence the development of meGCTs and might be of clinical relevance to improve risk stratification and the treatment of pediatric patients.
Introduction
Tumor-infiltrating immune cells play a key role in controlling tumor development.Citation1 T lymphocytes are the most abundant and best-characterized immune cells in the tumor microenvironment (TME).Citation2 High density of tumor-infiltrating cytotoxic CD8+ T cells, CD45RO+ memory T cells and CD4+ helper T cells has been associated with good prognosis in various cancers.Citation2,Citation3 On the contrary, high density of forlhead box protein 3-positive (FOXP3+) CD4+ tumor-infiltrating T lymphocytes (TILs), namely regulatory T (Treg) cells, known to suppress antitumor immunity by affecting proliferation and activation of cytotoxic CD8+ T cells, has been associated with worse prognosis in several types of cancers.Citation4–Citation7 The spatial distribution of effector T cells in the center and/or at the margin of the tumors has also a prognostic value, with high density of CD8+ TILs in both regions predicting better patient survival.Citation8–Citation10 According to the immune topography, human tumors can be grouped in three immune phenotypes termed ‘immune-desert’, ‘immune-excluded’ and ‘inflamed’ tumors.Citation11,Citation12 The immune-desert tumors are totally free of T cells, the immune-excluded contain T cells in the stroma but not inside the tumors, whereas the inflamed tumors are infiltrated by T cells indicating an active antitumor immune response, which, however, is often impaired by immune-suppressive mechanisms.Citation11
The interaction between inhibitory immune checkpoint receptors, including PD-1, CTLA-4 and TIM-3, with their ligands expressed on tumor cells, has been shown to impair anti-tumor T-cell immune responses.Citation13–Citation16 Clinical trials based on the use of anti-PD-1, anti-PD-L1 and anti-CTLA-4 antibodies have shown promising results in several tumors, especially those highly infiltrated by T cells, expressing tumor-specific neoantigens and PD-L1 on tumor cells.Citation17–Citation20
PD-L1 expression has been investigated in many malignancies, including breast, kidney, lung, esophagus, ovary, colorectal, head and neck, squamous cell carcinomas, melanomas, GISTs, gliomas and neuroblastoma.Citation21–Citation25 Very little is known about the expression of PD-L1 and the density of TILs subsets in pediatric and adolescent malignant extracranial germ-cell tumors (meGCTs), a heterogeneous group of tumors representing 3–5% of all childhood cancers occurring before 15 years of age, and 15% of neoplasms in adolescents aged 15–19 years.Citation26,Citation27 MeGCTs derive from primordial germ cells (PGC) and can occur both within and outside the gonads. Following aberrant PGC migration, meGCTs can arise in midline locations such as sacrococcygeal, retroperitoneal and mediastinal. MeGCTs include germinomas, which according to their localization are distinguished in seminomas in the testicles and dysgerminomas in ovaries, and non-germinomas, including embryonal carcinomas, yolk sac tumors, choriocarcinomas, gonadoblastomas and immature teratomas.
Despite the common origin, the clinical outcome of meGCT patients differs considerably according to stage, tumor location and histology.Citation28 Although the majority of patients are cured by surgery and chemotherapy, a subgroup of them relapse.Citation29–Citation33 Current therapeutic options are effective in less than 50% of patients with high-risk disease, indicating that more effective and less toxic therapies are urgently needed.
In this study, we evaluate the prognostic relevance of TILs, and the expression of PD-1 and PD-L1 in a collection of primary and relapsed pediatric and adolescent meGCT specimens.
Results
Density of tumor-infiltrating CD3+ T cells in pediatric meGCTs
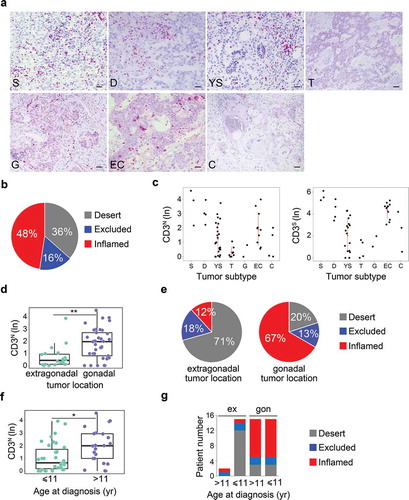
The prognostic relevance of density and spatial distribution of TILs was assessed by in situ immunohistochemical (IHC) analysis in a cohort of 49 pediatric meGCTs, including 24 pure and 25 mixed meGCTs, in which up to three different tumor subtypes coexist (Table S1). Sixty-three tumor subtypes were available for the analysis, of which 36 from meGCTs with a single countable tumor component (24 pure and 12 mixed), 24 from 12 mixed meGCTs with two distinct countable tumor subtypes, and 3 from one mixed meGCT with three distinct countable tumor subtypes (Table S1). The density of total CD3+ T cells quantified in tumor cell nests and in surrounding fibrovascular septa regions (10 sites for each sample), ranged from samples with prominent infiltrate to others with no infiltration (, Table S2). A large proportion of tumors (48%) exhibited the inflamed phenotype (i.e., infiltrated by CD3+ T cells in both nest and septa regions), while the others had the immune-desert (36%) or immune-excluded phenotypes (16%) (i.e., totally free of T lymphocytes in both nest and septa tumor regions, and infiltrated only in the septa regions, respectively) (). The inflamed tumors included the totality of seminomas and dysgerminomas, two-thirds of both embryonic carcinomas and choriocarcinomas and 39% of yolk sac tumors (, S1A). The immune-desert tumors included three quarters of teratomas, more than half of yolk sac tumors and 20% of choriocarcinomas, whereas the remaining tumors displayed an immune-excluded phenotype (i.e., a third of embryonic carcinomas, 25% of teratomas, 20% of choriocarcinomas and 7% of yolk sac tumors) (, S1A).
Figure 1. Density of tumor-infiltrating CD3+ T cells in meGCTs a, Representative IHC images for CD3+ T cell staining in primary meGCT samples. The density of T cells was recorded as the number of positive cells per unit of tissue surface area. Nuclei were counterstained with hematoxylin (blue). Original magnification, x20. Scale bar, 30 µm. b, Distribution of tumor-infiltrating CD3+ T cells in meGCTs. c, Density of CD3+ T cells in the nest and septa tumor regions of the various meGCT subtypes. d, Box plot of the CD3+ T-cell density in the nest region according to the tumor location. e, Distribution of tumor-infiltrating CD3+ T cells in meGCTs according to tumor location. f, Box plot of the CD3+ T-cell density in the nest region according to age at diagnosis. g, Distribution of tumor-infiltrating CD3+ T cells in meGCT patients according to tumor location and age at diagnosis. In D and F, the boxes show the 25th to 75th percentile, the horizontal line inside the box represents the median, the whiskers extend to the most extreme data point, which is no more than 1.5 times the interquartile range from the box, and the circles are individual samples. S, seminoma; D, dysgerminoma; YS, yolk sac tumors; T, teratoma; G, gonadoblastoma; EC, embryonal carcinoma; C, choriocarcinoma. *p < 0.05. **p < 0.001.
Next, we evaluated the relationship between CD3+ T-cell distribution and clinical outcome. Survival analysis for up to 20 years after primary tumor resection was performed by stratifying the patients according to the optimal cut-off value for CD3+ T-cell density in both nest and septa tumor regions selected with the minimum p value approach (see Materials and Methods). Patients with high CD3+ T-cell infiltration in both tumor regions (i.e., inflamed tumors) tended to have a better clinical outcome (Fig S1B). The median event-free survival of patients with high CD3+ versus low CD3+ T-cell infiltrate in both tumor regions were 94% and 63%, respectively (log-rank p value 0.413) (Fig S1B).
To verify whether the abundance of tumor-infiltrating CD3+ T cells may represent an independent predictor of clinical outcome of meGCTs, the association between density of CD3+ T cells and the parameters known to affect patient survival, such as tumor location, age at diagnosis and stage, were evaluated. The distribution of CD3+ T cells in nest and/or septa regions was statistically different between tumors located in the extragonadal sites and gonads. Both ovary and testis were more infiltrated than the extragonadal sites ( and S1C). The immune-desert phenotype prevailed among the tumors located in extragonadal sites (71%), whereas the inflamed phenotype characterized the majority (67%) of tumors located in the gonads (). A higher density of CD3+ T cells in both nest and septa tumor regions (i.e. inflamed tumors) was detected in patients over 11 years of age (, S1D), which had prevalently gonadal GCTs (). To determine whether the inflamed phenotype improves prognosis when combined with tumor location and age at diagnosis, patients were stratified according to these two parameters alone, or in combination with infiltrating T cells (Fig S1E). We found that high density of T cells tended to differently affect event-free survival of patients with gonadal GCTs depending on age at diagnosis. Event-free survival of patients over 11 years varied from 80% to 90% in the presence of low or high CD3+ T-cell density, respectively, while that of patients with gonadal tumors under 11 years varied from 56% to 100% (Fig S1E). No statistical difference was detected between stages (Fig S1F).
Altogether, these data indicate that meGCTs are variously infiltrated by CD3+ T cells according to the tumor subtype, location and age at diagnosis and that the abundance of T cells could improve the prediction of patient survival when combined with age at diagnosis and tumor location.
Density of tumor-infiltrating CD3+ T cells in mixed meGCTs
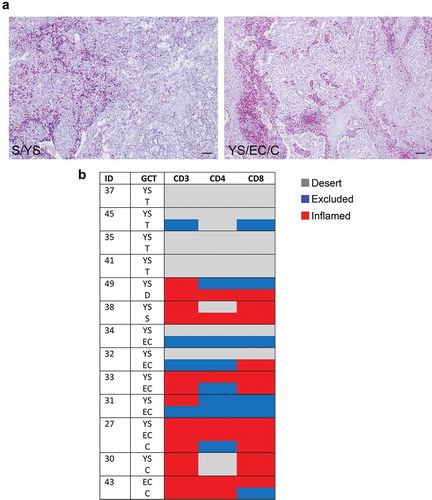
Mixed meGCTs are characterized by the coexistence of multiple tumor subtypes. We studied the distribution of tumor-infiltrating CD3+ T cells in 13 different mixed meGCTs in which at least two tumor subtypes coexisted in the same lesion (Table S3). Most of the mixed meGCTs were composed by yolk sac tumors associated with other meGCT subtypes, including embryonal carcinomas, teratomas, choriocarcinomas, seminomas and dysgerminomas; the only exception was a mixed meGCT composed by embryonal carcinoma and choriocarcinoma (Table S3). Interestingly, the adjacent tumor subtypes belonging to mixed meGCTs were variously infiltrated by T cells ( and , Table S3). Indeed, seminoma and dysgerminoma subtypes were infiltrated up to 10 times more than the adjacent yolk sac tumor subtype (Table S3). Conversely, choriocarcinomas contained 2 to 4 times less TILs than the adjacent yolk sac tumor and/or embryonal carcinoma subtypes (Table S3).
Figure 2. Density of tumor-infiltrating CD3+ T cells in mixed meGCTs a, Representative IHC images for density of CD3+ T cells in primary mixed meGCT samples. CD3+ T cells (red) are differently distributed in mixed meGCT subtypes. Nuclei were counterstained with hematoxylin (blue). Original magnification, x10. Scale bar, 30 µm. b, Distribution of tumor-infiltrating CD3+ T cells in mixed meGCTs. The immune phenotypes are indicated as follows: immune inflamed, immune-excluded, and immune desert in red, blue and gray, respectively. S, seminoma; D, dysgerminoma; YS, yolk sac tumors; T, teratoma; EC, embryonal carcinoma; C, choriocarcinoma.
These findings indicate that tumor subtypes belonging to mixed meGCTs are associated with distinct TMEs, which either facilitate or prevent immune cells from entering the different tumor subtypes.
Density of tumor-infiltrating T-cell subsets in meGCTs
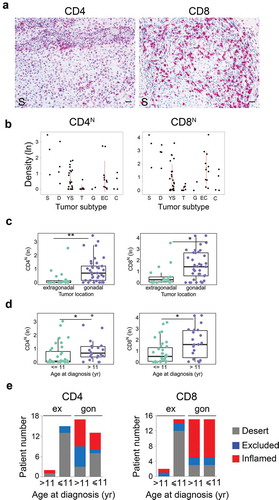
To identify the subset(s) of T cells infiltrating meGCTs and their distribution in mixed meGCTs, effector T cells (CD4+ and CD8+) and Treg (CD4+FOXP3+) cells were analyzed in the same cohort of patients by in situ IHC analysis. As for CD3+ T cells, density of T-cell subsets was quantified in both nest and septa tumor regions. MeGCTs were variously infiltrated by CD4+ and CD8+ T cells (), with CD8+ more abundant than CD4+ T cells (Fig S2A, Table S2). Seminoma and dysgerminoma were the most infiltrated meGCTs, followed by embryonal carcinomas, yolk sac tumors and choriocarcinomas (, S2B, Table S2). Survival analysis revealed no significant correlation between the density of CD4+ and CD8+ in nest and/or septa regions and patient outcome, although patients with inflamed tumors tend to have a better event-free survival (log-rank p values 0.638 and 0.436 for CD4+ and CD8+ T cells in nest and septa combined together, respectively) (Fig S2C). Similar to CD3+ T-cell density, the distribution of CD4+ and CD8+ T cells was statistically different based on tumor location and age at diagnosis (, , S2D, S2E). Gonadal meGCTs were prevalently infiltrated by CD8+ T cells regardless of age, whereas extragonadal meGCTs exhibited mainly a desert phenotype (). A lower percentage of tumors was infiltrated by CD4+ T cells in both gonadal and extragonadal meGCTs regardless of age at diagnosis (). Distribution of CD4+ and CD8+ T cells was not statistically different between stages (Fig S2F). Interestingly, as for CD3+ T cells, the adjacent tumor subtypes belonging to mixed meGCTs were also variously infiltrated by CD4+ and CD8+ T-cell subsets ( and Table S3).
Figure 3. Density of tumor-infiltrating CD4+ and CD8+ T-cell subsets in meGCTs a. Representative IHC images for CD4+ and CD8+ T-cell staining in primary meGCT samples. T-cell subsets are in red. Nuclei were counterstained with hematoxylin (blue). Original magnification, x20. Scale bar, 30 µm. b, Distribution of CD4+ and CD8+ T cells in nest regions of meGCT subtypes. c and d, Box plots of CD4+ and CD8+ T cells in nest regions according to the tumor location and age at diagnosis, respectively. e, Distribution of tumor-infiltrating CD4+ and CD8+ T cells in meGCT patients according to tumor location and age at diagnosis. S, seminoma; D, dysgerminoma; YS, yolk sac tumors; T, teratoma; G, gonadoblastoma; EC, embryonal carcinoma; C, choriocarcinoma. *p < 0.05. **p < 0.001.
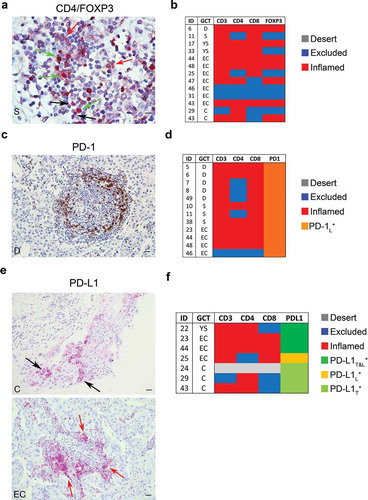
Tumor-infiltrating Treg cells (CD4+ FOXP3+) were detected in the nest and/or septa tumor regions of 13 meGCTs highly infiltrated by CD4+ and CD8+ T cells (, , Table S2 and S4). Nine of them (70%) consisted of embryonal carcinomas and choriocarcinomas. The presence of Treg cells in these tumors leads to an immunosuppressive TME promoting cancer immune evasion and progression.
Figure 4. Density of FOXP3+, PD-1+ and PD-L1+ cells in meGCTs a, Representative IHC images of CD4 and FOXP3 double staining in primary meGCT samples visualized with diaminobenzidine (brown) and Fast Red (red), respectively. Red, black and green arrows indicate CD4+ cells, FOXP3+ cells and CD4+/FOXP3+ Tregs, respectively. Original magnification, x60. Scale bar, 30 µm. b, Distribution of TIL subsets in FOXP3-expressing meGCTs. c, Representative examples of PD-1+ cell staining in a meGCT samples. Original magnification, x20. Scale bar, 30 µm. d, Distribution of TIL subsets in PD-1-expressing meGCTs. e, Representative IHC images for PD-L1+ cell staining in primary meGCT samples. Black and red arrows indicate PD-L1+ tumor cells and tumor-infiltrating PD-L1+ lymphocytes, respectively. Original magnification, x20. Scale bar, 30 µm. f, Distribution of tumor-infiltrating T-cell subsets in PD-L1-expressing meGCTs. S, seminoma; D, dysgerminoma; YS, yolk sac tumors; EC, embryonal carcinoma; C, choriocarcinoma.
Density of PD-1+ and PD-L1+ cells in meGCTs
Next, density of tumor-infiltrating PD-1+ lymphocytes and PD-L1+ cells was evaluated in the same cohort of patients by in situ IHC analysis (). The number of PD-1+ infiltrating lymphocytes was proportional to the density of TILs (Fig S3). On average 28% of the infiltrated meGCTs contained PD-1-expressing lymphocytes. They included the totality of dysgerminomas and seminomas and one third of the embryonal carcinomas ().
An intense membrane staining of PD-L1 was detected on tumor cells of 6 specimens, including 3 choriocarcinomas, 2 embryonal carcinomas and 1 yolk sac tumor (, , Table S5). These samples were all infiltrated by CD4+ and CD8+ T cells. In some meGCTs, PD-L1 was also detected on TILs (, , Table S5).
Density of tumor-infiltrating T cells in local relapses of meGCTs
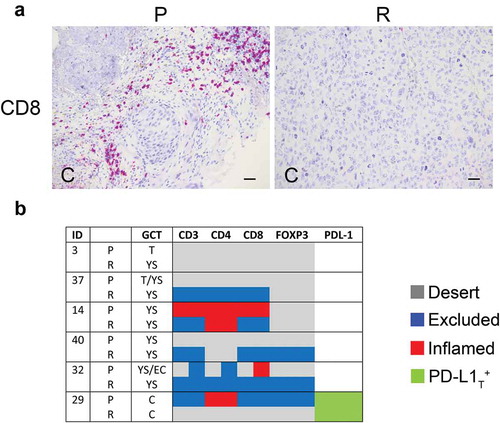
Density of TIL subsets was evaluated in 6 local relapses of meGCT and compared with that of primary tumors. Relapses were mostly yolk sac tumors occurring in patients with primary tumors of the same component, or teratomas and embryonal carcinomas. Most of relapses had a different immune phenotype as compared to primary tumors, (, , Table S6). A reduction of CD3+ T-cell density in nest and/or septa tumor regions was detected in two relapsed tumors (patients 14 and 29) (, , Table S6). This involved a change in immune phenotypes from inflamed to immune-excluded (patient 14), and from immune-excluded to desert (patient 29). Conversely, density of tumor-infiltrating CD3+ T cells was increased in the septa of two relapsed tumors (patients 37 and 40), causing a change of the immune phenotype from immune desert to immune-excluded in both tumors. In the remaining cases, the immune phenotype of relapses remained unchanged as compared to primary tumors (patients 3 and 32). In general, CD4+ and CD8+ T-cell subtypes reflected the trend observed for CD3+ T cells, with CD8+ T cells more similar to CD3+ T cells (, Table S6). With respect of primary tumors, density of CD4+FOXP3+ cells was increased in the stroma region of two relapsed tumor (patients 40 and 32), and drastically reduced in another (patient 29) (, Table S6). Notably, all patients who relapsed have been treated only surgically, except one (patient 29) who was treated with high dose of cisplatin. As some chemotherapeutics are known to shape clinical outcome by influencing tumor-host interactions Citation34, it is suggestive to consider a possible reduction of T-cell infiltration in the relapsed tumor due to the cisplatin treatment.
Figure 5. Density of tumor-infiltrating T cell subsets and tumor PD-L1 in primary and relapsed meGCTs a, Representative IHC images of CD3+ T cell staining in primary (P) and relapsed (R) meGCT samples. Original magnification, x20. Scale bar, 30 µm. b, Distribution of TIL subsets and PD-L1 expression in primary and relapsed meGCTs. T, teratoma, YS, yolk sac tumors; EC, embryonal carcinoma; C, choriocarcinoma.
Discussion
Recent studies on the TME have highlighted the key role of CD8+ TILs and immunosuppressive elements in mediating control of cancer growth, but their involvement in the progression of meGCTs is not well defined.
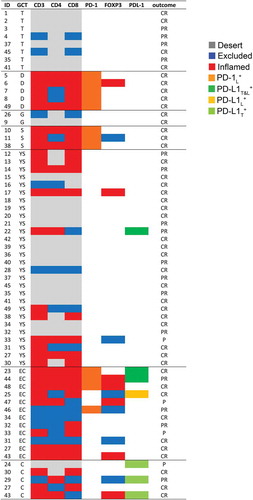
Herein, we comprehensively evaluated the composition, density and strategic location of different TIL subsets (i.e., CD3+, CD4+, CD8+ and CD4+FOXP3+ Treg) as well as the expression of immunoregulatory elements (i.e., PD-1 and PD-L1) in pediatric primary and relapsed meGCTs and their association with clinical outcome. According to the immune component, meGCTs were distinguished in three different phenotypes: phenotype (a), meGCTs not infiltrated by T cells (immature teratomas and half of the yolk sac tumors tested); phenotype (b), meGCTs highly infiltrated by lymphocyte-expressing PD-1 (seminomas and dysgerminomas), which identifies activated tumor-reactive T cells Citation35; phenotype (c), meGCTs highly infiltrated by T cells within an immunosuppressive TME characterized by CD4+FOXP3+ Treg cells, PD-1+ lymphocytes, and PD-L1-expressing tumor cells (embryonal carcinomas, choriocarcinomas and the remaining yolk sac tumors) (). Consistent with our findings, Yakirevich et al. showed that seminoma is the subset of testicular meGCTs most infiltrated by cytotoxic CD8+ T cells (i.e., granzyme B+ and TIA-1+), a crucial component of the cellular immune system, which is pivotal for cell-mediated anti-tumor immune responses.Citation36 More recently, seminomas have been demonstrated to be infiltrated by clonally expanded tumor-specific T cells, a part of which expressing CD107a and granzyme B.Citation37
Figure 6. Immune profiling of tumor-infiltrating T cells and expression of PD-1 and PD-L1 in meGCs. Distribution of TIL subsets and expression of PD-1 and PD-L1 cells in meGCTs. CR: complete response; PR: partial response; P: progression. S, seminoma; D, dysgerminoma; YS, yolk sac tumors; T, teratoma; G, gonadoblastoma; EC, embryonal carcinoma; C, choriocarcinoma.
According to other studies, we observed that choriocarcinomas express the highest levels of PD-L1,Citation38,Citation39 which is consistent with the high expression of PD-L1 of the normal placenta,Citation40 the tissue histologically related to choriocarcinoma. Moreover, as seen by other,Citation41 embryonal carcinomas express PD-L1 in both tumor cells and TILs. As for other tumors,Citation42 the expression of PD-L1 on TILs is a favorable prognostic factor for meGCTs.Citation41 Chovaneck et al, found that patients with high PD-L1 on tumor and low PD-L1 on TILs had the worst prognosis, while on the contrary, patients with low PD-L1 in tumor and high PD-L1 on TILs had better prognosis.Citation41 In the majority of studies, the expression of PD-L1 in tumor section has been evaluated without distinguishing between tumor cells and immune cells. Based on these results, PD-L1 has a different prognostic value when expressed on tumor cells or TILs, highlighting the importance to evaluate carefully its expression in both tumor cells and immune cells.
We found that density of TILs was affected by tumor location, with tumors arising in the gonads (both ovary and testis) being more infiltrated than those arising in the extragonadal sites (i.e., mediastinum and retroperitoneum). It is possible that the different basal level of immune infiltration of healthy tissues (gonads and extragonadal tissues) might contribute to the significant difference detected in meGCTs. In this sense, while the role of lymphocytes in healthy gonads is well documented,Citation43,Citation44 the information available on extragonadal tissues is limited to the fact that being made of connective tissue, they contain T cells.
The inflamed phenotype has been associated with the presence of chemokines and cytokines capable of recruiting and activating tumor-specific T cells inside the tumor.Citation45–Citation48 Consistently, melanoma biopsies infiltrated by T cells expressed different chemokines as compared to those lacking T cell infiltration.Citation47 Interestingly, we found that tumor subtypes belonging to mixed meGCTs were variously infiltrated by T-cell subsets, thus reflecting the coexistence of multiple TMEs that either facilitate or preclude T cells from entering the malignant tissue. For this peculiarity, mixed meGCTs may represent an appropriate model to study the factors involved in the recruitment of T cells into tumors.
In summary, our study demonstrates that (i) meGCTs are variably infiltrated by T cell subsets according to the tumor subtype, tumor location and age at diagnosis, with the most aggressive forms characterized by an immunosuppressive microenvironment with Treg and PD-L1-expressing tumor cells. These findings support the hypothesis that TILs influence the fate of meGCTs and might be of clinical relevance to improve risk stratification and the treatment of patients.
To the best of our knowledge, this is the first study that investigates the prognostic significance of tumor-infiltrating T-cell subsets together with the expression of PD-1 and PD-L1 in pediatric meGCTs patients. The information presented here might be useful for tailoring intensity of treatment on meGCTs.
Materials and methods
Patients
GCTs diagnosed in 49 patients between 1998 and 2016 at the Bambino Gesù Children’s Hospital were studied. They included both tissues obtained at diagnosis and prior to any therapy and tissues obtained after chemotherapy. Written informed parental consent was obtained for each patient in accordance with the Declaration of Helsinki and after approval of the study by the Ethical Committee of the Institution. Clinical details, including age at diagnosis, tumor subtype, site of the tumor, disease stage are shown in Table S1. Primary tumors included 24 pure GCTs and 25 mixed GCTs, in which, whenever possible, different tumor subtypes were defined. Diagnosis and histology were performed according to the World Health Organization (WHO) classification.Citation31
Immunohistochemistry and manual acquisition
IHC was conducted with 4 μm of formaldehyde-fixed paraffin-embedded tissues sections.Citation24 Following deparaffinization and antigen retrieval with EnVision FLEX Target retrieval solution at low or high pH (citrate buffer pH 6.1 and Tris/EDTA pH 9.0, respectively) with PT-link (Dako), slides were subjected to the avidin/biotin blocking system (Thermo Fisher Scientific, Fremont, CA, USA) according to manufacturer’s instructions. For single staining, slide were incubated (60 min at room temperature) with monoclonal antibodies (mAb) against CD3 (F7.2.38, Dako), CD4 (1F6, Leica Microsystems), CD8 (C8/144B, Dako), FOXP3 (clone 236A/E7, Abcam), PD-1 (NAT105, ScyTek Laboratories), and PD-L1 (RBT-PDL1, Bio SB). This step was followed by incubation with secondary antibodies coupled with either streptavidin alkaline phosphatase (Dako) or peroxidase (Dako). Bound streptavidin and peroxidase were detected with Fast Red chromogen substrate (Dako) or diamonibenzidine (DAB) solution (Dako), respectively. For double staining, the two primary antibodies were sequentially detected with DAB and Fast Red chromogen substrates. Tissue sections were counterstained with EnVision FLEX Haematoxylin (Dako). Sections of normal tonsils were used as positive controls. Isotype-matched mouse mAbs were used as negative controls. Slides were analyzed using an image analysis workstation (Nikon Eclipse E600). The density of T cells in nests and the surrounded fibrovascular septa was recorded by two blinded examiners as the number of positive cells per unit tissue surface area (mm2). The mean of positive cells detected in 10 fields for each sample was used in the downstream statistical analysis. Each quantity x was converted to the log scale with the formula y = ln (x + 1/(1 + x)) to allow the transformation of any non-negative value.
Statistical analysis
Statistical analyses were performed in the R software environment. The Kaplan-Meier method was used for the estimation of event-free survival (EFS) curves. The log-rank test, implemented in the Survival R package, was used to compare EFS between different groups of patients as previously described.Citation10 Survival analysis was performed in a univariate fashion, feature by feature. To avoid overfitting, no information on outcome was considered in the process of threshold selection. Patients were stratified according to the cell density of CD3, CD4 and CD8 markers detected in the nest and septa tumor regions, tumor site, age at diagnosis and disease stages. For each marker, the optimal threshold yielding the best dichotomic patient stratification was selected. The Seigmund-Miller minimal p-value correction was used to reduce type-I errors, using 0.1 as high and low epsilon coefficients. Kruskal-Wallis test was used to compare density of T-cell subsets between tumor site, age at diagnosis and disease stages. Linear regression analysis was performed using the lm and rlm methods of the stats and MASS R libraries, respectively. Variables reaching a p-value < 0.05 in univariate analysis were included in Cox proportional hazard regression models.
Supplemental Material
Download Zip (5.6 MB)Additional information
Funding
References
- Fridman WH, Pages F, Sautes-Fridman C, Galon J. The immune contexture in human tumours: impact on clinical outcome. Nat Rev Cancer. 2012;12:298–306. doi:10.1038/nrc3245.
- Fridman WH, Zitvogel L, Sautes-Fridman C, Kroemer G. The immune contexture in cancer prognosis and treatment. Nat Rev Clin Oncol. 2017;14:717–734. doi:10.1038/nrclinonc.2017.101.
- Pages F, Berger A, Camus M, Sanchez-Cabo F, Costes A, Molidor R, Mlecnik B, Kirilovsky A, Nilsson M, Damotte D, et al. Effector memory T cells, early metastasis, and survival in colorectal cancer. N Engl J Med. 2005;353:2654–2666. doi:10.1056/NEJMoa051424.
- Hori S, Nomura T, Sakaguchi S. Control of regulatory T cell development by the transcription factor Foxp3. Science. 2003;299:1057–1061. doi:10.1126/science.1079490.
- Fontenot JD, Gavin MA, Rudensky AY. Foxp3 programs the development and function of CD4+CD25+ regulatory T cells. Nat Immunol. 2003;4:330–336. doi:10.1038/ni904.
- Curiel TJ, Coukos G, Zou L, Alvarez X, Cheng P, Mottram P, Evdemon-Hogan M, Conejo-Garcia JR, Zhang L, Burow M, et al. Specific recruitment of regulatory T cells in ovarian carcinoma fosters immune privilege and predicts reduced survival. Nat Med. 2004;10:942–949. doi:10.1038/nm1093.
- Salama P, Phillips M, Grieu F, Morris M, Zeps N, Joseph D, Platell C, Iacopetta B. Tumor-infiltrating FOXP3+ T regulatory cells show strong prognostic significance in colorectal cancer. J Clin Oncol: Off J Am Soc Clin Oncol. 2009;27:186–192. doi:10.1200/JCO.2008.18.7229.
- Galon J, Costes A, Sanchez-Cabo F, Kirilovsky A, Mlecnik B, Lagorce-Pages C, Tosolini M, Camus M, Berger A, Wind P, et al. Type, density, and location of immune cells within human colorectal tumors predict clinical outcome. Science. 2006;313:1960–1964. doi:10.1126/science.1129139.
- Bindea G, Mlecnik B, Tosolini M, Kirilovsky A, Waldner M, Obenauf AC, Angell H, Fredriksen T, Lafontaine L, Berger A, et al. Spatiotemporal dynamics of intratumoral immune cells reveal the immune landscape in human cancer. Immunity. 2013;39:782–795. doi:10.1016/j.immuni.2013.10.003.
- Mina M, Boldrini R, Citti A, Romania P, D’Alicandro V, De Ioris M, Starmann J, Tjwa M, Plate KH, Sültmann H, et al. Tumor-infiltrating T lymphocytes improve clinical outcome of therapy-resistant neuroblastoma. Oncoimmunology. 2015;4:e1019981. doi:10.1080/2162402X.2015.1008371.
- Chen DS, Mellman I. Elements of cancer immunity and the cancer-immune set point. Nature. 2017;541:321–330. doi:10.1038/nature21349.
- Hegde PS, Karanikas V, Evers S. The where, the when, and the how of immune monitoring for cancer immunotherapies in the era of checkpoint inhibition. Clin Cancer Res: an off J Am Assoc Cancer Res. 2016;22:1865–1874. doi:10.1158/1078-0432.CCR-15-1507.
- Pardoll DM. The blockade of immune checkpoints in cancer immunotherapy. Nat Rev Cancer. 2012;12:252–264. doi:10.1038/nrc3239.
- Topalian SL, Drake CG, Pardoll DM. Immune checkpoint blockade: a common denominator approach to cancer therapy. Cancer Cell. 2015;27:450–461. doi:10.1016/j.ccell.2015.03.001.
- Zou W, Wolchok JD, Chen L, Dewhirst M, Fan TM, Gustafson DL, Helman LJ, Kastan MB, Knapp DW, Levin WJ, et al. PD-L1 (B7-H1) and PD-1 pathway blockade for cancer therapy: mechanisms, response biomarkers, and combinations. Sci Transl Med. 2016;8:328rv4. doi:10.1126/scitranslmed.aaf0746.
- Das M, Zhu C, Kuchroo VK. Tim-3 and its role in regulating anti-tumor immunity. Immunol Rev. 2017;276:97–111. doi:10.1111/imr.12520.
- Schumacher TN, Schreiber RD. Neoantigens in cancer immunotherapy. Science. 2015;348:69–74. doi:10.1126/science.aaa4971.
- Mahoney KM, Rennert PD, Freeman GJ. Combination cancer immunotherapy and new immunomodulatory targets. Nat Rev Drug Discov. 2015;14:561–584. doi:10.1038/nrd4591.
- Teng MW, Ngiow SF, Ribas A, Smyth MJ. Classifying cancers based on T-cell Infiltration and PD-L1. Cancer Res. 2015;75:2139–2145. doi:10.1158/0008-5472.CAN-15-0255.
- McGranahan N, Furness AJ, Rosenthal R, Ramskov S, Lyngaa R, Saini SK, Jamal-Hanjani M, Wilson GA, Birkbak NJ, Hiley CT, et al. Clonal neoantigens elicit T cell immunoreactivity and sensitivity to immune checkpoint blockade. Science. 2016;351:1463–1469. doi:10.1126/science.aaf1490.
- Buisseret L, Garaud S, de Wind A, Van Den Eynden G, Boisson A, Solinas C, Gu-Trantien C, Naveaux C, Lodewyckx J-N, Duvillier H, et al. Tumor-infiltrating lymphocyte composition, organization and PD-1/PD-L1 expression are linked in breast cancer. Oncoimmunology. 2017;6:e1257452. doi:10.1080/2162402X.2016.1257452.
- Lin G, Fan X, Zhu W, Huang C, Zhuang W, Xu H, Lin X, Hu D, Huang Y, Jiang K, et al. Prognostic significance of PD-L1 expression and tumor infiltrating lymphocyte in surgically resectable non-small cell lung cancer. Oncotarget. 2017;8:83986–83994. doi:10.18632/oncotarget.20233.
- Heineman TE, Widman A, Kuan EC, St John M. The genetic landscape of programmed death ligand-1 (PD-L1) alterations in head and neck cancer. Laryngoscope Investig Otolaryngol. 2017;2:99–103. doi:10.1002/lio2.79.
- Melaiu O, Mina M, Chierici M, Boldrini R, Jurman G, Romania P, D’Alicandro V, Benedetti MC, Castellano A, Liu T, et al. PD-L1 Is a therapeutic target of the bromodomain inhibitor JQ1 and, combined with HLA Class I, a promising prognostic biomarker in neuroblastoma. Clin Cancer Res: an off J Am Assoc Cancer Res. 2017;23:4462–4472. doi:10.1158/1078-0432.CCR-16-2601.
- Clark CA, Gupta HB, Sareddy G, Pandeswara S, Lao S, Yuan B, Drerup JM, Padron A, Conejo-Garcia J, Murthy K, et al. Tumor-Intrinsic PD-L1 signals regulate cell growth, pathogenesis, and autophagy in ovarian cancer and melanoma. Cancer Res. 2016;76:6964–6974. doi:10.1158/0008-5472.CAN-16-0258.
- Shaikh F, Murray MJ, Amatruda JF, Coleman N, Nicholson JC, Hale JP, Pashankar F, Stoneham SJ, Poynter JN, Olson TA, et al. Paediatric extracranial germ-cell tumours. Lancet Oncol. 2016;17:e149–e62. doi:10.1016/S1470-2045(15)00545-8.
- Olson TA, Murray MJ, Rodriguez-Galindo C, Nicholson JC, Billmire DF, Krailo MD, Dang HM, Amatruda JF, Thornton CM, Arul GS, et al. Pediatric and adolescent extracranial germ cell tumors: the road to collaboration. J Clin Oncol: Off J Am Soc Clin Oncol. 2015;33:3018–3028. doi:10.1200/JCO.2014.60.5337.
- De Backer A, Madern GC, Pieters R, Haentjens P, Hakvoort-Cammel FG, Oosterhuis JW, Hazebroek FWJ. Influence of tumor site and histology on long-term survival in 193 children with extracranial germ cell tumors. Eur J Pediatr Surg. 2008;18:1–6. doi:10.1055/s-2007-989399.
- Frazier AL, Hale JP, Rodriguez-Galindo C, Dang H, Olson T, Murray MJ, Amatruda JF, Thornton C, Arul GS, Billmire D, et al. Revised risk classification for pediatric extracranial germ cell tumors based on 25 years of clinical trial data from the United Kingdom and United States. J Clin Oncol: Off J Am Soc Clin Oncol. 2015;33:195–201. doi:10.1200/JCO.2014.58.3369.
- Gobel U, Schneider DT, Calaminus G, Jurgens H, Spaar HJ, Sternschulte W, Waag K, Harms D. Multimodal treatment of malignant sacrococcygeal germ cell tumors: a prospective analysis of 66 patients of the German cooperative protocols MAKEI 83/86 and 89. J Clin Oncol: Off J Am Soc Clin Oncol. 2001;19:1943–1950. doi:10.1200/JCO.2001.19.7.1943.
- De Pasquale MD, Crocoli A, Conte M, Indolfi P, D’Angelo P, Boldrini R, Terenziani M, Inserra A. Mediastinal germ cell tumors in pediatric patients: A report from the italian association of pediatric hematology and oncology. Pediatr Blood Cancer. 2016;63:808–812. doi:10.1002/pbc.25895.
- Terenziani M, Bisogno G, Boldrini R, Cecchetto G, Conte M, Boschetti L, De Pasquale MD, Biasoni D, Inserra A, Siracusa F, et al. Malignant ovarian germ cell tumors in pediatric patients: the AIEOP (Associazione Italiana Ematologia Oncologia Pediatrica) study. Pediatr Blood Cancer. 2017:64:e26568. doi:10.1002/pbc.26568.
- Cushing B, Giller R, Cullen JW, Marina NM, Lauer SJ, Olson TA, Rogers PC, Colombani P, Rescorla F, Billmire DF, et al. Randomized comparison of combination chemotherapy with etoposide, bleomycin, and either high-dose or standard-dose cisplatin in children and adolescents with high-risk malignant germ cell tumors: a pediatric intergroup study–pediatric oncology group 9049 and children’s cancer group 8882. J Clinical Oncol: Off J Am Soc Clin Oncol. 2004;22:2691–2700. doi:10.1200/JCO.2004.08.015.
- Zitvogel L, Galluzzi L, Smyth MJ, Kroemer G. Mechanism of action of conventional and targeted anticancer therapies: reinstating immunosurveillance. Immunity. 2013;39:74–88. doi:10.1016/j.immuni.2013.06.014.
- Simon S, Labarriere N. PD-1 expression on tumor-specific T cells: friend or foe for immunotherapy?. Oncoimmunology. 2017;7:e1364828. doi:10.1080/2162402X.2017.1364828.
- Yakirevich E, Lefel O, Sova Y, Stein A, Cohen O, Izhak OB, Resnick MB. Activated status of tumour-infiltrating lymphocytes and apoptosis in testicular seminoma. J Pathol. 2002;196:67–75. doi:10.1002/path.996.
- Hadrup SR, Braendstrup O, Jacobsen GK, Mortensen S, Pedersen LO, Seremet T, Andersen MH, Becker JC, Straten PT. Tumor infiltrating lymphocytes in seminoma lesions comprise clonally expanded cytotoxic T cells. Inter J Cancer. 2006;119:831–838. doi:10.1002/ijc.21894.
- Cierna Z, Mego M, Miskovska V, Machalekova K, Chovanec M, Svetlovska D, Hainova K, Rejlekova K, Macak D, Spanik S, et al. Prognostic value of programmed-death-1 receptor (PD-1) and its ligand 1 (PD-L1) in testicular germ cell tumors. Ann Oncology: Official Journal Eur Soc Med Oncol. 2016;27:300–305. doi:10.1093/annonc/mdv574.
- Fankhauser CD, Curioni-Fontecedro A, Allmann V, Beyer J, Tischler V, Sulser T, Moch H, Bode PK. Frequent PD-L1 expression in testicular germ cell tumors. Br J Cancer. 2015;113:411–413. doi:10.1038/bjc.2015.244.
- Veras E, Kurman RJ, Wang TL, Shih IM. PD-L1 expression in human placentas and gestational trophoblastic diseases. Inter J Gynecol Pathol: off J Inter Society Gynecol Pathologists. 2017;36:146–153. doi:10.1097/PGP.0000000000000305.
- Chovanec M, Cierna Z, Miskovska V, Machalekova K, Svetlovska D, Kalavska K, Rejlekova K, Spanik S, Kajo K, Babal P, et al. Prognostic role of programmed-death ligand 1 (PD-L1) expressing tumor infiltrating lymphocytes in testicular germ cell tumors. Oncotarget. 2017;8:21794–21805. doi:10.18632/oncotarget.15585.
- Kim HR, Ha SJ, Hong MH, Heo SJ, Koh YW, Choi EC, Kim EK, Pyo KH, Jung I, Seo D, et al. PD-L1 expression on immune cells, but not on tumor cells, is a favorable prognostic factor for head and neck cancer patients. Sci Rep. 2016;6:36956. doi:10.1038/srep36956.
- Ye H, Li X, Zheng T, Liang X, Li J, Huang J, Pan Z, Zheng Y. The effect of the immune system on ovarian function and features of ovarian germline stem cells. SpringerPlus. 2016;5:990. doi:10.1186/s40064-016-2390-3.
- Elewa YH, Ichii O, Otsuka S, Hashimoto Y, Kon Y. Characterization of mouse mediastinal fat-associated lymphoid clusters. Cell Tissue Res. 2014;357:731–741. doi:10.1007/s00441-014-1889-6.
- Sackstein R, Schatton T, Barthel SR. T-lymphocyte homing: an underappreciated yet critical hurdle for successful cancer immunotherapy. Lab Invest. 2017;97:669–697.
- Viola A, Sarukhan A, Bronte V, Molon B. The pros and cons of chemokines in tumor immunology. Trends Immunol. 2012;33:496–504. doi:10.1016/j.it.2012.05.007.
- Harlin H, Meng Y, Peterson AC, Zha Y, Tretiakova M, Slingluff C, McKee M, Gajewski TF. Chemokine expression in melanoma metastases associated with CD8+ T-cell recruitment. Cancer Res. 2009;69:3077–3085. doi:10.1158/0008-5472.CAN-08-2281.
- Zsiros E, Duttagupta P, Dangaj D, Li H, Frank R, Garrabrant T, Hagemann IS, Levine BL, June CH, Zhang L, et al. The ovarian cancer chemokine landscape is conducive to homing of vaccine-primed and CD3/CD28-costimulated T cells prepared for adoptive therapy. Clin Cancer Res: an off J Am Assoc Cancer Res. 2015;21:2840–2850. doi:10.1158/1078-0432.CCR-14-2777.