
ABSTRACT
Aberrant expression of immune checkpoints (ICs) in cancer creates an immunosuppressive microenvironment, which supports immune evasion of tumor cells. We have recently reported that epigenetic modifications are critical for ICs expression in the tumor microenvironment (TME) of primary breast cancer (PBC) and colorectal cancer (CRC). Herein, we investigated transcriptomic expression of ICs (PD-1, CTLA-4, LAG-3, TIM-3, TIGIT) and PD-L1 in peripheral blood of PBC and CRC patients, compared to healthy donors (HD). We found that expressions of TIM-3, TIGIT, PD-L1 were significantly upregulated, while LAG-3 expression was downregulated in peripheral blood of PBC and CRC patients. Demethylation enzymes TET2 and TET3 were also upregulated. In addition, promoter DNA methylation status of PD-1 was significantly hypermethylated, while PD-L1 was hypomethylated in PBC and CRC patients. Furthermore, TIGIT was significantly hypomethylated only in CRC patients. Remarkably, promoter methylation status of LAG-3, TIGIT and PD-L1 was in concordance with transcriptomic expression in CRC: the more the hypomethylation, the higher the expression. In comparison, we found that CTLA-4, TIM-3, TIGIT and PD-L1 in PBC, and CTLA-4 in CRC patients were significantly upregulated in peripheral blood, compared with tumor tissues of the same patients. However, demethylation status of all ICs was higher in TT, except for TIGIT in PBC, and CTLA-4 in CRC patients. These data indicate that the underlying mechanisms behind peripheral upregulation of PD-L1 and TIGIT in cancer patients could be due to aberrant promoter methylation profile. Moreover, demethylation inhibitors together with anti-PD-L1/anti-TIGIT could be a more efficient therapeutic strategy in cancer patients.
Introduction
Breast cancer (BC) and colorectal cancer (CRC) are the most common cancers associated with death worldwide.Citation1,Citation2 The mortality rate due to cancer has dramatically increased in 2017.Citation2 Out of all cancers, 14% and 8–9% cases are from breast and colorectal cancers, respectively.Citation2 Extensive studies indicate that altered gene expression, and/or deregulated epigenetic machineries play important roles in the onset of breast and colorectal carcinogenesis.Citation3
Several studies reported that the immune system plays a role not only in tumor suppression but also promotes tumor growth and survival by targeting the expression of co-inhibitory molecules and receptors regulated by T lymphocytes. These include programmed cell death-1 (PD-1), cytotoxic T lymphocyte antigen-4 (CTLA-4), lymphocyte activation gene-3 (LAG-3), T cell immunoglobulin mucin-3 (TIM-3), T cell immunoreceptor with Ig and ITIM domains (TIGIT), V-domain Ig suppressor of T-cell activation (VISTA) and programmed cell death ligand-1 (PD-L1) and more.Citation4-Citation6 Modulation of the immune checkpoints (ICs) creates an immunosuppressive microenvironment against tumor antigens, which results in poor prognosis in numerous cancers such as breast, pancreatic, lung, head and neck and ovarian.Citation6
Interactions between PD-1 and its ligands, PD-L1 and PD-L2, are associated with multiple immunoregulatory roles in tumor immunity and inflammatory responses. Studies reported that interaction of PD-1 on T cells and PD-L1 on antigen presenting cells (APC) or tumor cells favors tumor cell progression through the inhibition of T- cell activity and tumor specific T cells.Citation5,Citation7 Similar to PD-1 function, CTLA-4 negatively regulates the immune system by competitively inhibiting B7-CD28 interaction thereby promoting immune tolerance against tumor. Unlike CTLA-4, CD28-B7 interaction stimulates T cell activation.Citation5,Citation8 Furthermore, T cell exhaustion induces the expression of multiple co-inhibitory receptors such as LAG-3, TIM-3 and PD-1. Additionally, TIGIT and VISTA are emerging co-inhibitory immune checkpoints. Reports show that both TIGIT and VISTA stimulates an inhibitory signal to suppress T cell activation, promoting an immunosuppressive environment.Citation8,Citation9
Epigenetic alterations/modulations of immune checkpoints such as aberrant methylation/demethylation pattern results in altered gene expression and tumorigenesis. It has been reported that methylation of the 5th cytosine residue of the CpGs in the promoter regions of genes are associated with their suppression.Citation10 This process is catalyzed by enzymes called mammalian DNA methyl-transferases (DNMTs), DNMT3a and DNMT3b, which are critical for cell viability and genome stability.Citation10 Moreover, aberrant expression of DNMTs are associated with cancer progression.Citation10 On the other hand, impaired functions of demethylation enzymes such as ten eleven translocation (TET); TET2 and TET3 are associated with cell transformation and cancer progression.Citation11
Recently, we have reported that in primary breast cancer (PBC), the transcriptomic expression of ICs including PD-1, CTLA-4, LAG-3 and TIM-3 was significantly higher in tumor tissue (TT) compared with normal tissue (NT).Citation12 Additionally, in CRC patients, ICs including PD-1, CTLA-4, TIM-3 and TIGIT and IC ligands including PD-L1 and galectin-9 were significantly upregulated in TT compared with NT.Citation13 Besides that, the promoter regions of PD-1, CTLA-4 and TIM-3 in PBC patientsCitation12 and CTLA-4 and TIGIT in CRC patients, were significantly hypomethylated in TT, compared with NT.Citation13 Therefore, to check the molecular mechanism behind the expression of immune checkpoints and ligand in circulation, we investigated the transcriptomic expression analysis of various immune checkpoints/ligand, and also their promoter methylation pattern of both PBC and CRC patients compared to HD and tumor tissue. Interestingly, we found that immune checkpoints TIM-3, TIGIT and PD-L1 were upregulated, and LAG-3 was significantly downregulated in circulation of PBC and CRC patients, compared with HD. Furthermore, PD-1 and CTLA-4 were significantly upregulated only in CRC patients. On the other hand, VISTA showed no significant difference in both PBC and CRC. Next, we investigated the promoter demethylation status of immune checkpoints/ligand and found that PD-L1 in PBC and TIGIT and PD-L1 in CRC were significantly hypomethylated, compared with HD. Meanwhile, the promoter methylation status of PD-1 was significantly hypermethylated in circulation of both PBC and CRC. However, comparing the transcriptomic expression of ICs/ligand in circulation to tumor tissue showed that CTLA-4, TIM-3, TIGIT and PD-L1 in blood of PBC patients, and only CTLA-4 in blood of CRC were significantly upregulated, compared with tumor tissues. Altogether, our data highlight the importance of the epigenetic regulatory mechanisms in the upregulation of ICs/ligands in the peripheral blood of both PBC and CRC patients.
Results
Upregulation of immune checkpoints in circulation of breast and colorectal cancer patients
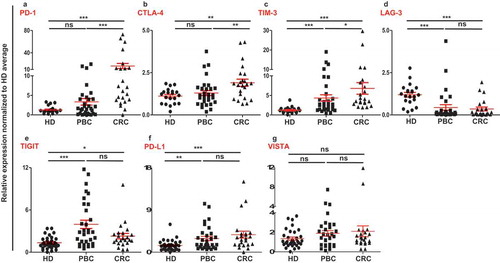
Numerous negative regulatory mechanisms, which can inhibit antitumor responses are implemented through the expression of various immune checkpoints/ligands on immune and tumor cells. Reports show that, not only immune infiltrating cells, but also circulating cells can possess an immune suppressive phenotype in cancer patients.Citation14-Citation16 We investigated a set of immune checkpoints/ligands including PD-1, CTLA-4, TIM-3, LAG-3, TIGIT, VISTA and PD-L1 in peripheral blood mononuclear cells (PBMCs) from healthy donors (n = 32), breast cancer patients (n = 31) and colorectal cancer patients (n = 23). Results showed that the expressions of TIM-3, TIGIT and PD-L1 in PBMCs of PBC patients were significantly higher and LAG-3 was significantly lower compared with HD (–)). In the PBMCs from colorectal cancer patients, the expressions of PD-1, CTLA-4, TIM-3, TIGIT and PD-L1 were significantly upregulated, compared with HD (-)). In common, TIM-3, TIGIT and PD-L1 were upregulated in both PBC and CRC PBMCs ()). In contrast, the expression of LAG-3 was significantly downregulated in both PBC and CRC samples compared with HD ()). Moreover, the expressions of PD-1, CTLA-4 and TIM-3 were significantly higher in CRC, compared with PBC, and no significant differences in the expression of LAG-3, TIGIT and PD-L1 between PBC and CRC PBMCs (–)). Of note, there was no upregulation in the expression of VISTA in both PBC and CRC PBMCs ()).
Figure 1. Relative expression of immune checkpoints in circulation of HD, PBC and CRC patients. RNA from PBC, CRC and HD patients were isolated and reversely transcribed into cDNA, followed by quantitative RT-PCR to assess the relative expression levels of PD-1 (a), CTLA-4 (b), TIM-3 (c), LAG-3 (d), TIGIT (e), PD-L1 (f) and VISTA (g) in circulation. All genes were normalized to β-actin.
Upregulation of immune checkpoints in circulation of PBC and CRC patients is irrespective of their cancer stage/histological grade
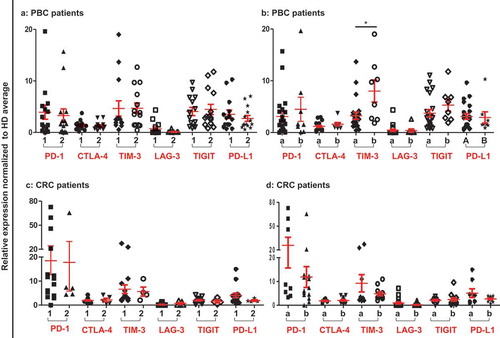
Patients were compared by dividing them into groups based on their histological grade and TNM staging. In PBC, patients with stage I and II (n = 20) were compared with stage III (n = 9), while CRC patients with stage I and II (n = 8) were compared with stage III and IV (n = 12). Additionally, in both PBC and CRC, patients with moderate and well differentiated histological grade (PBC, n = 13 and CRC, n = 15) were compared with poorly differentiated group (PBC, n = 14 and CRC, n = 6). We did not find any significant difference in the expressions of immune checkpoints between any classifications except TIM-3 in PBC samples (). Interestingly, PBC patients with poorly differentiated tumor grade had significantly higher expression level of TIM-3, compared with moderate and well differentiated grades ()). These data suggest that most of the ICs/ligand are upregulated in circulation of PBC and CRC patients, regardless of their TNM or histological grade.
Figure 2. Relative expression of ICs/ligand in PBC and CRC patients based on their TNM staging and histological grade. Patients were classified according to their TNM and histological garde. Scatter plots of PBC (a) and CRC (c) patients of TNM stage I and II (1) compared to stage III and IV (2), and PBC (b) and CRC (d) patients of histological grade moderate and well differentiated (a) were compared to poorly differentiated (b).
Demethylation enzymes were upregulated in circulation of PBC and CRC patients
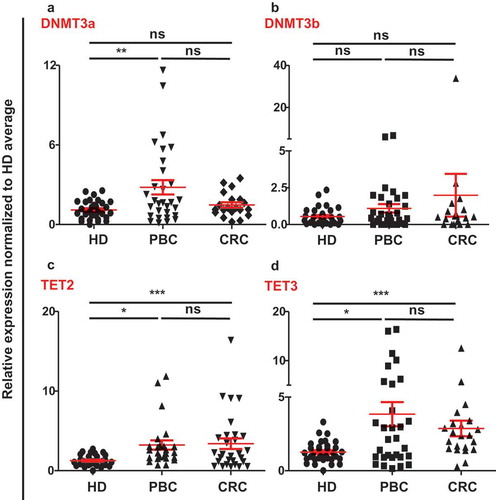
We had already reported that the demethylation enzymes (TETs) were upregulated and methylation enzymes (DNMTs) were downregulated in both PBC and CRC tumor tissues.Citation12,Citation13 To check the contribution of DNA methylation to the upregulation of ICs/ligand in circulation of PBC and CRC patients, we checked the expressions of methylation enzymes, DNMT3a and DNMT3b, and demethylation enzymes TET2 and TET3, compared to HD. We found that DNMT3a was significantly upregulated and no significant change in DNMT3b in PBC samples, compared with HD. In CRC samples, there were no significant differences in both DNMT3a and DNMT3b compared to HD (,)). Of note, both TET2 and TET3 were significantly upregulated in circulation of both PBC and CRC patients, compared with HD (,)). However, there were no significant differences in the expression of TET2 and TET3 in circulation between PBC and CRC patients (,)). These data implicate that active demethylation could be involved in the upregulation of ICs/ligands in circulation of PBS and CRC patients.
Figure 3. Relative expression of methylation/demethylation enzymes in circulation of HD, PBC and CRC patients. Scatter plots show the relative expression of DNMT3a (a), DNMT3b (b), TET2 (c), and TET3 (d) in circulation of PBC, CRC and HD patients. All genes were normalized to β-actin.
Promoter demethylation status of immune checkpoints in circulation of PBC and CRC patients
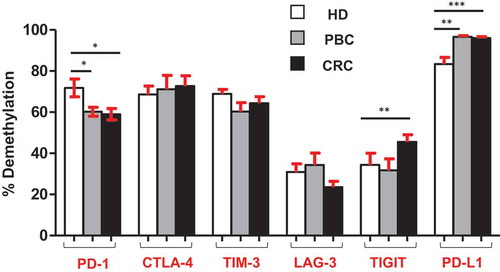
It has been recently reported by our group that promoter demethylation might lead to the upregulation of ICs in the TME of PBC and CRC patients.Citation12,Citation13 Therefore, we investigated DNA demethylation in the promoter regions of PD-1, CTLA-4, TIM-3, LAG-3, TIGIT and PD-L1in PBMCs from the same patients we have previously used for TME studies.Citation12,Citation13 We also confirmed that the relative expression of ICs/ligand in all study populations () and subpopulations (Supplementary Figure 1) used for methylation studies showed the same significance for all genes. Interestingly we found that, PD-L1 was significantly hypomethylated in circulation of PBC and CRC, compared with HD () and ), which is different from our previous findings that it has no significant changes in the TT of PBCCitation12 and CRCCitation13 compared to NT. Moreover, TIGIT was significantly hypomethylated only in CRC, compared with HD () and ). This result was in line with our previous findings in CRC tissues, that TIGIT was significantly hypomethylated in tumor tissues, compared with normal tissuesCitation13 and no difference was found in the PBC TME.Citation12 Of note, the PD-1 was significantly hypermethylated in both PBC and CRC () and ), and no changes in CTLA-4, LAG-3 and TIM-3 (–)) compared to HD. These data suggest that ICs/ligand expressions in all malignancies were not regulated by a unique regulatory mechanism, but somehow could relate to the cancer type and location. Moreover, the expression of PD-L1 and TIGIT could be regulated by DNA methylation epigenetic machinery. Meanwhile, we have not investigated the DNA methylation status of the promoter region of VISTA because we didn’t find any difference in its expression in circulation of cancer patients.
Figure 4. Analysis of CpG methylation status of ICs and PD-L1 in circulation of HD, PBC and CRC patients. Representative plots show the promoter CpG methylation status in PD-1 (a), CTLA-4 (b), TIM-3 (c), LAG-3 (d), TIGIT (e) and PD-L1 (f) in the circulation of 10 HD, 8 PBC and 12 CRC patients as analyzed by bisulfite sequencing of the gDNA. Methylation status of individual CpG motifs is shown by white (demethylation) or grey (methylation) colors.
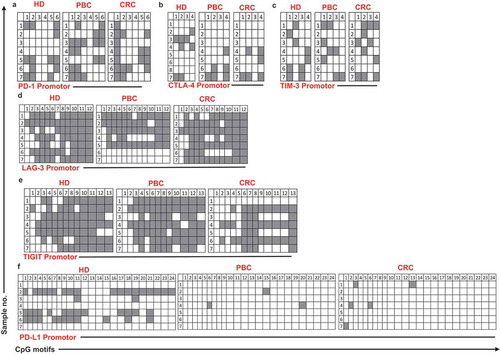
Figure 5. Overall CpG demethylation percentage of ICs and PD-L1 in HD, PBC and CRC patients. Bar plots show the average demethylation percentage of PD-1, CTLA-4, TIM-3, LAG-3, TIGIT and PD-L1 in 10 HD, 8 PBC and 12 CRC patients.
Comparison of ICs/ligand in circulation and tumor tissues of PBC and CRC patients
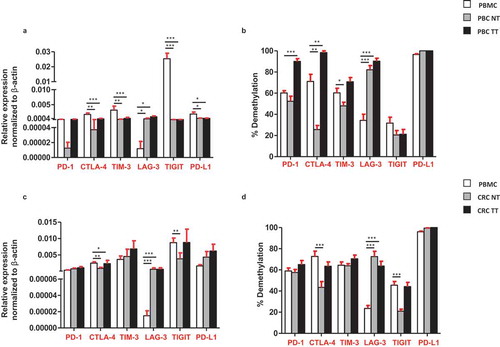
Next, we compared the relative expression and promoter demethylation percentage of ICs/ligand in circulation and tissues of cancer patients. We found that, the relative expressions of CTLA-4, TIM-3, TIGIT and PD-L1 were significantly higher in circulation of PBC patients, compared with TT ()). Moreover, the promoter demethylation percentage was higher for all ICs/ligand in PBC TT, except TIGIT, compared with PBMC, non-significantly ()). In CRC patients, the relative expression of CTLA-4 was significantly higher in circulation compared with TT ()) and the promoter demethylation percentage of CTLA-4 was also significantly higher in circulation compared with TT ()). Of note, the relative expression and promoter demethylation percentage of LAG-3 were significantly higher in both PBC and CRC TT compared with circulation (,)). Interestingly, the relative expression of TIGIT was significantly higher in the circulation of PBC, not in CRC compared with TT. These data rationalize the premise of utilizing relative expression of emerging IC, TIGIT in circulation as a diagnostic/prognostic marker for PBC patients. Additionally, our data also suggest that the relative expression of PD-L1 can also be utilized as a diagnostic/prognostic marker for PBC patients, as it was significantly upregulated in total PBMCs from PBC patients compared with TT ()). These data are in line with previous reports that PD-L1 expression in circulation can be exploited as a prognostic/predictive biomarker in cancer patients.Citation17,Citation18
Figure 6. Comparisons of the relative expression and DNA demethylation percentage of the ICs/PD-L1 in blood, normal and tumor tissues from PBC and CRC patients. Bar plots show the relative expression of ICs/PD-L1 (a) and CRC (c) patients. Bar plots show the CpG demethylation status of the ICs/PD-L1 in blood, NT and TT of PBC (b) and CRC (d) patients.
Discussion
In this study, we focused on the expression of multiple immune checkpoints in the peripheral blood of primary breast and colorectal cancer patients compared with healthy donors. Studies reported that expressions of multiple ICs including PD-1 and CTLA-4 were elevated in the circulation of both PBCCitation19,Citation20 and CRC.Citation21 We have recently reported that the promoter demethylation and post-translational histone modifications play a role in the regulation of immune checkpoints in PBC and CRC tumor tissues.Citation12,Citation13 Herein, we investigated the expression of various ICs/ligand and found that multiple immune checkpoints were elevated in the circulation of both PBC and CRC. Moreover, we checked the promoter DNA methylation pattern of the ICs/ligand and found that the promoter regions of TIGIT in CRC and PD-L1 in both PBC and CRC patients were significantly hypomethylated (). Additionally, we compared the differences in the relative expression and promoter demethylation status of ICs/ligand in the circulation and tumor tissues of the same PBC and CRC patients ( and ), and found that CRC and PBC tumor tissues have different expression and promoter demethylation pattern, compared with periphery. Of note, PD-1 was significantly hypermethylated in circulation of PBC and CRC patients (). However, it was determined that there is no significant difference in other genes promoters. This could be due to other epigenetic mechanisms involved in the regulation of immune checkpoints. It has been reported that multiple epigenetic modifications including acetylation, histone variant exchanges, phosphorylation, non-coding RNAs (miRNAs) and ATP-dependent chromatin remodeling complexes play an indispensable role in the regulation of immune checkpoints in the TME.Citation22 Our previous studies on breast and colorectal tumor tissues showed that apart from promoter DNA demethylation, binding of repressive histones including H3K9me3 and H3K27me3 on the promoter region of ICs could contribute to their upregulation.Citation12,Citation13 We showed that in PBC TT, distribution of both H3K9me3 and H3K27me3 was lower in the promoter region of PD-1, CTLA-4 and LAG-3, while distribution of only H3K27me3 was lower in TIM-3 promoter, compared with NT.Citation12 Additionally, in CRC TT, the distribution of H3K9me3 was lower in PD-1 and TIGIT promoters, H3K27me3 was lower in CTLA-4 promoter, while both H3K9me3 and H3K27me3 were lower in TIM-3 promoter, compared with NT.Citation13 These reports confirm that epigenetic modifications are involved in the upregulation of ICs in the TME. Notably, the co-expression of immune checkpoints in the circulation of PBC and CRC and the epigenetic modifications occurred in their promoter region are important to understand the complex inhibitory immune mechanisms involved in the metastasis of CRC and PBC patients.
It has been reported that PD-L1 is constitutively expressed on triple-negative breast cancer (TNBC) and it could be utilized as a novel therapeutic target.Citation23 Some reports show that a subset of circulating tumor cells (CTC) in breast cancer patients expresses PD-L1, which have a higher metastatic characteristics and higher potential to escape immunosurveillance. Those CTCs are supposed to be the actual target of anti-PD-L1-mediated immunotherapy.Citation24,Citation25 These reports are in line with our data that PD-L1 was upregulated in circulation of PBC patients ()). Additionally, this is the first report demonstrating the expression of PD-L1 in the peripheral blood of colorectal patients. Moreover, in this study, we showed that the promoter region of PD-L1 was significantly hypomethylated in PBC and CRC patients compared with healthy donors (). Altogether, these data showed that the underlying mechanism behind the peripheral upregulation of PD-L1 could be due to the aberrant promoter methylation profile. Additionally, these data demonstrate that the epigenetic regulators such as demethylation inhibitors, together with anti-PD-L1 could be a more successful therapeutic strategy in PBC and CRC patients.
In addition to PD-L1, our data show that the relative expression of TIGIT in CRC and both relative expression and demethylation percentage of TIGIT in PBC were higher in circulation, compared with tumor tissues. To the best of our knowledge, our study is the first report demonstrating the transcriptomic expression of TIGIT in circulation and their direct comparison with CRC/PBC tumor tissues (). It has been reported that TIGIT is expressed on activated T cells, NK cells, memory T cells and also in a subset of Treg cells.Citation26-Citation28 A report showed that the antibody co-blockade of TIGIT and PD-L1 synergistically and specifically enhanced the CD8+ T cell infiltration, resulting in a significant clearance of tumor in pre-clinical models.Citation29 Notably, in this study, we found that the relative expression of TIGIT and PD-L1 in circulation of PBC patients, and CTLA-4 in CRC patients was significantly upregulated, compared with tumor tissue (,c)). These data suggest that transcriptomic expression of PD-L1, TIGIT and CTLA-4 in PBC and CRC could be utilized as a prognostic marker.
Upregulation of certain ICs/ligands in the circulation of both PBC and CRC could be under the control of DNA demethylation in the promoter regions. Notably, TIGIT was significantly upregulated in circulation of PBC and CRC, and the promoter demethylation profile of TIGIT in CRC patients was significantly hypomethylated, which is in line with its relative expression in CRC patients. In addition, PD-L1 was also significantly upregulated in circulation of both PBC and CRC patients.
In accordance with previously published data and our findings, PBC and CRC patients express multiple immune checkpoints according to the site of the tumor, suggesting that different immune therapies could be required for these two different types of cancer. Our findings suggest that promoter methylation pattern of ICs/ligands could be further used as a prognostic biomarker to target PBC and CRC patients. Of note, we have checked different PBC and CRC stage/histological grade. There were no significant differences in the ICs expression in different stages/grades for PBC and CRC patients for all genes except for TIM-3, there was a significant increase in poor/undifferentiated tumor, compared with well/moderate differentiated tumors. Overall, this study advances our current knowledge regarding the relative expression and DNA methylation pattern of the promoter regions of immune checkpoints in the circulation of primary breast and colorectal cancers.
Materials and methods
Samples
Blood samples were collected from 32 HD and untreated 31 PBC and untreated 23 CRC patients prior to surgery. All patients were provided with a written informed consent prior to sample collection. shows the clinical and pathological characteristics of all patients. The study was performed under an ethical approval from Qatar Biomedical Research Institute, Doha, Qatar (Protocol no. 2017–006). All experiments were performed in accordance with relevant guidelines and regulations.
Table 1. Characteristic features of study populations.
DNA and RNA isolation
Total RNA and DNA were extracted using Total RNA/DNA/Protein Purification Plus Kit (Norgen Biotek Corp, Cat: 4700) according to the manufacturer’s instructions. The kit allows the extraction of DNA, RNA and protein. Briefly, the peripheral blood mononuclear cells (PBMCs) were transferred to Eppendorf tubes and resuspended with lysis buffer, followed by 10 min incubation at 55°C. Resuspended samples were transferred into DNA extraction column, where the DNA attach to the gDNA column membrane and the flow through was used for RNA and protein extraction. Subsequently, the flow through from the RNA extraction column was used for protein extraction. Both DNA and RNA concentrations were measured using NanoDrop 2000 (Thermo scientific).
Real-time quantitative reverse transcriptase PCR (qRT-PCR)
Total RNA was extracted as described above, followed by cDNA synthesis using QuantiTect Reverse Transcription Kit (Qiagen, Cat: 205313). The Real-Time PCR reactions were performed using PowerUP SYBR Green Master Mix (Applied Biosystems, Cat: A25742) on QuantStudio 6/7 Flex Real-Time PCR System (Applied Biosystems). PCR amplification was done for the following genes CTLA-4, PD-1, LAG-3, TIM-3, TIGIT, VISTA, PD-L1, TET2, TET3, DNMT3a and DNMT3b. For all genes, the average CT values of HD, PBC and CRC patients were normalized to β-actin, and then the relative expression of each gene was calculated by normalizing against average of HD. Quantification of relative gene expression was determined using 2−ΔΔCT method. The amplification specificity was checked using melting curves and gel electrophoresis. Sequences of all primers are listed in supplementary Table 1a. The primers were designed using Primer3 (http://www.ncbi.nlm.nih.gov/tools/primer-blast/).
CpG methylation analysis by bisulfite sequencing
Extracted genomic DNA from 10 HD, 8 PBC and 12 CRC patients was subjected to bisulfite treatment via EZ DNA Methylation Gold Kit (Zymo Research, Cat: D5006), followed by PCR amplification using TaKaRa Taq polymerase (TaKaRa Bio, Cat: R007A) for PD-1, CTLA-4, TIM-3, LAG-3, TIGIT and PD-L1 promotor regions. The PCR products were cloned into pGEM-T-vector (Promega, Cat: A1360) using DNA Ligation Mighty Mix (TaKaRa Bio, Cat: 6023). The PCR primers were designed using MethPrimer software (http://www.urogene.org/methprimer/index1.html) and the sequences are listed in supplementary Table 1b. Seven colonies were picked from each sample and purified using a resuspension buffer, lysis buffer and neutralization buffer, followed by 100% Isopropanol and 75% ethanol (reagents prepared in house). Samples were sequenced by M-13 reverse/forward primers (supplementary Table 1c).
Sanger sequencing
Purified plasmid DNA samples were subjected to sequencing using 3130X Genetic Analyzer (Applied Biosystems), as described previously.Citation12 Sequencing data were analyzed using Bisulfite Sequencing DNA Methylation Analysis (BISMA) software (Jacobs University, Germany).
Statistical analysis
Statistical analyses were performed using GraphPad Prism 5 software (GraphPad Software, USA). Unpaired t-test was carried out on samples within groups that passed the Shapiro-Wilk normality test. Nonparametric/Mann-Whitney signed rank tests were performed on samples that did not pass normality test. A P value of < 0.05 was considered statistically significant. The P values are represented as; ***P < 0.001, **P < 0.01, *P < 0.05. Data are presented as mean + standard error of the mean (SEM).
Disclosure of potential conflicts of interest
The authors declare that they have no competing interests.
Supplemental Material
Download MS Word (16.7 KB)Supplemental Material
Download MS Power Point (321 KB)Acknowledgments
We are grateful to all patients for donating their samples. We are also grateful to Dr Haytham El Salhat, Oncology Department, Al Noor Hospital, Abu Dhabi, UAE, for collecting patient samples. We also would like to thank the genomics core facility at Qatar Biomedical Research Institute for Sanger sequencing. This work was supported by a start-up grant [VR04] for Dr Eyad Elkord from Qatar Biomedical research Institute, Qatar Foundation.
Supplementary Material
Supplemental data for this article can be accessed here.
Additional information
Funding
References
- Jacobs J, Smits E, Lardon F, Pauwels P, Deschoolmeester V. Immune checkpoint modulation in colorectal cancer: what’s new and what to expect. J Immunol Res. 2015;2015:158038. doi:10.1155/2015/158038.
- Siegel RL, Miller KD, Jemal A. Cancer statistics, 2017. CA Cancer J Clin. 2017;67:7–30. doi:10.3322/caac.21387.
- Wu Y, Sarkissyan M, Vadgama JV. Epigenetics in breast and prostate cancer. Methods Mol Biol. 2015;1238:425–466. doi:10.1007/978-1-4939-1804-1_23.
- Chaudhary B, Elkord E. Regulatory T Cells in the tumor microenvironment and cancer progression: role and therapeutic targeting. Vaccines (Basel). 2016;4(3).
- Passardi A, Canale M, Valgiusti M, Ulivi P. Immune checkpoints as a target for colorectal cancer treatment. Int J Mol Sci. 2017;18:1324. doi:10.3390/ijms18061324.
- Sasidharan Nair V, Elkord E. Immune checkpoint inhibitors in cancer therapy: a focus on T-regulatory cells. Immunol Cell Biol. 2018;96:21–33. doi:10.1111/imcb.1003.
- Jin HT, Ahmed R, Okazaki T. Role of PD-1 in regulating T-cell immunity. Curr Top Microbiol Immunol. 2011;350:17–37. doi:10.1007/82_2010_116.
- Shi T, Ma Y, Yu L, Jiang J, Shen S, Hou Y, Wang E. Cancer immunotherapy: a focus on the regulation of immune checkpoints. Int J Mol Sci. 2018;19(5).
- Lines JL, Pantazi E, Mak J, Sempere LF, Wang L, O’Connell S, Ceeraz S, Suriawinata AA, Yan S, Ernstoff MS, et al. VISTA is an immune checkpoint molecule for human T cells. Cancer Res. 2014;74:1924–1932. doi:10.1158/0008-5472.CAN-13-1504.
- Jin B, Robertson KD. DNA methyltransferases, DNA damage repair, and cancer. Adv Exp Med Biol. 2013;754:3–29. doi:10.1007/978-1-4419-9967-2_1.
- Rasmussen KD, Helin K. Role of TET enzymes in DNA methylation, development, and cancer. Genes Dev. 2016;30:733–750. doi:10.1101/gad.276568.115.
- Sasidharan Nair V, El Salhat H, Taha RZ, John A, Ali BR, Elkord E. DNA methylation and repressive H3K9 and H3K27 trimethylation in the promoter regions of PD-1, CTLA-4, TIM-3, LAG-3, TIGIT, and PD-L1 genes in human primary breast cancer. Clinical Epigenetics. 2018;10:78. doi:10.1186/s13148-018-0512-1.
- Sasidharan Nair V, Toor SM, Taha RZ, Shaath H, Elkord E. DNA methylation and repressive histones in the promoters of PD-1, CTLA-4, TIM-3, LAG-3, TIGIT, PD-L1, and galectin-9 genes in human colorectal cancer. Clin Epigenetics. 2018;10:104. doi:10.1186/s13148-018-0539-3.
- Solinas C, Gombos A, Latifyan S, Piccart-Gebhart M, Kok M, Buisseret L. Targeting immune checkpoints in breast cancer: an update of early results. ESMO Open. 2017;2:e000255. doi:10.1136/esmoopen-2017-000255.
- Waki K, Yamada T, Yoshiyama K, Terazaki Y, Sakamoto S, Matsueda S, Komatsu N, Sugawara S, Takamori S, Itoh K, et al. PD-1 expression on peripheral blood T-cell subsets correlates with prognosis in non-small cell lung cancer. Cancer Sci. 2014;105:1229–1235. doi:10.1111/cas.12502.
- Xie J, Wang J, Cheng S, Zheng L, Ji F, Yang L, Zhang Y, Ji H. Expression of immune checkpoints in T cells of esophageal cancer patients. Oncotarget. 2016;7:63669–63678. doi:10.18632/oncotarget.11611.
- Arrieta O, Montes-Servin E, Hernandez-Martinez JM, Cardona AF, Casas-Ruiz E, Crispin JC, Motola D, Flores-Estrada D, Barrera L. Expression of PD-1/PD-L1 and PD-L2 in peripheral T-cells from non-small cell lung cancer patients. Oncotarget. 2017;8:101994–102005. doi:10.18632/oncotarget.22025.
- Kim HR, Ha S-J, Hong MH, Heo SJ, Koh YW, Choi EC, Kim EK, Pyo KH, Jung I, Seo D, et al. PD-L1 expression on immune cells, but not on tumor cells, is a favorable prognostic factor for head and neck cancer patients. Sci Rep. 2016;6:36956. doi:10.1038/srep36956.
- Syed Khaja AS, Toor SM, El Salhat H, Faour I, Ul Haq N, Ali BR, Elkord E. Preferential accumulation of regulatory T cells with highly immunosuppressive characteristics in breast tumor microenvironment. Oncotarget. 2017;8:33159–33171. doi:10.18632/oncotarget.16565.
- Wang W, Shen G, Wu S, Song S, Ni Y, Suo Z, Meng X, Li D, Zhou L, Hao R, et al. PD-1 mRNA expression in peripheral blood cells and its modulation characteristics in cancer patients. Oncotarget. 2017;8:50782–50791. doi:10.18632/oncotarget.15006.
- Syed Khaja AS, Toor SM, El Salhat H, Ali BR, Elkord E. Intratumoral FoxP3(+)Helios(+) Regulatory T Cells upregulating immunosuppressive molecules are expanded in human colorectal cancer. Front Immunol. 2017;8:619. doi:10.3389/fimmu.2017.00619.
- Dunn J, Rao S. Epigenetics and immunotherapy: the current state of play. Mol Immunol. 2017;87:227–239. doi:10.1016/j.molimm.2017.04.012.
- Sasidharan Nair V, Toor SM, Ali BR, Elkord E. Dual inhibition of STAT1 and STAT3 activation downregulates expression of PD-L1 in human breast cancer cells. Expert Opin Ther Targets. 2018;22:547–557. doi:10.1080/14728222.2018.1471137.
- Kawaguchi K, Suzuki E, Yamaguchi A, Yamamoto M, Morita S, Toi M. Altered expression of major immune regulatory molecules in peripheral blood immune cells associated with breast cancer. Breast Cancer. 2017;24:111–120. doi:10.1007/s12282-016-0682-7.
- Mazel M, Jacot W, Pantel K, Bartkowiak K, Topart D, Cayrefourcq L, Rossille D, Maudelonde T, Fest T, Alix-Panabières C. Frequent expression of PD-L1 on circulating breast cancer cells. Mol Oncol. 2015;9:1773–1782. doi:10.1016/j.molonc.2015.05.009.
- Joller N, Hafler JP, Brynedal B, Kassam N, Spoerl S, Levin SD, Sharpe AH, Kuchroo VK. Cutting edge: TIGIT has T cell-intrinsic inhibitory functions. J Immunol. 2011;186:1338–1342. doi:10.4049/jimmunol.1003081.
- Joller N, Lozano E, Burkett PR, Patel B, Xiao S, Zhu C, Xia J, Tan TG, Sefik E, Yajnik V, et al. Treg cells expressing the coinhibitory molecule TIGIT selectively inhibit proinflammatory Th1 and Th17 cell responses. Immunity. 2014;40:569–581. doi:10.1016/j.immuni.2014.02.012.
- Stanietsky N, Simic H, Arapovic J, Toporik A, Levy O, Novik A, Levine Z, Beiman M, Dassa L, Achdout H, et al. The interaction of TIGIT with PVR and PVRL2 inhibits human NK cell cytotoxicity. Proc Natl Acad Sci U S A. 2009;106:17858–17863. doi:10.1073/pnas.0903474106.
- Johnston RJ, Comps-Agrar L, Hackney J, Yu X, Huseni M, Yang Y, Park S, Javinal V, Chiu H, Irving B, et al. The immunoreceptor TIGIT regulates antitumor and antiviral CD8(+) T cell effector function. Cancer Cell. 2014;26:923–937. doi:10.1016/j.ccell.2014.10.018.