
ABSTRACT
Follicular lymphoma (FL) is a common non Hodgkin’s lymphoma subtype in which immune escape mechanisms are implicated in resistance to chemo-immunotherapy. Although molecular studies point to qualitative and quantitative deregulation of immune checkpoints, in depth cellular analysis of FL immune escape is lacking. Here, by functional assays and in silico analyses we show that a subset of FL patients displays a ‘high’ immune escape phenotype. These FL cases are characterized by abundant infiltration of PD1+ CD16+ TCRVγ9Vδ2 γδ T lymphocytes. In a 3D co-culture assay (MALC), γδ T cells mediate both direct and indirect (ADCC in the presence of anti-CD20 mAbs) cytolytic activity against FL cell aggregates. Importantly, PD-1, which is expressed by most FL-infiltrating γδ T lymphocytes with ADCC capacity, impairs these functions. In conclusion, we identify a PD1-regulated γδ T cell cytolytic immune component in FL. Our data provide a treatment rational by PD-1 blockade aimed at boosting γδ T cell anti-tumor functions in FL.
Introduction
Among the B-cell type non-Hodgkin’s lymphoma (NHL), follicular lymphoma (FL) is the second most frequent entity. FL is characterized in more than 90% of patients by t(14,18) translocation, conferring Bcl-2 overexpression, but also by several alterations of genes involved in epigenetic processes, BCR signaling, cell survival and immune escape.Citation1 This disease is considered to be indolent, stable or with spontaneous remissions prior to progression.Citation2 Loss of disease control suggests a progressive emergence of modifications in the microenvironment and/or in the intrinsic biology of B lymphocytes.
The FL microenvironment contains CD8+ cytotoxic T lymphocytes, regulatory T cells (T-reg cells) and dendritic cells, which are critical to the disease biology.Citation3 Moreover, the role of the immune system in mediating disease progression has been suggested by signatures reflected gene expression by nonmalignant tumor-infiltrating immune cells.Citation4 Thus, FL immune system seems to influence the transition from immune equilibrium to escape, underlying the disease progression. In this context, an improved understanding of mechanisms involved in cancer immune evasion led to identify immune checkpoints as promising targets in cancer therapy. Recently, we showed that FL and diffuse large B cell lymphoma (DLBCL) frequently co-express several immune checkpoint proteins, and simultaneously activate several immune escape pathways.Citation5-Citation7 Our transcriptomic approaches delineated four successive stages in NHL, involving cold to fully immunoedited tumors.Citation5,Citation6 At least for DLBCL, these stages correlate with clinical outcome, as the longest overall survival (OS) is observed in patients presenting immunogenic tumors without immune escape, while the lowest OS is observed in patients with fully immune-edited tumors. Likewise, in FL, most patients exhibit immune-infiltrated tumors suggestive of a high level of immune escape.Citation5
Among the different immune checkpoints, programmed death (PD)-1, expressed by activated T (CD4, CD8 and TCRVγ9Vδ2 γδ T lymphocytes (γδ T cells)) and B lymphocytes, NK and myeloid cells, plays a crucial role in regulating the effector phase of immune response when engaged by its ligands, PD-L1 and PD-L2.Citation8,Citation9 We recently showed that, as in normal tonsils, most FL tumors up-regulate the PD-1 axis and comprise rich infiltrates of, as yet uncharacterized, PD-1+ immune cells.Citation5-Citation7 PD-1 is highly expressed on intratumoral and peripheral blood CD4+ and CD8+ lymphocytes and is associated with impaired T-cell function.Citation10,Citation11 However, an increase in PD-1-positive tumor infiltrating lymphocytes (TILs) and T-reg cell numbers in FL tumors is correlated with improved patient survival, independent of FL International Prognostic Index risk stratification.Citation12 Not only the level of expression or the number of PD-1-expressing cells but also the localization of these cells seem critical for outcome. Indeed, high rates of PD-1high cells within the follicular regions correlate with better outcomes. By contrast, PD-1low cells in interfollicular regions significantly correlate with reduced OS.Citation13
These data led us to propose the existence of, as yet uncharacterized, subsets of immune cells of relevance to immune escape phenotype in FL. In particular, we postulate that the balance between cytolytic and regulatory immune cell subsets might be misregulated. With this in mind, we set out to investigate in FL the role of γδ T cells which represent key immune effectors in solid and hematological cancers,Citation14-Citation18 such as B cell lymphomas.Citation19-Citation22 γδ T lymphocytes, as observed for NK cells, are able to mediate antibody-dependent cellular cytotoxicity (ADCC) in presence of anti-CD20 mAbsCitation19,Citation23 and they have been targeted in few cancer immunotherapy clinical trials with only modest clinical results.Citation16,Citation21 The reasons of these mitigated results remain unclear, but one could speculate the emergence of immune escape mechanisms.
Although γδ T cells are sensitive to PD-1 expression and function,Citation24 the significance of PD-1 targeting for γδ T cell function in NHL has not been explored yet. Thus, we characterized the cytotoxic γδ T cell population infiltrating FL tumors and evidenced the presence of frequent TCRVγ9Vδ2 γδ T lymphocytes expressing both CD16 and PD-1. Our original study involves a novel 3D co-culture model which reveals that PD-1 blockade increases the spontaneous cytotoxicity and ADCC of FL, strongly encouraging the use of anti-PD-1 strategies in FL treatment.
Results
FL samples are infiltrated by abundant γδ T lymphocytes expressing CD16
As a first step to assess the immune infiltrates of FL tumors, we characterized the composition of a series of such samples by immunostaining and flow cytometry. A series of 10 biopsies from non-lymphomatous individuals (control samples) and 10 biopsies from grade I-IIIa FL patients were analyzed to assess their respective levels of CD19, CD3, CD4, CD8, NK (CD3−CD56+) and TCRVγ9+ γδ cells ()). No significant difference is observed between non-tumoral and FL samples, which both comprised CD19+-B cells (~60%), NK (~1%) and T lymphocyte infiltrates (~30%). Among the T lymphocyte population, the γδ subset represents about 10% of the total lymphoid content in both healthy and FL samples and consistently harbors a CD16+ phenotype characteristic of terminally differentiated cytolytic cells ()).
Figure 1. TCRVγ9Vδ2 T cells in FL lymph node biopsies. (a) Representative dot plots of γδ T cells (TCRVγ9+/CD3+), B cells (CD19+/CD3−), and TCRVγ9+/CD16+ cells. (b) Quantification of total B, γδ T, NK (CD3−CD56+) cells, CD4+ and CD8+ lymphocytes from healthy tonsils (black circle, n = 10) and FL lymph nodes (red circle, n = 10). (c) Sample enrichment scores (SES) of different cells subtypes in 198 FL patients and correlation of “γδ T-cell” SES with expression levels of the TRGV9 and TRGV5 genes, and the cytolytic index. (d) Representative section from FL lymph node showing TCR gamma chain staining (red arrow) (bar = 100µm); original magnification x100; zoom insert: original magnification x400).
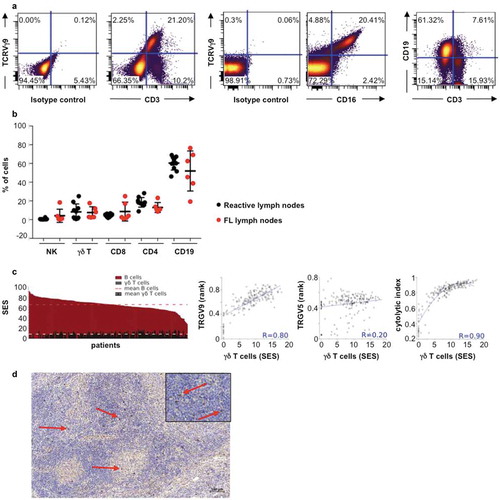
To check whether the abundance of γδ-infiltrating FL was consistently observed beyond our series of samples, we explored a larger cohort of FL tumors by data mining publically available transcriptome datasets (n = 198). Then, sample enrichment scores (SES) for gene signatures defining cell subsets were computed as previously described.Citation5 These analyses show that ‘B cell’ SES are predominant in all FL samples (mean SES for ‘B cells’: 65.4; range: 28.1–91.3), in line with the FL cell of origin ()). The ‘gamma delta cell’ SES (mean SES: 8.5; range: <0.1–17.8), which reflect all subset of TCRγδ, are consistent with the above cytometry results. In addition, these ‘pan-gamma delta cell’ scores, which reflect abundance of all γδ T cells subsets correlate only with the expression levels of the TRGV9 gene (Spearman, R = 0.80), which encodes for TCRVγ9, but not with any other TCRVγ or TCRVδ-encoding gene ()). Consistent with the above-depicted CD16+ cytolytic phenotype of TCRVγ9+ γδ cells, the ‘gamma delta cell’ scores also correlate with the cytolytic index (SES of 8 cytolytic genes) (Spearman, R = 0.90) across the cohort of FL samples ()). Together, these data indicate that in FL, infiltrating T lymphocytes are mainly cytolytic CD16+ γδ T cells.
Localization of this cell subtype was explored in FL biopsies. By immunohistochemical staining for pan-TCR γ chain, we reveal the presence of abundant γδ T cells in FL tumors, mostly localized at the interfollicular spaces ()).
Cytolytic γδ T cells infiltrating FL express PD-1
Although immune infiltrates of FL overexpress the PD-1 axis markers,Citation8,Citation9 the above results did not specify the expression of PD-1 by FL-infiltrating T lymphocytes. So, the cell surface expression of PD-1 was assessed by flow cytometry on FL-TIL from FL biopsies. Of all lymphocytes, TCRVγ9+ γδ T cells display the most intense staining of PD-1 and include the highest proportion of PD-1+ cells (30%, 6% and 1% of PD-1+ cells in CD3 (including γδ T cells), CD4 and CD8, respectively, versus ~20% in γδ T cells ()). Furthermore, these PD-1+ TCRVγ9+ γδ FL-TILs also express CD16 ()), consistent with the above-depicted cytolytic profile of TCRVγ9+ γδ TILs characterized by flow cytometry ()) and gene signatures of FL publically available transcriptomes ()). To validate these findings across a larger set of FL samples, the enrichment scores of a ‘PD-1 axis’ gene set (PDCD1, CD274, PDCD1LG2) were computed for each of the (n = 198) FL transcriptomes. This computational analysis shows that the ‘PD-1 axis’ scores are positively correlated with the 'γδ T cell’ scores (Pearson, R = 0.46) but inversely correlate with ‘B cell’ scores (Pearson, R = – 0.33) across the FL cohort ()).
Figure 2. Expression of PD-1 on FL-infiltrating TCRVγ9Vδ2 T cells. (a) Mean of fluorescence intensity (mfi) of PD-1 in each different CD3, CD8, CD4, γδ T and CD19 cells in FL biopsies (n = 3 ± SD). (b) Percent of PD-1+ cells relative to the number of CD3+ cells for each lymphocyte subtype. Black bars represent the total percent of CD3+ cells, and bars with dots represent the percent of PD1+ cells in three independent FL samples (±SD). (c) Percent of CD16+, PD-1+, and CD16+/PD-1+ cells in the γδ T cells fraction in three independent FL samples (±SD). (d) Correlation between SES for a ‘PD-1 axis’ gene set and that of a ‘γδ T-cell’ (black) or ‘B cell’ (red) geneset. Regression lines are shown for 198 FL transcriptomes. (e) Left: SES dot plots for IEGS33 versus cytolytic index for the 198 FL samples. Right: SES γδ T cells mean ± sd in the 4 groups: group I (IEGS33−/cytolytic index−), group II (IEGS33−/cytolytic index+), group III (IEGS33+/cytolytic index+), group IV (IEGS33+/cytolytic index−).
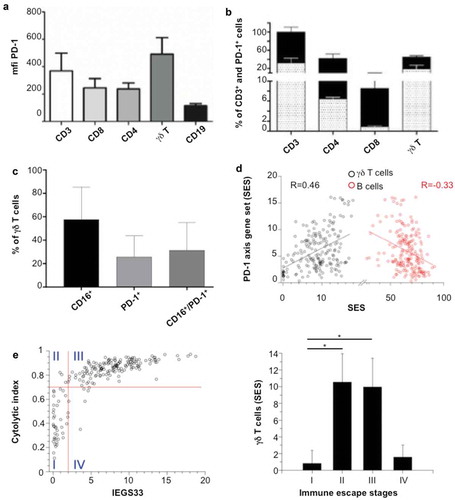
Since the PD-1 axis mediates an immune escape pathway and NHL encompass four stages of immune escape from cold to fully immuno-edited tumors,Citation5 the immune escape profiles and cytolytic indexes of the above-depicted 198 FL were determined. Thus, we observe that 25 samples (12%) have low immune escape and cytolytic index (stage I, cold tumors), 18 samples (9%) have a low immune escape but high cytolytic index (stage II), 147 samples (74%) have high immune escape and cytolytic index (stage III, inflamed tumors), and 8 samples (4%) exhibit a high immune escape but low cytolytic index (stage IV, fully immune-edited tumors) (), left panel). Their respective levels of γδ FL-TILs were determined using the same SES-based scoring system as above. The highest (~10-fold) ‘γδ T cell’ scores and TRGV9 expression levels characterize the FL at immune escape stages II and III (), right panel). These results are fully consistent with the correlation of cytolytic activity in FL biopsies and γδ TILs abundance ()). Of the four stages of immune escape characterized in FL, stages II and III correspond to tumors highly infiltrated by cytolytic T lymphocytes.Citation5 Accordingly, the above data identify γδ T cells as a prominent subset of such FL-infiltrating cytolytic lymphocytes. Furthermore, along with high levels γδ TILs, most FL tumors up-regulate the immune-escape PD-1 axis as exemplified by significant rates of PD-1-positive γδ Τ cells.
A 3D in vitro relevant model for ADCC in FL
In view of the above results, we next wished to explore the function of PD-1 expressed on TCRVγ9+ γδ T cells in FL. To address this, we developed a novel 3D in vitro co-culture model composed of multicellular aggregates of lymphoma cells (MALC)Citation25-Citation27 and primary CD16+TCRVγ9+ γδ T cells derived from healthy donors. In the presence of ADCC inducing mAbs, these co-cultures, which modelize cytolytic attack of FL better than cell suspensions, were analyzed for PD-1 axis expression, γδ T cells and mAbs penetration within the MALC and cytotoxicity against FL cells.
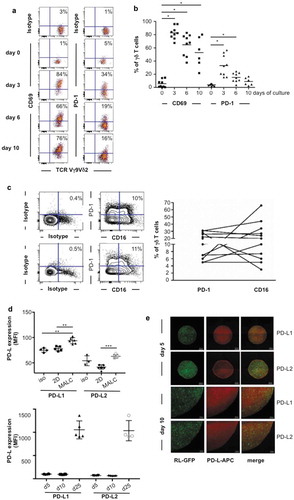
PD-1 expression was determined on primary γδ T cells. Thus, upon in vitro differentiation, γδ T cells alone co-express the activation marker CD69 and PD-1 from day 3 to 10 ()) followed by expression of CD16 ()). A fraction of γδ T cells differentiated in vitro co-expresses CD16 and PD-1 ()) as observed in the FL biopsies ()). The inhibitory function of PD-1 axis relies on interaction with its ligands PD-L1 and/or PD-L2, so their expression was explored in MALC. Although transcriptomic analysis shows that expression of PD-L1 and PD-L2 genes are similar in FL cell suspensions and in MALC (not shown), flow cytometry demonstrates that the expression of their corresponding proteins is higher in MALC than in cell suspension, and increases over time ()). Confocal microscopy experiments were performed to determine the localization of these proteins within MALC, and reveal a homogeneous distribution of PD-L1 and PD-L2 ()).
Figure 3. TCRVγ9Vδ2 T cell- MALC co-culture model. (a) Representative dot plot of CD69 and PD-1 expression in normal γδ T lymphocytes stimulated by BrHPP/IL2. (b) CD69 and PD-1 expression in activated normal γδ T lymphocytes (n = 8–10) at different times of culture. * p < 0.05. (c) Left: representative dot plots of CD16 and PD-1 expression in two γδ T lymphocytes long-term culture obtained from healthy donors. Right: composite result showing CD16 and PD-1 expression in γδ T long-term cell culture (n = 11). (d) mfi of PD-L1 and PD-L2 in RL cells cultured in 2D or in MALC (upper panel at day 10, lower panel at different time points) evaluated by flow cytometry. *: p < 0.05, **: p < 0.01, ***: p < 0.001. (e) Visualization of PD-L1 and PD-L2 by confocal microscopy in MALC realized with RL-GFP at days 5 and 10 of culture.
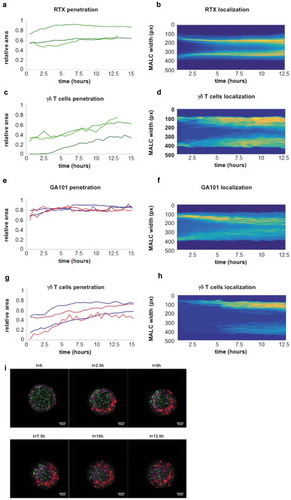
We then determined whether PD-1+CD16+γδ T cells penetrate the MALC for ADCC. For this purpose, cell far red-stained γδ T cells and GFP-MALC were co-cultured with and without fluorescent anti-CD20 mAbs, rituximab (RTX) and GA101. Then, γδ T cells and mAbs penetration into MALC was visualized by video microscopy and monitored by a time-lapse image analysis algorithm. This approach shows a deep penetration of MALC by both mAbs, and that GA101 penetrates faster than RTX ()). Both mAbs progressively diffuse towards the center of the MALC, yielding a more homogeneous spreading of GA101 than RTX ()). Despite the difference of mAbs diffusion kinetics, the γδ T cells penetrate the MALC with similar kinetics in presence of RTX or GA101 () but less deeply than mAbs ()). An example of GA101 and γδ T cells penetration into the MALC is illustrated in ). To note, anti-CD20 mAb treatment induced a deeper penetration of γδ T cells compared to untreated conditions (supplementary Fig 1A) suggesting that anti-CD20 mAb facilitates γδ T cells infiltration.
Figure 4. Visualization of γδ T cells and mAbs penetration within the MALC. (a,c,e,g) Temporal evolution of relative area of mAbs (A, E) and γδ T cells (C, G) with respect to the MALC total area (0 = no penetration, 1 = full penetration) (A, C, n = 3; E, G n = 4). (b,d,f,h) Dynamics and spatial distribution pattern of penetration of mAbs (B, F) and γδ Tcells (D, H) (blue = low intensity signal, yellow = high intensity signal) within the MALC for one experiment. (i) Visualization of MALC-GFP (green), GA101 (purple) and γδ T cells (red) at multiple time points. All the images were taken from the same z-plane inside the MALC.
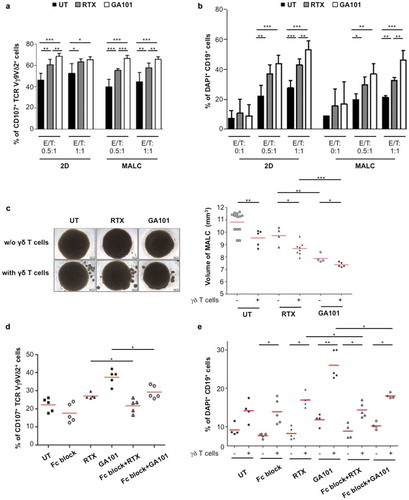
Cytolytic PD-1+γδ T cells penetrate MALC in presence of ADCC-inducing mAbs, but whether this model allows effective ADCC remained to be addressed. For this purpose, γδ T cells and MALC were co-cultured at different cell ratios in presence or absence of anti-CD20 mAbs prior to analyzing γδ T cells degranulation via the cell surface CD107+ and FL cell death via DAPI staining. Without mAbs, γδ T cells exhibit a basal cytotoxicity attested by ~40% of CD107+ γδ T cells ()) and ~10–30% of DAPI+ FL cells ()), which decreases the MALC volume ()). Although ADCC may be assessed in FL cell suspension assays,Citation19 γδ T cells cytotoxicity capacity against whether aggregated FL cells remained undetermined. Thus, γδ T cells cytotoxicity upon co-culture with FL cells in suspension (2D) or in aggregates (MALC) were compared. Of note, neither of RTX or GA101 alone after 4 hrs is directly toxic to the FL cells in any condition ()). In the presence of γδ T cells however, both CD107+ γδ T cells and DAPI+ FL cells reveal that ADCC occurres in MALC as well as in cell suspension ()). Consequently, the MALC volume is decreased after 24 hrs of ADCC ()). The following lines of evidence demonstrate that both cytolytic degranulation and target cell death resulted from CD16-mediated ADCC. First, both readouts are significantly inhibited by Fc-blocking antibody ()). Second, activation signaling induces the ADCC-specific p38 phosphorylation in γδ T cells (Supplementary Fig 2), and third, GA101, the mAb with higher affinity for CD16 as a consequence of glycoengineering,Citation28 induces the strongest responses in this assay compared to RTX ().
Figure 5. In vitro ADCC in TCRVγ9Vδ2 T cell- MALC co-culture model. RL cells in suspension (2D) or MALC at day 10 of culture were incubated or not with γδ T cells at the indicated ratios (effector (γδ T cells):target (RL cells); E:T) in presence or not (UT) of RTX or GA101 at 10 µg/ml. (a,b) ADCC was measured after 4 hrs by cytolytic activity of γδ T cell effectors (% of CD107a+ γδ T cells- A) and by FL target cell death (% of DAPI+ CD19+ cells- B). (c) MALC volume was visualized and measured after 24 hrs. (d, e) γδ T cells were preincubated 20 min with 5 µg/ml of Fc blocker and then co-cultured with MALC (day 10) at E:T 0.5:1 in presence of not (UT) of mAbs at 10 µg/ml. Percent of CD107+ γδ T cells and DAPI+CD19+ were measured after 4 hrs. Each point represents an independent sample and red lines represent the median for each condition. *: p < 0.05, **: p < 0.01, ***: p < 0.001.
Altogether, these data validate the model of PD-L1+MALC/PD-1+CD16+γδ T cells co-culture to assess FL cells ADCC induced by mAbs and further explore PD-1 axis function in this model.
PD-1 blockade potentiates ADCC of FL in vitro
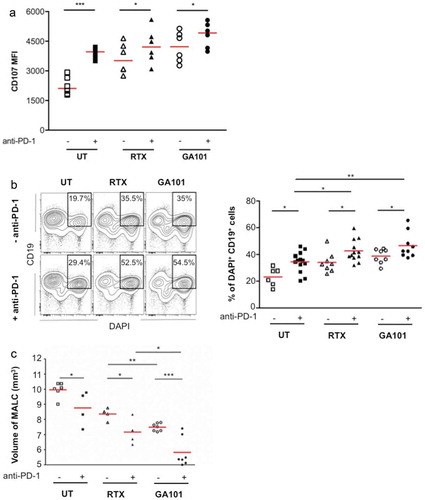
PD-1 plays a critical role in immune escape and PD-1 blockade has been proposed to reestablish the immune anti-tumor response. To investigate this, we determined whether PD-1 blockade in the above model increases GA101 and RTX-induced ADCC of FL. Primary TCRVγ9+ γδ cells were pre-treated with the anti-PD-1 mAb and then incubated with MALC, either alone or with RTX or GA101. Ratios used in these experiments were deliberately chosen low (0.5:1 and 1:1) to be clinically relevant. γδ T cells degranulation ()) and FL cell death were determined after 4 hrs ()) and volume of MALC after 24 hrs ()). Consistent with the well-known TCRVγ9+ γδ T cells killing of B-NHL target cells (Citation19 and ), the primary γδ T cells alone spontaneously kill MALC cells and anti-PD-1 mAb increases this baseline lytic activity (). In the presence of either anti-CD20 mAbs, MALC cytolysis increases significantly as a result of ADCC induction. With the anti-CD20 mAbs and TCRVγ9+ γδ T cells pretreatment by the anti-PD-1 mAb, the ADCC is increased (), yielding again higher ADCC with GA101 than with RTX. Similar results are obtained with lower doses of anti-CD20 mAbs (Supplementary Fig 3). The fact that PD-1 blockade increases CD107 expression (mfi) on Vgamma9Vdelta2 T cells ()) and not rate of cells (data not shown), suggest that anti-PD-1 mAb strengthens the degranulation from the same pool of activated cytotoxic Vgamma9Vdelta2 T cells. Therefore, PD-1 blockade on γδ T cells enhances in vitro ADCC of aggregated FL cells.
Figure 6. Effect of anti-PD-1 mAbs on ADCC induced by anti-CD20. γδ T cells were pretreated or not for 12 hrs with anti-PD-1 mAb at 10 µg/mL and added to MALC at day 10 of culture at an E/T ratio of 0.5:1. (a,b) ADCC was measured after 4 hrs by cytolytic activity of γδ T cell effectors (% of CD107a+ on γδ T cells- A) and by FL target cell death (% of DAPI+ CD19+ cells- B). (c) MALC volume was visualized and measured after 24 hrs. Each point represents an independent sample and red lines represent the median for each condition. *: p < 0.05, **: p < 0.01, ***: p < 0.001.
PD-1 blockade potentiates ADCC of FL in vivo
The above results prompted us to investigate the impact of anti-PD-1 mAb on ADCC of FL in vivo. RL cells were engrafted in groups of (n = 6) SCID-Beige mice, and once tumors became palpable, primary PD-1+CD16+TCRVγ9+ γδ T cells were injected together with or without GA101 and anti-PD-1 mAb, as depicted below. Tumor growth was then monitored by tumor volume (TV). For each condition, a polynomial regression equation of order 2 was calculated and plotted as well as the confidence interval ()). Control mice develop FL tumors within 30 days, whereas mice treated by γδ T cells exhibit a slower tumor growth. Treatment by γδ T cells + anti-PD-1 mAb moderately reduces the tumor growth, whereas γδ T cells + GA101, which enhance active γδ T cells intratumoral infiltration (supplementary Fig 1B-E), for ADCC-based treatment is more effective over the course of this study. As seen with γδ T cells alone, adding anti-PD-1 mAb to the above ADCC settings tends to improve this therapeutic response ()). Regression curves in the experimental day range were compared two by two using a Kolmogorov-Smirnov test to appreciate the kinetic evolution. Except for the condition FL-γδ T cells compared to FL cells, all other conditions are significantly different.
Figure 7. In vivo effect and localization of anti-PD-1 mAb. (a) SCID-Beige mice were engrafted with RL cells. 5 cohorts of 6 animals were treated or not with anti-PD-1 (10 mg/kg), GA101 (30 mg/kg) or both in the presence (FL + γδ T) or absence (FL cells) of γδT cells. Tumor volume (TV) was measured with a caliper and results represent the mean of TV in mm3 for 6 independent mice in each condition. (b) Tumor and anti-PD-1 mAb visualization at day 29 post-engraftment by IVIS Spectrum on representative mice injected with γδ T cells and treated with NIR-labeled anti-PD-1 (25 µg) alone or in combination with GA101 (30 mg/kg). Left panel, FL tumor (RL-LUC) visualized by bioluminescence imaging. Right panel, NIR-labeled anti-PD-1 visualized by fluorescence imaging. Yellow circle: region of interest (ROI).
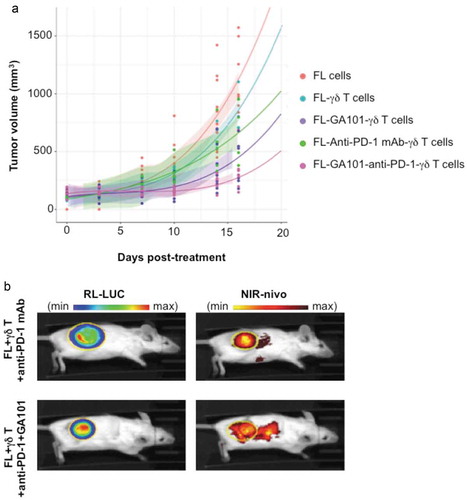
Imaging of the NIR-labeled anti-PD-1 mAb in mice at day 16 post-treatment evidences its accumulation within the bioluminescent FL tumor ()). The tumor bioluminescence is accordingly lower when treated by anti-PD-1 mAb + ADCC co-treatment than by γδ T cells + anti-PD-1 mAb alone (radiance efficiency/radiance ratio of 0.12 and 0.03, respectively). These data suggest that, in vivo, anti-PD-1 mAb enhances the anti-CD20-induced ADCC of FL cells.
Discussion
This study was undertaken to characterize the immune population infiltrating FL tumors, and to explore its function in the immune escape context associated to this pathology. Our study was in line with previous computational predictionsCitation29-Citation31 and we demonstrated that cytolytic PD1+ CD16+ TCRVγ9Vδ2 γδT lymphocytes represent a significant fraction of FL-infiltrating lymphocytes, extending previous profiling of γδ TIL across human cancer.Citation32 The fact that intratumoral infiltration of γδ T cells is enhanced by anti-CD20 mAbs treatment both in vitro and in vivo (supplementary Fig 1) is important in view of applying immune checkpoint–based cancer immunotherapies for tumors displaying peripheral exclusion, or even with cold (desert) immune infiltrates.
Vgamma9Vdelta2 T cells can recognize tumor cells by different mechanisms involving T-cell receptor or NK-cell receptor (Citation33 and recently reviewed in Citation18). Among tumor cells, γδ T cells spontaneously recognize B cells lymphomas and exert a baseline level of cytotoxicity.Citation20,Citation34,Citation35 Accordingly here, this basal level of cytotoxicity (i.e. without any anti-CD20 mAbs) was observed as expected, both in vitro against 3D culture of FL cells () and in vivo against FL tumor xenografts (). Such baseline activities, possibly TCR-driven, are also under the control of PD-1 regulation as shown by activity of PD-1 blockade (, )). Recently our laboratory depicted that most FL tumors up-regulate the PD-1, PD-L1, PD-L2 (immune escape axis) compared to normal tonsil, and comprise a rich, but uncharacterized, infiltrate of PD-1+ immune cells.Citation5-Citation7 Here, we showed that high levels of cell surface PD-1 are evidenced on nearly half of FL-infiltrating γδ T cells, unveiling their relation to immune escape stages of FL. Based on expression of 33 genes, about 70% FL biopsies show an immune escape stage III signature characterized by high infiltration of T lymphocytes, advanced immune escape and longer survival rate than stage IV (IEGS+, T cell activation−).Citation5 So, the phenotype profile of the FL-infiltrating γδ T cells depicted in this study corresponds to this stage III (). This is important to consider in order to explain why the number of PD-1+ cells infiltrating the tumor is a predictor of FL patients’ survival.Citation12 In Carreras’s study, one could speculate that patients with lower overall survival should exhibit a stage IV profile. Thus, our study highlights the importance to characterize FL patients based on their IEGS and T cell activation profiles allowing their stratification for future immune checkpoint blockade therapies. It is clear that patients exhibiting the “immune battlefield” type of tumors, i.e. tumors with both activated cytolytic T cells and suppressive myeloid cells, are more relevant for these treatments than those presenting an immune desert. The biomarkers predictive of clinical response to immune checkpoint-based immunotherapy include among the main criteria, tumor immune-infiltration, mutational load, gut microbiome, and expression of the targeted biomarker. Hence the rate of activated TILs, which means of T cells expressing markers of TCR activation, indeed correlates with better clinical outcome.Citation12,Citation13 However, TCR activation is well known to induce within 48-72h the cell surface expression of PD-1, among other markers (reviewed by Citation36). This latter is thought to help resuming the active phase of the T cell response. Hence, in the experimental settings presented in our study, PD-1-blockade impairs likewise this termination process, and extends the active phase of the cytotoxic response.
Co-expression of CD16 and PD-1 by FL-infiltrating γδ T cells raises the question whether PD-1-mediated immune escape impacts ADCC efficacy of γδ T cells in a PD-1-mediated immune escape context. Indeed, 72% of FL tumor cells express PD-L2 in situ.Citation6 So, whether anti-PD-1 mAb improves the efficacy of anti-CD20 antibodies in FL remained to be investigated using relevant models. Very few « realistic » in vitro models of NHL are available, they include MALC,Citation25-Citation27 ex vivo engineered immune organoids integrating the lymphoma nicheCitation37 and lymphoma-on-chip integrating vasculature.Citation38 Although MALC lack FL microenvironmental cell populations,Citation39 its 3D architecture, gene and protein profiles make it more relevant than long-used cell suspension cultures for exploration of drug activity.Citation25-Citation27 Further investigation will be necessary to decipher the precise mechanism by which PD-1 is able to block γδ T cell-mediated ADCC, but based on recent studies on NK cells, one can speculate that PD-1 signaling blocks lytic granule polarization and consequently cytotoxicity.Citation40 Furthermore, since FL cell growth in multicellular aggregates confers innate resistance to cytolytic lymphocytes,Citation26 the FL MALC-PD-1+CD16+ γδ T cells co-culture is an adequate model to explore the immune cells infiltration within FL mass and anti-CD20-induced ADCC. The image production and analysis pipeline specifically developed for and applied to this model evidence for the first time a distinct pattern of MALC penetration by the RTX and GA101 mAbs, followed by the γδ cell infiltration. Although RTX distribution impacts efficacy,Citation41 whether the differential penetration by RTX and GA101 has therapeutic relevance for FL remains to be explored. Moreover, additional investigations deciphering the mechanisms by which anti-CD20 mAbs enhance γδ Τ cells infiltration deserve further efforts. In vivo, PD-1 blockade induces a slower growth of FL tumors compared to untreated mice suggesting a direct effect on γδ T cells by enhancing their cytotoxicity. It is interesting to relate these results with those obtained in relapsed/refractory FL patients where the anti-PD1 mAb in monotherapy induced a 40% ORR.Citation42 Combination of anti-PD-1 mAbs and anti-CD20 mAbs show an important benefit with 66 to 80% ORR observed.Citation43,Citation44 Based on our results, one could speculate that, in these patients, blockade of PD-1 on γδ T cells improves the efficacy of ADCC-based therapeutic regimens. Future ancillary studies should allow stratification of responsive FL patients according to their respective immune escape profiles involving γδ infiltrating T cells.
Materials and methods
Cell lines and mAbs
The human FL cell line RL was obtained from the American Type Culture Collection (ATCC, Rockville, MD, USA). The cells were cultured in suspension (referred as 2D culture) in complete RPMI1640 medium at 37°C in a humidified atmosphere containing 5% CO2. We routinely tested for mycoplasma contamination by using Mycoplasma Alert (Lonza, Basel, Switzerland). The RL-GFP cell line was generated (Vector facility, CRCT, Toulouse, France) by transduction with lentivector particles obtained from the pTRIP-puro-CMV EGFP vector. The RL cell line expressing luciferase (RL-LUC) was generated by transfection with the retroviral vector pLHCX-luc (kindly provided by Dr. Xavier Bofill-De Ros at the IDIBAPS, Barcelona, Spain).
Rituximab (RTX, MabThera) and obinutuzumab (GA101), both anti-CD20 mAbs of class IgG1 were provided by Roche. Anti-PD-1 mAb of class IgG4 was obtained from the Department of Pharmacy at the IUCT (Toulouse). The human Fc blocker used for the ADCC experiment was purchased from BD Biosciences (Le Pont de Claix, France).
MALC preparation and volume determination
Multicellular aggregates of lymphoma cells (MALC), referred also in the study by 3D culture were obtained with RL or RL-GFP cells by the hanging drop method, as described previously.Citation25-Citation27 MAbs were added to the MALC after 5 or 10 days of growth, as specified in the text. The volume of MALC was calculated using the formula V = 4/3 x π x [(L x l2)23] (where L is the longest diameter and l is the shortest diameter of the aggregate). Between five and ten biological replicates were used for each measure.
γδ T cell cultures
Primary γδ T cell cultures were generated from peripheral blood mononuclear cells of healthy donor (Etablissement Français du Sang, Toulouse, France) as described previously.Citation15 After 10–12 days of culture, γδ T cell purity was > 95% as determined by flow cytometry using an anti-TCRVγ9 mAb (FITC, clone B3, BD Biosciences) and an anti-CD3 mAb (BV421, clone UCHT1, BioLegend, St-Quentin-en-Yvelines, France). Expression of other cell surface markers was determined by flow cytometry using antibodies against CD16 (APC-Cy7, clone 3G8, BioLegend), CD69 (PE-cyanine 5, clone FN50, BioLegend) and PD-1 (AF647, BD Biosciences).
In some experiments, short-term culture of γδ T cells was used. Briefly, normal peripheral blood mononuclear cells were cultured with CD3/CD28-activating beads (Thermofisher, Courtaboeuf, France) (at a CD3+ lymphocyte:bead ratio of 1:1), 250 nM bromohydrin pyrophosphate (BrHPP) and IL-2 (400U) for the indicated time and the resulting phenotype was determined as described above.
FL patients
Lymph nodes were obtained from 10 patients at the Department of Hematology (IUC, Toulouse-Oncopole), who were diagnosed between 2010 and 2014 with FL (Grade I to III-a according to the WHO classification), and who had not received prior therapy.Citation45 The healthy specimens used as controls were obtained from tonsillectomy samples (n = 10). Tissue samples were collected and processed following the standard ethical procedures of the Helsinki protocol, after obtaining written, informed consent from each donor and local ethical committee approval for the study (Comité de Protection des Personnes Sud-Ouest et Outremer II).
Primary FL cell isolation and culture
Fresh tissues from lymph nodes or control lymphoid tissues were dissociated using the gentleMACS™ Octo Dissociator (Miltenyi, Paris, France). Cell suspensions were frozen in 4% human albumin (VIALEBEX 40 mg/ml, LFB Biomedicaments)/10% DMSO until FL diagnosis. The cells were then rapidly defrosted, filtered through 70 µm nylon cell strainers, plated at a density of 107 cells/ml in complete medium and their phenotypes were analyzed by FACS after staining with Pacific Orange-labeled anti-CD3 (clone UCHT1, BD Biosciences), PE-Cy7-labeled anti-CD4 (clone SK3, BD Biosciences), Alexa 700-labeled anti-CD8 (clone B9.11, Beckman Coulter), ECD-labeled anti-CD19 (clone J3-119, Beckman Coulter), FITC-labeled anti-gamma 9 (clone B1, BioLegend), PE-labeled anti-CD56 (clone AF12-7H3 Miltenyi-Biotec), Alexa 647-labeled anti-CD16 (BioLegend), and BV421-labeled anti-PD-1 (EH12.1, BD Biosciences).
Immunohistochemistry
Three-mm-thick sections of formalin-fixed and paraffin-embedded (FFPE) normal tonsil and FL lymph node tissues were stained with anti-TCRVγ antibodies (clone gamma 3.20, Thermofisher) and analyzed automatically by using a Ventana BenchMark XT immunostainer (Ventana, Tucson, AZ). Whole slides were scanned by using Pannoramic digital slide scanners (3DHISTECH, Budapest, Hungary) and read by a pathologist at the IUCT (Toulouse, France).
PD-L1 and PD-L2 detection by flow cytometry and confocal microscopy
PD-L1 and PD-L2 in RL-GFP cells cultured in 2D or in MALC were stained with APC-labeled anti-PD-L1 (clone MIH18) or APC-labeled anti-PD-L2 (clone MIH1) antibodies (BD Biosciences) and analyzed by flow cytometry on a BD LSR II flow cytometer (BD Biosciences) or by confocal fluorescence microscopy on a Zeiss LSM 780 confocal laser scanning microscope.
Time-lapse microscopy and image analysis
MALC of RL-GFP cells, prepared as described above, were placed in the wells of µ-Slide VI slides (Ibidi, Planegg/Martinsried, Germany) containing 60 µl of complete medium. Twenty-four hours later, the cells were incubated with CF555-labeled mAbs RTX or GA101 (10 µg/ml) and with cell far red-labelled γδ T cells at an effector : target ratio (E : T) of 5 : 1. The living cells were imaged by using a 10 x/N.A. 0.30 objective on a LSM 780 confocal microscope equipped with an incubation system (PeCon–Zeiss) to regulate the temperature (37°C) and CO2 (5%). Stacks of 30 z-sections were captured every 30 min over more than 30 hrs.
To quantify γδ T cells and antibody (RTX and GA101) penetration into the MALC, each temporal stack of images composed of three channels (γδ T-cells, antibody, and MALC) was processed in a fully automatized way as follows. The MALC were tracked in the time series by using dynamical segmentation based on non-local means (NLM) denoisingCitation46 and adaptive thresholding. Classical mathematical morphology methods were used to obtain a mask that was applied to the three channels of the stack for further processing. This mask was then used to localize the signals from γδ T cells and antibodies within the MALC before a final segmentation step based on the thresholded convolution with a blur kernel. The resulting data were finally processed and displayed by using MATLAB Statistics and Machine Learning Toolbox Release 2015b (The MathWorks, Inc., Natick, MA, USA).
ADCC assay
The γδ T cells were pre-incubated overnight with or without an anti-PD-1 mAb at 10 µg/ml. The γδ T cells were then co-cultured with MALC (day 10 of culture) in 96-well plates at E:T ratios of 0.5:1 and 1:1 for 4 hrs at 37°C and 5% CO2 in the presence of anti-CD20 mAbs (5 or 10 µg/ml) and anti-PD-1 mAb (10 µg/ml). PE-Cy5-labeled anti-CD107a or an isotype-matched control antibody (BD Biosciences) was added during the co-culture to assess γδ T cells degranulation. After 4 hrs of incubation, the co-cultures were mechanically dissociated and labeling solution containing TCRγ9-FITC (clone B3, BD Biosciences), CD3-PE/Cyanine 7 (clone UCTH1, CliniSciences, Nanterre, France) and CD19-PE (IoTest®, Beckman Coulter, Marseille, France) was added for 15 min at 4°C in the dark. The cells were then washed, stained with DAPI (Sigma Aldrich, St Quentier Fallavier, France) and analyzed by flow cytometry on a BD LSR II flow cytometer (BD Biosciences). The extent of γδ T cells degranulation was estimated from the proportion of CD107+ cells in the TCRVγ9+ population, and FL cell death was estimated from the proportion of DAPI+ cells among the CD19+ population.
When ADCC was determined in the presence of the Fc blocker antibody, γδ T cells were preincubated for 20 min with 5 µg/ml of the Fc blocker antibody before they were co-incubated, as described above, with MALC.
Gene expression analysis
The GEO DatasetsCitation47 were sourced for FL gene expression profiles obtained with the Affymetrix HG U133 plus 2.0 microarray platform. We downloaded raw data from studies GSE53820,Citation48 GSE55267,Citation29 GSE65135,Citation49 GSE16024 (unpublished), GSE21554Citation50 and GSE38816Citation30 and normalized these together by the method RMA. Then, these transcriptomes were collapsed to around 21000 HUGO protein-encoding gene symbols. The sample enrichment scores (SES) were computed by Auto-Compare-SES (https://sites.google.com/site/fredsoftwares/products/autocompare_ses) with normalized settings.Citation5 The γδ T cell and B cell gene sets were from CIBERSORT,Citation29,Citation50 the cytolytic T cell gene sets included GZMA, PRFN, GZMB, GZMK, GZMM, GZMH, TRAIL and IFNG, and the PD-1 axis gene set included PDCD1 (PD-1), CD274 (PD-L1) and PDCD1LG2 (PD-L2). Whenever specified, Pearson correlations were computed between gene ranks and SES.
FL mouse model
Seven million RL cells were injected subcutaneously (sc) into the right flanks of 10 weeks-old, female SCID-Beige mice, according to the INSERM Animal Care and User Committee-approved protocol (n° 2016–090212091849). When tumor volumes (TV), as measured by caliper and calculated using the formula [(length x width2)/2], reached 100 mm3, the mice were divided into five groups of four animals, receiving or not 10–15 millions γδ Tcells (long term culture verified for TCRVγ9, CD16, PD-1 expression prior to injection) intraperitoneally (ip) twice a week. For treatments, GA101 (30 mg/kg, once a week), anti-PD-1 mAb (10 mg/kg, twice a week), or GA101 and anti-PD-1 mAbs combination were injected ip.
Anti-PD-1 mAb imaging in vivo
To follow anti-PD-1 mAb in vivo, 7 × 10⁶ RL-LUC cells were engrafted sc into SCID-Beige mice. When the tumors were palpable, the mice were injected twice a week ip with 15 millions γδ T cells, prepared as described above, and treated either with NIR-labeled anti-PD-1 mAb (PerkinElmer, Villebon/Yvette, France) (25 µg, ip, twice a week), or with GA101 mAb (30 mg/kg, ip, once a week), or with both. Tumors and anti-PD-1 mAb were visualized by IVIS Spectrum in vivo imaging of bioluminescence (at 740 nm, after injection of 150 mg/kg XenoLight RediJect D-Luciferin (PerkinElmer) and fluorescence (at 780 nm) respectively after 3 weeks post-treatment.
Statistics
Data shown are means ± SD. For comparison of two series of normally distributed variables, we used paired and one-tailed Student’s t tests with α = 0.05 for statistical significance. When comparing three or more parameters, a one-way ANOVA with Dunnett’s multiple comparison post-test correction was used.
Abbreviations
FL: follicular lymphoma
MALC: multi cellular aggregates of lymphoma cells
PD-1: programmed death-1
ADCC: antibody -dependent cell cytotoxicity
γδ Τ cells: TCRVγ9Vδ2 lymphocytes
RTX: rituximab
ssGSEA: single sample gene set enrichment analysis
SES: sample enrichment score
TCR: T cell receptor
TIL: tumor infiltrating lymphocytes.
Additional information
Software for SES analysis can be downloaded via the following link:
https://sites.google.com/site/fredsoftwares/products/autocompare_ses
Author contribution
CR and CB designed the experimental strategy, organized the experiments and collected and analyzed the data.
PG performed FL samples isolation and flow cytometry analysis.
CR, ED, JB and MP generated γδ Τ cells from healthy donors
CR, ED, JB and CB performed in vitro experiments.
CB, MP and CJ performed in vivo experiments.
MT generated SES software and performed analysis by data mining with CR, CB, JJF and CL.
DMF performed experiments of PD-1 and CD69 on γδ Τ cells isolated from healthy donors.
CL selected FL biopsies, performed and analyzed IHC experiments.
RM and JML generated the specific algorithms for image analysis.
LL helped for time-lapse microscopy imaging.
AS and CK provided experimental advices.
AMC and PPG provided RL-LUC cells.
CR, JJF and CB wrote the manuscript.
All authors discussed and approved the manuscript.
Authorship and conflict-of-interest statements
Ariel Savina and Christian Klein are employees of Institut Roche and Roche respectively. Renaud Morin and Jean-Michel Lagarde are employees of Imactiv3D.
Disclosure of Potential Conflicts of Interest
No potential conflicts of interest were disclosed.
Supplemental Material
Download MS Word (66.7 MB)Acknowledgments
This work was funded by institutional grants from INSERM, Université Paul Sabatier and CNRS, Laboratoire d’Excellence TOUCAN (contract ANR11-LABEX), Institut Hospitalo-Universitaire Programme CAPTOR (ANR-11-PHUC-0001) and Roche (R16067BB). C. Rossi receives a grant from ITMO Cancer dans le cadre du Plan Cancer 2014-2019. P. Gravelle is supported by the CALYM Carnot Institute. Authors thank Mary Callanan (CHU Dijon, France) and all members of J. J. Fournié’s team (CRCT, Toulouse, France) for their stimulating comments on this work, G. Revillon from Perkin Elmer for helpful advice, and all staff from CREFRE – especially S. Gandarillas and C. Escassut – for their help and kindness.
Supplementary material
Supplemental data for this article can be accessed on the publisher’s website.
Additional information
Funding
Related Research Data
References
- Huet S, Sujobert P, Salles G. From genetics to the clinic: a translational perspective on follicular lymphoma. Nat Rev Cancer. 2018;18(4):224–239. doi:10.1038/nrc.2017.127.
- Horning SJ, Rosenberg SA. The natural history of initially untreated low-grade non-Hodgkin’s lymphomas. N Engl J Med. 1984 Dec 6;311(23):1471–1475. doi:10.1056/NEJM198412063112303.
- de Jong D. Molecular pathogenesis of follicular lymphoma: a cross talk of genetic and immunologic factors. J Clin Oncol. 2005;23(26):6358–6363. doi:10.1200/JCO.2005.26.856.
- Dave SS, Wright G, Tan B, Rosenwald A, Gascoyne RD, Chan WC, Fisher RI, Braziel RM, Rimsza LM, Grogan TM, et al. Prediction of survival in follicular lymphoma based on molecular features of tumor-infiltrating immune cells. N Engl J Med.2004;351(21):2159–2169. doi:10.1056/NEJMoa041869.
- Tosolini M, Algans C, Pont F, Ycart B, Fournié JJ. Large-scale microarray profiling reveals four stages of immune escape in non-Hodgkin lymphomas. Oncoimmunol. 2016;5(7):e1188246. doi:10.1080/2162402X.2016.1188246.
- Laurent C, Charmpi K, Gravelle P, Tosolini M, Franchet C, Ysebaert L, Brousset P, Bidaut A, Ycart B, Fournié JJ. Several immune escape patterns in non-Hodgkin’s lymphomas. Oncoimmunol. 2015;4(8):e1026530. doi:10.1080/2162402X.2015.1026530.
- Gravelle P, Burroni B, Péricart S, Rossi C, Bezombes C, Tosolini M, Damotte D, Brousset P, Fournié JJ, Laurent C. Mechanisms of PD-1/PD-L1 expression and prognostic relevance in non-Hodgkin lymphoma: a summary of immunohistochemical studies. Oncotarget. 2017;8(27):44960–44975. doi:10.18632/oncotarget.16680.
- Goodman A, Patel SP, Kurzrock R. PD-1-PD-L1 immune-checkpoint blockade in B-cell lymphomas. Nat Rev Clin Oncol. 2017;14(4):203–220. doi:10.1038/nrclinonc.2016.168.
- Hude I, Sasse S, Engert A, Bröckelmann PJ. The emerging role of immune checkpoint inhibition in malignant lymphoma. Haematologica. 2017;102(1):30–42. doi:10.3324/haematol.2016.150656.
- Yang ZZ, Novak AJ, Stenson MJ, Witzig TE, Ansell SM. Intratumoral CD4+CD25+ regulatory T-cell-mediated suppression of infiltrating CD4+ T cells in B-cell non-Hodgkin lymphoma. Blood. 2006;107(9):3639–3646. doi:10.1182/blood-2005-08-3376.
- Myklebust JH, Irish JM, Brody J, Czerwinski DK, Houot R, Kohrt HE, Timmerman J, Said J, Green MR, Delabie J. High PD-1 expression and suppressed cytokine signaling distinguish T cells infiltrating follicular lymphoma tumors from peripheral T cells. Blood. 2013;121(8):1367–1376. doi:10.1182/blood-2012-04-421826.
- Carreras J, Lopez-Guillermo A, Roncador G, Villamor N, Colomo L, Martinez A, Hamoudi R, Howat WJ, Montserrat E, Campo E. High numbers of tumor-infiltrating programmed cell death 1-positive regulatory lymphocytes are associated with improved overall survival in follicular lymphoma. J Clin Oncol. 2009;27(9):1470–1476. doi:10.1200/JCO.2008.18.0513.
- Xu-Monette ZY, Zhou J, Young KH. PD-1 expression and clinical PD-1 blockade in B-cell lymphomas. Blood. 2018;131(1):68–83. doi:10.1182/blood-2017-07-740993.
- Capietto AH, Martinet L, Fournié JJ. How tumors might withstand γδ T cell attack. Cell Mol Life Sci. 2011;68(14):2433–2442. doi:10.1007/s00018-010-0573-6.
- Capietto AH, Martinet L, Fournie JJ. Stimulated gammadelta T cells increase the in vivo efficacy of trastuzumab in HER-2+ breast cancer. J Immunol. 2011;187(2):1031–1038. doi:10.4049/jimmunol.1100681.
- Fournié JJ, Sicard H, Poupot M, Bezombes C, Blanc A, Romagné F, Ysebaert L, Laurent G. What lessons can be learned from γδ T cell-based cancer immunotherapy trials? Cell Mol Immunol. 2013;10(1):35–41. doi:10.1038/cmi.2012.39.
- Meraviglia S, Lo Presti E, Dieli F, Stassi G. γδ T cell-based anticancer immunotherapy: progress and possibilities. Immunotherapy. 2015;7(9):949–951. doi:10.2217/imt.15.68.
- Silva-Santos B, Serre K, Norell H. γδ T cells in cancer. Nat Rev Immunol. 2015;15(11):683–691. doi:10.1038/nri3904.
- Gertner-Dardenne J, Bonnafous C, Bezombes C, Capietto AH, Scaglione V, Ingoure S, Cendron D, Gross E, Lepage JF, Quillet-Mary A, et al. Bromohydrin pyrophosphate enhances antibody-dependent cell-mediated cytotoxicity induced by therapeutic antibodies. Blood.2009;113(20):4875–4884. doi:10.1182/blood-2008-03-146472.
- Sicard H, Al Saati T, Delsol G, Fournié JJ. Synthetic phosphoantigens enhance human Vgamma9Vdelta2 T lymphocytes killing of non-Hodgkin’s B lymphoma. Mol Med. 2001;7(10):711–722.
- Rossi J-F, Solal-Celigny P, Soubeyran P. Phase I/II study IPH101, gamma delta T cell agonist, in combination with rituximab re-treatment in patients with low grade follicular lymphoma. EHA Meeting; 2010. Abstract 1101.
- Musso A, Catellani S, Canevali P, Tavella S, Venè R, Boero S, Pierri I, Gobbi M, Kunkl A, Ravetti JL, et al. Aminobisphosphonates prevent the inhibitory effects exerted by lymph node stromal cells on anti-tumor Vδ 2 T lymphocytes in non-Hodgkin lymphomas. Haematol.2014;99(1):131–139. doi:10.3324/haematol.2013.097311.
- Braza MS, Klein B, Fiol G, Rossi JF. γδ T-cell killing of primary follicular lymphoma cells is dramatically potentiated by GA101, a type II glycoengineered anti-CD20 monoclonal antibody. Haematologica. 2011;96(3):400–407. doi:10.3324/haematol.2010.029520.
- Iwasaki M, Tanaka Y, Kobayashi H, Murata-Hirai K, Miyabe H, Sugie T, Toi M, Minato N. Expression and function of PD-1 in human γδ T cells that recognize phosphoantigens. Eur J Immunol. 2011;41(2):345–355. doi:10.1002/eji.201040959.
- Decaup E, Jean C, Laurent C, Gravelle P, Fruchon S, Capilla F, Al Saati T, Frenois FX, Laurent G, Klein C, et al. Anti-tumor activity of obinutuzumab and rituximab in a follicular lymphoma 3D model. Blood Cancer J. 2013;3:e131. doi:10.1038/bcj.2013.32.
- Gravelle P, Jean C, Valleron W, Laurent G, Fournié JJ. Innate predisposition to immune escape in follicular lymphoma cells. Oncoimmunol. 2012;1(4):555–556. doi:10.4161/onci.19365.
- Gravelle P, Jean C, Familiades J, Decaup E, Blanc A, Bezombes-Cagnac C, Laurent C, Savina A, Fournié JJ, Laurent G. Cell growth in aggregates determines gene expression, proliferation, survival, chemoresistance, and sensitivity to immune effectors in follicular lymphoma. Am J Pathol. 2014;184(1):282–295. doi:10.1016/j.ajpath.2013.09.018.
- Mössner E, Brünker P, Moser S, Püntener U, Schmidt C, Herter S, Grau R, Gerdes C, Nopora A, van Puijenbroek E, et al. Increasing the efficacy of CD20 antibody therapy through the engineering of a new type II anti-CD20 antibody with enhanced direct and immune effector cell-mediated B-cell cytotoxicity. Blood.2010;115(22):4393–4402. doi:10.1182/blood-2009-06-225979.
- Guo S, Chan JKC, Iqbal J, McKeithan T, Fu K, Meng B, Pan Y, Cheuk W, Luo D, Wang R, et al. EZH2 mutations in follicular lymphoma from different ethnic groups and associated gene expression alterations. Clin Cancer Res.2014;20(12):3078–3086. doi:10.1158/1078-0432.CCR-13-3045.
- Green MR, Gentles AJ, Nair RV, Irish JM, Kihira S, Liu CL, Kela I, Hopmans ES, Myklebust JH, Ji H, et al. Hierarchy in somatic mutations arising during genomic evolution and progression of follicular lymphoma. Blood.2013;121(9):1604–1611. doi:10.1182/blood-2012-09-457283.
- Gentles AJ, Newman AM, Liu CL, Bratman SV, Feng W, Kim D, Nair VS, Xu Y, Khuong A, Hoang CD, et al. The prognostic landscape of genes and infiltrating immune cells across human cancers. Nat Med.2015;21(8):938–945. doi:10.1038/nm.3909.
- Tosolini M, Pont F, Poupot M, Vergez F, Nicolau-Travers ML, Vermijlen D, Sarry JE, Dieli F, Fournié JJ. Assessment of tumor-infiltrating TCRVγ9Vδ2 γδ lymphocyte abundance by deconvolution of human cancers microarrays. Oncoimmunology. 2017;6(3):e1284723. doi:10.1080/2162402X.2017.1284723.
- Poccia F, Cipriani B, Vendetti S, Colizzi V, Poquet Y, Battistini L, López-Botet M, Fournié JJ, Gougeon ML. CD94/NKG2 inhibitory receptor complex modulates both anti-viral and anti-tumoral responses of polyclonal phosphoantigen-reactive V gamma 9V delta 2 T lymphocytes. J Immunol. 1997;159(12):6009–6017.
- Poupot M, Pont F, Fournié JJ. Profiling blood lymphocyte interactions with cancer cells uncovers the innate reactivity of human gamma delta T cells to anaplastic large cell lymphoma. J Immunol. 2005;174(3):1717–1722.
- Gertner J, Wiedemann A, Poupot M, Fournié JJ. Human gammadelta T lymphocytes strip and kill tumor cells simultaneously. Immunol Lett. 2007;110(1):42–53. doi:10.1016/j.imlet.2007.03.002.
- Pardoll DM. The blockade of immune checkpoints in cancer immunotherapy. Nat Rev Cancer. 2012;12(4):252–264. doi:10.1038/nrc3239.
- Purwada A, Singh A. Immuno-engineered organoids for regulating the kinetics of B-cell development and antibody production. Nat Protoc. 2017;12(1):168–182. doi:10.1038/nprot.2016.157.
- Mannino RG, Santiago-Miranda AN, Pradhan P, Qiu Y, Mejias JC, Neelapu SS, Roy K, Lam WA. 3D microvascular model recapitulates the diffuse large B-cell lymphoma tumor microenvironment in vitro. Lab Chip. 2017;17(3):407–414. doi:10.1039/c6lc01204c.
- Amé-Thomas P, Tarte K. The yin and the yang of follicular lymphoma cell niches: role of microenvironment heterogeneity and plasticity. Semin Cancer Biol. 2014;24:23–32. doi:10.1016/j.semcancer.2013.08.001.
- Huang Y, Chen Z, Jang JH, Baig MS, Bertolet G, Schroeder C, Huang S, Hu Q, Zhao Y, Lewis DE, et al. PD-1 blocks lytic granule polarization with concomitant impairment of integrin outside-in signaling in the natural killer cell immunological synapse. J Allergy Clin Immunol. 2018;142(4):1311–1321. doi:10.1016/j.jaci.2018.02.050.
- Daydé D, Ternant D, Ohresser M, Lerondel S, Pesnel S, Watier H, Le Pape A, Bardos P, Paintaud G, Cartron G. Tumor burden influences exposure and response to rituximab: pharmacokinetic-pharmacodynamic modeling using a syngeneic bioluminescent murine model expressing human CD20. Blood. 2009;113(16):3765–3772. doi:10.1182/blood-2008-08-175125.
- Lesokhin AM, Ansell SM, Armand P, Scott EC, Halwani A, Gutierrez M, Millenson MM, Cohen AD, Schuster SJ, Lebovic D, et al. Nivolumab in patients with relapsed or refractory hematologic malignancy: preliminary results of a phase Ib study. J Clin Oncol.2016;34(23):2698–2704. doi:10.1200/JCO.2015.65.9789.
- Westin JR, Chu F, Zhang M, Fayad LE, Kwak LW, Fowler N, Romaguera J, Hagemeister F, Fanale M, Samaniego F, et al. Safety and activity of PD-1 blockade by pidilizumab in combination with rituximab in patients with relapsed follicular lymphoma: a single group, open-label, phase 2 trial. Lancet Oncol.2014;15(1):69–77. doi:10.1016/S1470-2045(13)70510-2.
- Nastoupil LJ, Westin JR, Fowler NH, Fanale MA, Samaniego F, Oki Y, Obi C, Cheng JX, Ma MCJ, Wang Z, et al. High response rates with pembrolizumab in combination with rituximab in patients with relapsed follicular lymphoma: interim results of an on open-label, phase II study. Hematol Oncol. 35(S2):120–121. doi:10.1002/hon.2437_108.
- Swerdlow SH, Campo E, Pileri SA, Harris NL, Stein H, Siebert R, Advani R, Ghielmini M, Salles GA, Zelenetz AD, et al. The 2016 revision of the World Health Organization classification of lymphoid neoplasms. Blood.2016;127(20):2375–2390. doi:10.1182/blood-2016-01-643569.
- Buades A, Coll B, Morel JM. A non-local algorithm for image denoising. IEEE. 2005;2:60–65.
- Edgar R, Domrachev M, Lash AE. Gene expression omnibus: NCBI gene expression and hybridization array data repository. Nucleic Acids Res. 2002;30(1):207–210. doi:10.1093/nar/30.1.207.
- Brodtkorb M, Lingjærde OC, Huse K, Trøen G, Hystad M, Hilden VI, Myklebust JH, Leich E, Rosenwald A, Delabie J, et al. Whole-genome integrative analysis reveals expression signatures predicting transformation in follicular lymphoma. Blood. 2014;123(7):1051–1054. doi:10.1182/blood-2013-07-512392.
- Newman AM, Liu CL, Green MR, Gentles AJ, Feng W, Xu Y, Hoang CD, Diehn M, Alizadeh AA. Robust enumeration of cell subsets from tissue expression profiles. Nat Methods. 2015;12(5):453–457. doi:10.1038/nmeth.3337.
- Watkins AJ, Hamoudi RA, Zeng N, Yan Q, Huang Y, Liu H, Zhang J, Braggio E, Fonseca R, de Leval L, et al. An integrated genomic and expression analysis of 7q deletion in splenic marginal zone lymphoma. PLoS One. 2012;7(9):e44997. doi:10.1371/journal.pone.0044997.