
ABSTRACT
Dendritic cells (DCs) initiate adaptive immune responses after their migration to secondary lymphoid organs. The LXR ligands/oxysterols and the RXR ligand 9-cis Retinoic Acid (9-cis RA) were shown to dampen DC migration to lymphoid organs through the inhibition of CCR7 expression. We performed transcriptomics of DCs undergoing maturation in the presence of the LXR ligand 22R-Hydroxycholesterol (22R-HC). The analysis highlighted more than 1500 genes modulated by 22R-HC treatment, including the triggering receptor expressed on myeloid cells (TREM)-1, which was found markedly up-regulated. We tested the effect of other nuclear receptor ligands (NRL) and we reported the induction of TREM-1 following RXR, RAR and VDR activation. From a functional point of view, triggering of TREM-1 induced by retinoids increased TNFα and IL-1β release, suggesting an active role of NRL-activated TREM-1+ DCs in inflammation-driven diseases, including cancer. Consistently with this hypothesis we detected DCs expressing TREM-1 in pleural effusions and ascites of cancer patients, an observation validated by the induction of TREM-1, LXR and RAR target genes when monocyte-DCs were activated in the presence of tumor-conditioned fluids. Finally, we observed a better control of LLC tumor growth in Trem-1−/- bone marrow chimera mice as compared to wild type chimera mice. Future studies will be necessary to shed light on the mechanism of TREM-1 induction by distinct NRL, and to characterize the role of TREM-1+ DCs in tumor growth.
Introduction
Dendritic cells (DCs) are a group of professional antigen presenting cells involved in both innate and adaptive immunity.Citation1 DCs capture antigens in inflamed tissues and after migration to the secondary lymphoid organs present them to naïve T cells eliciting the adaptive immune response.Citation2 Both cytokines and the local microenvironment contribute to educate DCs to become inflammatory or regulatory.Citation3 Indeed, under pro-inflammatory conditions DCs promote an effective immune response, while in a tolerogenic environment DCs acquire regulatory functions suppressing T cell activation and proliferation.Citation4
Liver X receptors (LXRs) and their ligands, i.e. oxysterols, are emerging as new players of many inflammatory diseases, due to their pleiotropic effects.Citation5 The two LXR isoforms share a similar amino acidic sequence, but differ in tissue distribution, with LXRα primarily expressed in liver, kidney, intestine, adipose tissue and macrophages, and LXRβ being expressed ubiquitously.Citation6 Our group has recently demonstrated that tumor-derived oxysterols promote tumor growth through LXRα-dependent and -independent mechanisms.Citation7
Triggering receptor expressed on myeloid cells (TREM) cluster genes code for a family of proteins (TREM-1, −2, −3), broadly expressed on the surface of myeloid cells.Citation8 TREM-1 is a member of the Ig superfamily of immunoreceptors and it is a strong amplifier of the immune responses.Citation8 TREM-1 is constitutively expressed by neutrophils and monocytes,Citation9 where it is up-regulated by LPS exposure and acts synergistically with receptors for pathogens-associated molecular patterns.Citation10 Indeed, TREM-1 activation induces an amplification of the immune response with strong increase of TNFα, IL-1β, IL-8 and CCL2 release. In vivo studies, in the context of septic shock, have demonstrated that a soluble form of TREM-1 could work as a decoy receptor, thus reducing circulating inflammatory cytokines and improving mice survival.Citation11 Moreover, recent evidence has linked TREM-1 to several non-infectious acute and chronic inflammatory diseases, including inflammatory bowel diseases, rheumatoid arthritis, psoriasis, atherosclerosis and cancer.Citation12-Citation14 Noteworthy, in non-small cell lung cancer (NSCLC) patients the expression of TREM-1 by tumor-associated macrophages and the increase of the soluble TREM-1 in pleural effusions have been associated with tumor relapse and poor survival.Citation15
Recently, it has been demonstrated that TREM-1 is induced in dendritic cells undergoing hypoxia.Citation16 TREM-1+ DCs were indeed found in inflamed joints of children affected by juvenile idiopathic arthritis.Citation16 The identification of TREM-1 ligands remains controversial and represents an important issue. Different proteins have been proposed as TREM-1 ligands, such as HMGB-1, PGLYRP1, and Hsp-70.Citation17,Citation18 Furthermore, there is consensus on the role played by several damage-associated molecular patterns as putative TREM-1 ligands.Citation18
Here, we report on the identification of TREM-1 as a new target of different nuclear receptors, i.e. LXRs, RXRs, RARs and VDR. By transcriptomic studies we show TREM-1 expression on maturing DCs treated with the oxysterol 22R-Hydroxycholesterol (22R-HC). Moreover, we demonstrate that retinoids (RXR and RAR ligands) strongly induce TREM-1 expression, which once triggered by anti-TREM-1 mAb, induces the release of high amounts of the pro-inflammatory cytokines IL-1β and TNFα by myeloid DCs. We also provide evidence that TREM-1 is expressed on a subset of so-called inflammatory DCs, ex vivo isolated from pleural and peritoneal fluids of advanced cancer patients. These results pave the way to the elucidation of this pathway in inflammation and inflammation-driven diseases.
Results
Gene expression profile of LXR ligand-treated dendritic cells and characterization of 22R-HC immune-related genes
Human dendritic cells (DCs) were generated from circulating monocytes obtained from healthy donors in the presence of GM-CSF/IL-4 for 5 days and treated with 22R-hydroxycholesterol (22R-HC) (5 μM) and LPS (100 ng/ml) for 24 hours.
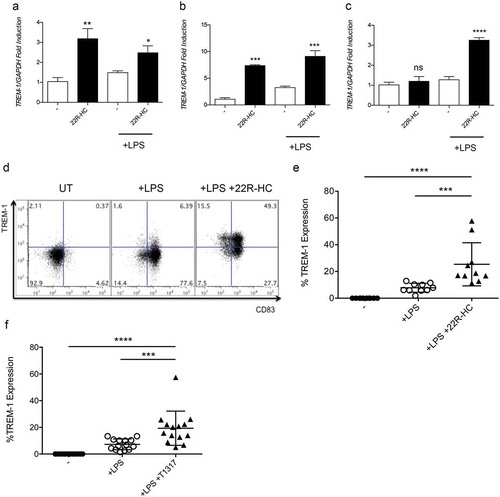
The transcriptional profile of LXR ligand-treated DCs was then assessed by Gene ChipR microarray analysis. Pairwise comparison between datasets from untreated and 22R-HC-treated samples revealed a differential modulation of many transcripts. We found 1517 unique genes modulated, 786 upregulated and 731 downregulated genes, considering an absolute fold change of 1.5 and FDR < 0.05 (, and Supplementary Table 1). Gene ontology Biological process (BP) enrichment analysis showed that many up-regulated genes were associated to cardiovascular system development pathways () while downregulated genes were enriched in lipid metabolism pathways (). Ingenuity® Pathway Analysis (IPA®) revealed a significant modulation of the following Top canonical pathways: Biosynthesis of Steroids (p = 1.5E-07); LXR/RXR Activation (p = 2.54E-07); Role of IL-17F in Allergic Inflammatory Airway Diseases (p = 2.9E-06); Atherosclerosis Signaling (p = 5.62E-06) and TREM1 Signaling (p = 1.61E-04). Among the pathways modulated by the 22R-HC, the TREM-1 signaling pathway displayed a differential expression between DCs treated with LPS and DCs treated with LPS plus 22R-HC (p = 1.61E-04). TREM-1 is expressed by circulating neutrophils, monocytes, tissue macrophagesCitation9 and by DCs under hypoxic conditions.Citation16 We investigated the functional regulation of the expression of TREM-1 in 22R-HC-treated DCs. We evaluated TREM-1 mRNA expression at different time points (6, 16 and 24 h) in monocyte-derived DCs obtained from different donors and treated with 22R-HC alone (immature DCs) or 22R-HC plus LPS (maturing DCs). Immature DCs, treated with the LXR agonist alone, showed TREM-1 mRNA induction only at 6 and 16 hours (), whereas the combination treatment, i.e. 22R-HC + LPS, induced TREM-1 also after 24 hours of treatment (). However, only the combination treatment resulted in the up regulation of TREM-1 protein on the surface of DCs ( and data not shown). The expression of TREM-1 protein was also observed when DCs were treated with LPS and the synthetic LXR agonist T0901317 for 24 hours (hereafter referred to as T1317; ).
Figure 1. Microarray analysis of monocyte-derived DCs activated with LPS in the presence or in the absence of 22R-Hydroxycholesterol. (a-b) Pairwise comparison between datasets from untreated and 22R-HC-treated samples revealing a differential modulation of 1517 unique genes (in supplementary Table 1). (a) 786 genes resulted to be upregulated, and (b) 731 downregulated, considering an absolute fold change of 1.5 and FDR H&B < 0.05 (c-d) Gene Ontology Biological Process (BP) enrichment analysis showing up-regulated (c) and down-modulated (d) pathways.
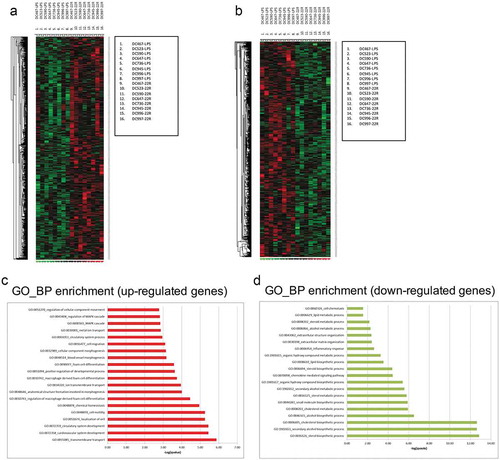
Figure 2. Kinetics of TREM-1 expression by DCs treated with LXR ligands. (a-c) Analysis of TREM-1 mRNA expression by immature and mature monocyte-derived DCs treated with 22R-HC for 6 (a), 16 (b) and 24 (c) hours. Results are representative of three experiments. *, P < 0.05; **, P < 0.01; ***, P < 0.001; ****, P < 0.0001; ns, not significant (Student’s t test). (d) A representative FACS analysis of TREM-1 expression by untreated, LPS-treated and LPS plus 22R-HC-treated DCs is shown. (e) Quantification of the flow cytometry analysis as in (d). Each symbol corresponds to one DC donor tested, and the line represents the mean value. ***, P < 0.001; ****, P < 0.0001 (analysis of variance ANOVA). (f) Quantification of FACS analysis of DCs treated for 24 hours with LPS and the synthetic LXR agonist T0901317 (T1317). Each symbol corresponds to one DC donor tested, and the line represents the mean value. ***, P < 0.001; ****, P < 0.0001 (analysis of variance ANOVA). In figures D and E, DCs were treated with LPS and LPS plus 22R-HC for 24 hours.
TREM-1 is induced by distinct nuclear receptor ligands
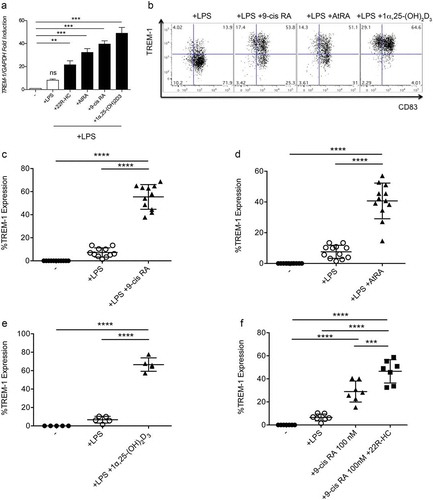
1α,25dihydroxyvitamin D3 has been reported to induce the expression of TREM-1 in U937 cell line, in peripheral blood monocytes and in synovial macrophages isolated from patients affected by rheumatoid arthritis (RA).Citation19 Given that the expression of some proteins (i.e. CD38 and sPLA2) can be induced by multiple nuclear receptor ligands,Citation20 we wondered whether VDR ligands and other nuclear receptor ligands could induce TREM-1 in DCs. To assess this hypothesis, we tested the effects of ligands of VDR, RAR, RXR, PPARγ and FXRCitation21 on maturing DCs. As shown in , 1α,25dihydroxyvitamin D3, and different retinoids (AtRA and 9-Cis Retinoic Acid), all used at a final concentration of 1 μM, induced a strong upregulation of TREM-1 mRNA (), while PPARγ and FXR ligands did not (data not shown). We confirmed the effects of VDR, RXR and RAR ligands also at protein levels (). Of note, the combination of 9-cis RA tested at 100 nM and 22R-HC at 5 μM triggered a stronger TREM-1 expression, as compared to the individual compounds (), indicating a synergistic effect possibly related to the engagement of the heterodimers LXR/RXR. Importantly, we also detected TREM-1 expression when DCs were activated for 24 hours with the TLR3 ligand poly I:C (20 μg/ml) in the presence of 9-cis RA (100 nM), given alone, or combined with 22R-HC (5 μM) (Supplementary Figure 1).
Figure 3. Expression of TREM-1 by DCs treated with RXR, RAR or VDR ligands. (a) Analysis of TREM-1 mRNA expression by monocyte-derived DCs treated with LPS plus 22R-HC, or AtRA, or 9-cis RA or 1α,25dihydroxyvitamin D3 for 24 hours. (b) A representative FACS analysis showing TREM-1 expression by DCs treated with LPS, LPS plus 9-cis RA, or AtRA or 1α,25dihydroxyvitamin D3. (c) Quantification of FACS analysis as in (b). (d) Quantification of FACS analysis as in (b). (e) Quantification of FACS analysis as in (b). Each symbol corresponds to one DC donor tested, and the line represents the mean value. ****, P < 0.0001 (analysis of variance ANOVA). (f) Quantification of FACS analysis of DCs treated with LPS, LPS plus 9-cis RA (100 nM), and LPS plus 9-cis RA (100 nM) and 22R-HC (5 μM). Each symbol corresponds to one DC donor tested, and the line represents the mean value. ***, P < 0.001; ****, P < 0.0001 (analysis of variance ANOVA).
TREM-1 promoter contains LXR and RAR responsive elements
To characterize the mechanisms involved in the upregulation of TREM-1 induced by oxysterols and retinoids we performed in silico analysis of the TREM-1 promoter and found different putative nuclear receptor responsive elements in the untranslated region between −345 and +1 bp (). Therefore, we planned ChIP assay experiments to determine the relative enrichment of LXR and RAR to the TREM-1 promoter by taking advantage of the U937 cell line, as very high numbers of DCs restrained their use in these experiments. The treatment of PMA-differentiated U937 with T1317 or AtRA induced TREM-1 mRNA upregulation (). These results were confirmed also at protein level by flow cytometry analysis (data not shown). ChIP assay with a specific anti-LXRα mAb was carried out on PMA-activated U937 cells treated for 6 hours with 1 μM of T1317. By qPCR we detected the recruitment of LXR to the LXR target gene promoter SREBP-1c used as control (), and importantly to a putative TREM-1 promoter site (). Similar experiments using an anti-RAR specific antibodyCitation22 showed the relative enrichment of RAR to the RAR target gene ALDHA1 and TREM-1 promoters in U937 cells treated for 6 hours with 1 μM of AtRA (Supplementary Figure 2A and B). Altogether, these results identify TREM-1 as a target gene of LXR and RAR nuclear receptors in U937 cells. Since PMA-activated U937 treated with LXR and RAR ligands expressed TREM-1 similarly to DCs treated with LXR and RAR ligands, we speculate that TREM-1 may be a target of LXR and RAR nuclear receptors also in DCs. However, an effort should be made in near future to definitely prove it.
Figure 4. Chromatin Immunoprecipation assays. (a) In silico analysis of the TREM-1 promoter showing different putative LXRE and RARE responsive elements in the untranslated region between −345 and +1 bp. (b) qPCR experiments showing TREM-1 mRNA expression by U937 differentiated with PMA for 72h and then treated with T1317 or AtRA. Results are representative of three experiments. *, P = 0.021; ***, P < 0.001 (analysis of variance ANOVA). (c-d) The selective fold enrichments of the LXRE responsive elements in the SREBP-1c promoter used as control (c) and in the putative TREM-1 promoter site (d), are shown. U937 cells were treated as described in (b). UT: Untreated. Results are representative of two experiments. *, P = 0.012; **, P = 0.0074 (Student’s t test).
Circulating myeloid DCs express TREM-1 following the treatment with nuclear receptor ligands and release pro-inflammatory cytokines after TREM-1 triggering
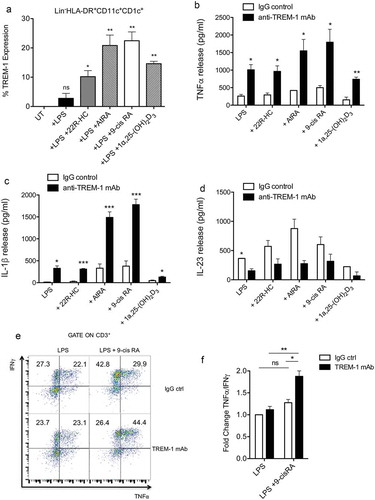
To investigate whether also circulating myeloid DCs could up regulate TREM-1 expression, we isolated and cultured myeloid DCs isolated from healthy donors with LPS and distinct nuclear receptor ligands. Myeloid DCs treated with LPS in combination with distinct nuclear receptor ligands expressed TREM-1, such as monocyte-derived DCs (). TREM-1 is an amplifier of inflammation and it is known to induce the release of pro-inflammatory cytokines, such as TNFα and IL-1β.Citation9 To determine whether nuclear receptor ligand-induced TREM-1 receptor was fully functional, myeloid DCs treated with LPS and various ligands (22R-HC, AtRA, 9-cis RA and 1α,25dihydroxyvitamin D3) were plated on a plastic surface coated with an agonist TREM-1 mAb or control IgG for 24 h. Collected supernatants were then assayed for TNFα, IL-1β and IL23 by ELISA assays. We observed a significant increase of TNFα and IL-1β release when DCs were treated concomitantly with LPS plus AtRA or 9-cisRA and triggered by anti-TREM-1 mAb (). These cytokines were released in similar amounts by DCs treated with LPS or LPS plus 22R-HC or 1α,25dihydroxyvitamin D3 (). Moreover, TREM-1 triggering decreased IL-23 production in all the experimental conditions tested, though statistically significant decrease was obtained only when DCs were treated with LPS alone (). These results indicate that although distinct nuclear receptors induce the up-regulation of TREM-1 on LPS-treated DCs, only those activated by retinoids (9-cis RA and AtRA) enhance the release of pro-inflammatory cytokines over LPS stimulation. In agreement with these results, we observed an increased Th1 polarization (IFNγ+ and TNFα+ cells) by intra-cytokine staining when allogeneic naïve CD4+ T cells were stimulated for 6 days with DCs treated with 9-cis RA and triggered by anti-TREM-1 mAb (). We also performed experiments to evaluate whether DCs activated by anti-TREM-1 mAb and supernatants from these DCs were able to regulate T cell proliferation and T cell migration, respectively (Supplementary Figure 3A and B). Monocyte-derived DCs were treated with 9-cis RA and triggered by anti-TREM-1 mAb or control IgG. Twenty-four hours later, supernatants were collected to perform migration assays, whereas DCs were used to stimulate CFSE-labelled allogeneic T cells isolated from healthy donors. FACS analysis performed 6 days after the co-culture did not show any difference between the two conditions in terms of T cell proliferation (Supplementary Figure 3A). Moreover, conditioned supernatants were equally effective to induce migration of T cells isolated from healthy donors (Supplementary Figure 3B).
Figure 5. Expression and function of TREM-on myeloid DCs isolated from the blood of donors. (a) Quantification by FACS of TREM-1 expression by myeloid DCs treated with LPS, LPS plus 22R-HC, LPS plus AtRA, LPS plus 9-cis RA, and LPS plus 1α,25dihydroxyvitamin D3. Results are representative of three experiments. *, P < 0.05; **, P < 0.01; ns, not significant (analysis of variance ANOVA). (b-c) TNFα (b) and IL-1β (c) release by myeloid DCs treated with LPS plus nuclear receptor ligands as described in (a) and triggered for 24h by anti-TREM-1 mAb or IgG ctrl. Results are representative of 3–4 experiments. *, P < 0.05; **, P < 0.01; ***, P < 0.001 (analysis of variance ANOVA). (d) IL-23 release by myeloid DCs treated with LPS plus nuclear receptor ligands as described in (a) and triggered for 24h by anti-TREM-1 mAb or IgG ctrl. Results are representative of 2 experiments. *, P < 0.05 (analysis of variance ANOVA). (e) FACS analysis showing TNFα+ and IFNγ+ cytokine staining of allogeneic naïve CD4+ T cells stimulated for 6 days with DCs treated with 9-cis RA and triggered by anti-TREM-1 mAb or IgG ctrl. (f) Fold change of TNFα+/IFNγ+ CD4+ T cells co-cultured with DCs stimulated with LPS plus 9-cis RA over TNFα+/IFNγ+ CD4+ T cells co-cultured with DCs stimulated with LPS alone. Results are representative of 2 experiments. *, P < 0.05; **, P < 0.01; ns, not significant (analysis of variance ANOVA).
Inflammatory DCs isolated from neoplastic fluids express TREM-1
TREM-1 is involved in the pathogenesis of many inflammatory diseases, such as inflammatory bowel diseases, rheumatoid arthritis and cancer.Citation12-Citation14 Based on this, we investigated the relationship between nuclear receptor ligands and TREM-1 up-regulation in pathologic conditions where inflammation plays a role. Soluble TREM-1 molecules and tumor-associated macrophages expressing TREM-1 have been associated to poor prognosis in lung cancer patients.Citation15 We thus wondered whether DCs present in pleural effusions and ascites from patients affected by tumors of different histology and ovarian cancer, respectively, expressed TREM-1 receptors. In particular, we asked whether TREM-1 was expressed by monocyte-derived inflammatory DCs recently characterized in tumor and inflammatory-associated diseases.Citation23 This population is characterized by the expression of HLA-DR and CD11c markers and turns out to be CD1c+ and CD16− (i.e. CD11b+HLA-DR+CD11c+CD1c+ and CD16−).Citation23 We sorted the CD11b+ mononuclear cells from pleural effusions and ascites, and found that the inflammatory DCs were about 6–10% among the CD11c+HLA-DR+ cells (). We detected a variable percentage of CD1c+CD16−TREM-1+ DCs in fluids of cancer patients ( and ). This subset was absent or significantly low in the blood of healthy donors ( and ). TREM-1 was also expressed by CD1c+CD16+ cells both in the blood of healthy donors and tumor fluids (; histograms).
Table 1. Percentage of TREM-1+ DCs in fluids from cancer patients.
Table 2. Percentage of TREM-1+ DCs in the blood of healthy donors.
Figure 6. Expression of TREM-1 by DCs isolated from neoplastic fluids of advanced cancer patients. (a-b) Analysis of TREM-1 expression by CD11b+ cells purified from neoplastic fluids (a, pleural effusion; b, ascites) and further analyzed by FACS for HLA-DR, CD11c, CD1c, CD16 and TREM-1. TREM-1 was expressed by a subset of CD1c+CD16+ cells present in neoplastic fluids and blood of healthy donors (a, upper panel), and by HLA-DR+CD11c+CD1c+CD16− DCs, which were almost exclusively present in neoplastic fluids. (c) Whisker plot analysis showing the percentage of HLA-DR+CD11c+CD1c+CD16− DCs expressing TREM-1 in the fluids of 9 advanced cancer patients and in the blood of 9 healthy donors. *, P = 0.013 (Wilcoxon matched-pairs signed rank test). (d-e) Linear regression analyses between TREM-1 expression and ABCA1 (d) or TGM-2 expression (e).
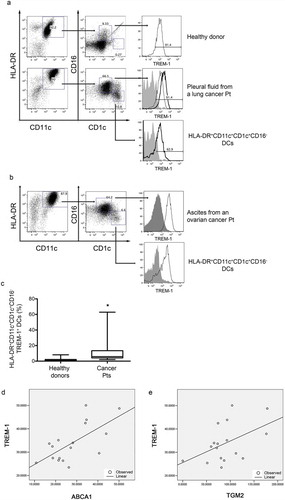
To evaluate the presence of oxysterols and/or retinoids in pleural effusions we incubated pleural effusions from patients with tumors of different histology (Supplementary Table 2) with in vitro differentiated monocyte-derived DCs and measured the induction of LXR (ABCA1) and RAR (TGM2) target genes as well as the up regulation of TREM-1. Eighteen out of 19 pleural effusions induced the expression of ABCA1, TGM2 as well as TREM-1 in monocyte-derived DCs (Supplementary Figure 4A, B and C). Moreover, the expression of TREM-1 positively correlated with the induction of LXR and RAR target genes in linear regression analyses ( and E; R2 = 0.44 and p-value = 0.004 for ABCA1 vs TREM-1; R2 = 0.23 and p-value = 0.050 for TGM2 vs TREM-1).
By interrogating the PROGgeneV2 prognostic database, we evaluated whether the expression of TREM1 alone or combined to ITGAX (CD11c) impacted on overall survival or relapse free survivalCitation24 of NSCLC and ovarian cancer patients. We observed only a trend between high expressors and reduced overall survival in both tumors (data not shown). Instead, a significant reduced RFS correlated with tumors with a high expression of TREM1 alone or combined to ITGAX (Supplementary Figure 5A, B, C and D). Therefore, suggesting a worst prognosis of tumors infiltrated by high levels of TREM1+ and CD11c+ cells.
TREM-1+ hematopoietic-derived immune cells favor experimental lung tumor progression
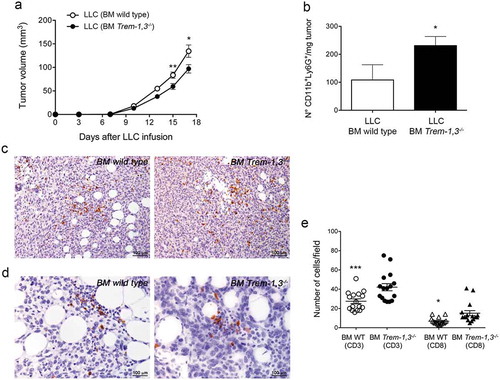
To establish the role of TREM-1+ immune cells in tumor progression, we generated wild type and Trem-1,3−/- bone marrow chimera mice. Two months after bone marrow transplants, chimera mice were challenged with the mouse lung carcinoma LLC, which we have previously shown to release oxysterols.Citation25,Citation26 We observed a delayed LLC tumor growth in Trem-1,3−/- bone marrow chimera mice (). We also observed a reduced number of CD11b+Ly6G+ neutrophils in tumors collected from Trem-1,3−/- as compared to wild type bone marrow chimera mice (). The number of CD11b+CD11c+ cells was instead similar in tumors collected from both mice (wild type and Trem-1,3−/- bone marrow chimera) (data not shown), whereas, as expected, we detected only a few TREM-1+ cells among the CD45+ cells infiltrating the tumors grown in Trem-1,3−/- bone marrow chimera mice (data not shown), possibly due to residual wild type bone marrow precursors. Additionally, by immunohistochemistry we detected a higher number of CD3+ and CD8+ T lymphocytes in LLC tumors grown in Trem-1,3−/- bone marrow chimera mice (). It has been recently reported that mice lacking TGFβR1-mediated signaling have a defect in CD103+CD11b+TREM-1+ DCs in the intestine, which hampers the generation of antigen-specific inducible FoxP3+ regulatory T cells.Citation27 In our experiments the absence of TREM-1+ DCs might explain the increase of CD3+ and CD8+ T lymphocytes in LLC tumors grown in Trem-1,3−/- bone marrow chimera mice (), possibly related to the reduction of FoxP3+ regulatory T cells. This hypothesis needs to be carefully evaluated in appropriate models.
Figure 7. LLC tumor growth in wild type (WT) and Trem-1,3−/- bone marrow chimera mice. (a) Growth of LLC in WT and Trem-1,3−/- chimera mice (n = 12–14 mice per group; mean ± SEM). **, P = 0.0073; *, P = 0.022 (Student’s t test). (b) Number of CD11b+Ly6G+ neutrophils infiltrating LLC injected in WT or in Trem-1,3−/- chimera mice (n = 5 mice per group; mean ± SEM). *, P = 0.04 (Student’s t test). (c) Immunohistochemistry for CD3+ cells infiltrating LLC tumors grown in WT (left) and Trem-1,3−/- (right) chimera mice. Original magnification 200x; bar, 100 μm. (d) Immunohistochemistry for CD8+ cells infiltrating LLC tumors grown in WT (left) and Trem-1,3−/- (right) chimera mice. Original magnification 400x; bar, 100 μm. (e) Quantification of the results shown in C and D. The amount of immunoreactive CD3+ and CD8+ cells was calculated as the number of positive cells in tumor areas at 400x magnification in 16 high-power fields enriched of T lymphocytes. *, P < 0.05; ***, P < 0.001 (analysis of variance ANOVA).
These results suggest that the expression of TREM-1 by tumor infiltrating immune cells favors tumor growth and are in accordance with clinical data showing TREM-1+ DCs in pleural fluids and ascites of cancer patients with advanced disease and bad prognosis ( and Supplementary Table 2).
Discussion
Here, we characterized the transcriptional profile of monocyte-derived DCs treated with the oxysterol 22R-HC and LPS. Besides the expected down-modulation of inflammatory response genes, we also detected the induction of TREM-1, which is a strong amplifier of immune responses.
TREM-1 is expressed by monocytes, neutrophils and tissue macrophages, where it is upregulated by Toll-like receptor ligands and pro-inflammatory cytokines.Citation9 Its expression is relevant for the amplification of the immune responses during infections.Citation9 Indeed, TREM-1 triggering increases the release of TNFα, IL-1β, IL-6, IL-8 and CCL2, thus fueling the inflammatory circuitry leading to the clearance of pathogens.Citation11 It is also known that TREM-1 is down-regulated during DC differentiation from monocytes.Citation9 Until now only hypoxia has been reported to up-regulate TREM-1 expression in monocyte-derived DCs, an observation confirmed by the analysis of DCs present in synovial fluids of patients affected by juvenile idiopathic arthritis.Citation16 Here, we demonstrated that the engagement of different nuclear receptors induced the expression of TREM-1 on maturing DCs. LXR/oxysterols, RAR/RXR/retinoic acids and VDR/1α,25dihydroxyvitamin D3Citation21 induced a strong up-regulation of TREM-1 both at mRNA and protein levels. Of note, neutrophils and monocytes failed to further up-regulate TREM-1 upon nuclear receptor engagement (data not shown). Furthermore, the combination of the RXR ligand 9-Cis Retinoic Acid and 22R-HC greatly enhanced TREM-1 expression, probably due to an additive effect induced by the triggering of the obliged heterodimer LXR/RXR. We also demonstrated that TREM-1 was fully functional, as its triggering induced the release of TNFα and IL-1β. Of note, this effect was observed only when DCs were treated with LPS and retinoids (9-cis RA and AtRA), but not when activated in the presence of 22R-HC or 1α,25dihydroxyvitamin D3. In agreement with these results we observed a strong Th1 polarization of DCs when TREM-1 expression was driven by retinoids. These results suggest distinct functions exerted by different nuclear receptor ligands, which need to be investigated in appropriate microenvironmental conditions. Interestingly, the expression of TREM-1 was up-regulated only following the simultaneous addition of LPS and nuclear receptor ligands (i.e. 22R-HC, AtRA, etc.), with the single treatments leading to a slight or no expression, respectively. This suggests that LPS might induce epigenetic changes favoring the subsequent activity of the nuclear receptor ligands on the TREM-1 expression.Citation28
We evaluated whether TREM-1-expressing DCs were present in vivo. To do that we took advantage of pleural and peritoneal fluids from patients affected by advanced cancers, a condition frequently associated to inflammatory responses, or from patients affected by heart failure (PE23), a condition sometimes associated with the formation of pleural effusions containing pro-inflammatory mediators. Based upon results reporting the identification of a subset of monocyte-derived DCs in inflamed tissues,Citation23 we detected a DC subset expressing TREM-1 in most fluids analyzed, independently of their malignant or benign nature. These fluids also induced the expression of TREM-1, as well as of the LXR and RAR targets when added to differentiating monocyte-derived DCs; thus, functionally demonstrating the presence of oxysterols and retinoids within the fluids.
The regulation of TREM-1 expression induced by nuclear receptor ligands as well as the presence of TREM-1-expressing DCs in conditions associated with inflammation, suggest the involvement of this pathway in physio-pathological conditions, in which an amplification of inflammation is required. In vivo studies are therefore required to mechanistically explain the relevance of this pathway, and to indicate whether the manipulation of this pathway could be useful from a therapeutic standpoint.
In cancer, the increase of s-TREM-1 correlates with poor prognosis in lung cancer patients.Citation15 Moreover, the expression of TREM-1 in Kupffer cells associates with liver cancerCitation29,Citation30 as well as colon cancer.Citation31,Citation32 The deletion of the murine homolog TREM-1 in mice attenuates hepatocellular carcinogenesis triggered by diethylnitrosamine.Citation29 These results are in accordance with our in vivo experiments showing a detrimental effect of TREM-1+ immune cells infiltrating the LLC tumor model. Therefore, the detection of TREM-1+ DCs in effusions from advanced cancer patients seems to be associated with the aggressiveness of the disease and bad prognosis. Although the latter observation seems to be in sharp contrast with the induction of Th1 immune response following TREM-1+ DC engagement, an intriguing hypothesis would reconcile these two conditions through a possible cross-talk between inflammation and cancer with the former exacerbating the tumorigenic process.Citation33 A careful analysis of tumor microenvironment at different tumor stages is needed to clearly define the role of TREM-1+ immune cells during tumor formation and progression.
It is well known that AtRA and 1α,25dihydroxyvitamin D3 exert tolerogenic effect on dendritic cells.Citation34-Citation37 In particular, 1α,25dihydroxyvitamin D3 inhibits the differentiation, maturation and the immunostimulatory capacity of DCs in a VDR-dependent manner.Citation36,Citation37 Whether, the lack of functionality observed upon TREM-1 triggering is responsible for tolerogenic effects and whether it is associated to a decoy function, deserves appropriate experimental settings. AtRA released by DCs together with TGFβ participate in the differentiation of inducible Treg (iTreg) in the gut mucosa,Citation34,Citation38 a differentiation pathway involved in the induction of oral tolerance.Citation39 Interestingly, intestinal macrophages are refractory to TREM-1 induction by TNF, due to the local presence of TGFβ and IL-10.Citation40 These two cytokines down-regulate TREM-1 expression contributing to generate a tolerogenic environment.Citation40 Nevertheless, in inflammatory conditions associated to Toxoplasma gondii infection and to vaccination with an E. coli-derived heat-labile enterotoxin mucosal adjuvant, the induction of Th1 and Th17 cell responses are substantially impaired in vitamin A-deficient mice.Citation41 These findings demonstrate an essential role of RA in the development of Th1 and Th17 cells.Citation41 The identification of TREM-1 as a target gene of RA could contribute to clarify the mechanism by which RA during pathological conditions exert pro-inflammatory functions. Although the triggering of TREM-1 induced by the oxysterol 22R-HC does not enhance the release of TNFα and IL-1β over LPS, the expression of TREM-1 by 22R-HC seems to be in sharp contrast with the anti-inflammatory program exerted by LXRs.Citation42 Indeed, LXRs reduce the inflammation by antagonizing pro-inflammatory transcription factors, such as NF-κB,Citation43 by activating genes with anti-inflammatory activities, such as Mer and Abca1Citation44,Citation45 and by inducing the synthesis of anti-inflammatory fatty acids activating SREBP-1.Citation46 Nevertheless, new protective effects exerted by LXRs are emerging.Citation20 Indeed, LXR activation in macrophages induces the expression of CD38, ultimately constraining Salmonella Typhimurium infection.Citation20 Altogether, these results suggest specific functions for each nuclear receptor in different contexts, an observation that needs further investigations considering the local generation of the ligands and the relative expression of nuclear receptors.
Materials and methods
Reagents, antibodies and cell lines
22R-Hydroxycholesterol, T0901317, All-Trans Retinoic Acids (AtRA), 9-Cis Retinoic Acid (9-cis RA) and 1α,25dihydroxyvitamin D3 (Avanti Polar and Sigma-Aldrich) were used at the concentration of 5 μM and 1 μM. Human DCs were stained with APC anti-TREM-1 (Biolegend), FITC anti-CD83, APC anti-CD1a (Biolegend) or PE anti-CD1a (BD Biosciences), FITC or APC-Cy7 anti-CD16 (Biolegend, clone 3G8), FITC or APC-Cy7 anti-HLA-DR (BD Biosciences, Biolegend), Pe-Cy7 anti-CD11c (Biolegend), PE anti-CD11c (BD Biosciences) or APC anti-CD1c (Biolegend), PE anti-CD11b (BD Biosciences), APC anti-CD206 (Biolegend), or isotype-matched control antibodies. Anti-TREM-1 (R&D Systems, clone 193015). Additionally, we used anti-TREM-1 mAb provided by Marco Colonna. Cells were run on a FACSCanto (BD Biosciences), and data were analyzed by FlowJo. U937 cell line was cultured in RPMI 1640 supplemented with 10% heat-inactivated fetal calf serum (HyClone). U937 (5 x 10⁵) were differentiated with PMA (Sigma-Aldrich) 10 ng/ml for 72 h. Then, cells were collected, washed and stimulated with T1317 or AtRA for 6 or 16 hours. LLC cell line was cultured with RPMI 1640 supplemented with 10% heat-inactivated fetal calf serum (HyClone).
Gene expression profiles of DCs
For each sample, RNA samples was prepared and hybridized onto the GeneChip® Gene 1.0 ST Array (Affymetrix, Santa Clara, CA, USA). The GeneChip® Human Gene 1.0 ST Array (Affymetrix, Santa Clara, CA, USA), which measures gene expression levels of 19,973 well-annotated genes, using a single probe set per gene comprised of multiple probes distributed along the entire length of the genomic locus, thus offering a whole-transcript coverage. The array contains 764,885 distinct probes, with a mean of 28 probes per gene, and all probe sets are perfect match (PM) only. Gene 1.0 ST Array probe design is based on the March 2006 human genome sequence assembly (UCSC hg18, NCBI Build 36). This platform provides more than 99% coverage of sequences present in the RefSeq database (November, 2006; http://www.ncbi.nlm.nih.gov/RefSeq/). Starting from 100 ng of total RNA per sample, biotin labelled targets (cRNA) were prepared using Ambion® Whole Transcript (WT) Expression Kit (Applied Biosystems, Life Technologies) and GeneChip® WT Terminal Labeling and Controls Kit (Affymetrix), following manufacturers’ instructions. After fragmentation, cRNA samples were hybridized on the GeneChip® Gene 1.0 ST (Affymetrix) at 45° C for 16 hours. Following hybridization, non-specifically bound material was removed by washing and detection of specifically bound target was performed using the GeneChip® Hybridization, Wash and Stain kit, and the GeneChip® Fluidics Station 450 (Affymetrix). The arrays were scanned using the GeneChip® Scanner 3000 7G (Affymetrix) and raw data was extracted from the scanned images and analyzed with the Affymetrix Power Tools software package (Affymetrix). Data (CEL files) discussed in this publication have been deposited in ArrayExpress repository (http://www.ebi.ac.uk/arrayexpress/) and are available through the accession number E-MTAB-6224.
Statistical and bioinformatics analysis of microarray data
Using Partek GS (Partek Genomic Suite, St Louis, MO) we applied robust microarray analysis method (RMA) to obtain normalized intensity expression data of Human Gene 1.0 ST Array probe sets of 18 samples. Then, to identify statistical significant differentially modulated genes, we carried out an ANOVA analysis contrasting two group of samples (9 samples of LPS treated DCs vs 9 samples of LPS plus 22R-HC treated DCs) on the basis of an absolute 1.5 fold-change (FC) cut off, a significance level of p-value < 0.01 and after Benjamini Hochberg corrected False Detection Rate (FDR H&B) <0.05. Functional annotation and gene set enrichment analyses of differentially expressed genes were carried out by ToppGene suite (https://toppgene.cchmc.org/)Citation47 using FDR H&B of 0.05 and gene number range from 10 to 1500. Pathways analysis of DEG was performed by using Ingenuity® Pathway Analysis (IPA®, release date: 2012–05-07).
Monocyte-derived DCs
Human DCs were generated and cultured as described elsewhere.Citation48 Human iDC at day 5 of culture were harvested and activated (8 x10⁵ cells) with LPS (100 ng/mL) in 6 wells plate, in the presence or in the absence of natural/synthetic LXR, RXR, RAR or VDR agonists. In some experiments, we activated DCs with poly I:C (20 μg/ml) in the presence or in the absence of nuclear receptor ligands.
Isolation of myeloid DCs
Human myeloid DCs were isolated using the Blood Dendritic Cell Isolation Kit (Miltenyi Biotec). Once isolated, myeloid DCs were activated for 24 h with LPS (100 ng/mL) in the presence or absence of natural/synthetic LXR, RXR, RAR or VDR agonists. For MLR experiments, nuclear receptor-treated DCs were cross-linked by anti-TREM-1 mAb or with the control and then used to stimulate naïve CD4+ T-cells. Peripheral blood mononuclear cells were obtained by healthy donors by following the principles of the Declaration of Helsinki.
TREM-1 cross-linking and ELISA assays
Forty-eight wells plate was coated with 10 μg/ml of agonist anti-TREM-1 mAb (R&D Systems, clone 193015) or with control IgG1 and incubated overnight at 4°C. After that, 1.5 × 10⁵ DCs/well were plated in RPMI 1640 with cytokines and in the presence or absence of LXR, RXR, RAR and VDR ligands. After 24 h the supernatants were harvested and tested by ELISA assays to determine cytokine release. TNFα, IL-1β and IL-23 production by DCs treated with Nuclear Receptor ligands was assessed with ELISA assays accordingly to the manufacturer’s recommendations (BD Biosciences Pharmingen, San Jose, CA).
Total RNA extraction and purification
Twenty-four hours after seeding, DCs were treated with LPS and LPS plus 22R-HC at the concentration of 5 μM for 24 hours, with controls running parallel. Nine replicate samples were carried out for each condition for a total of 18 samples and total RNA was extracted using the Qiazol reagent (Qiagen, Valencia, CA, USA), and purified using the miRNeasy total RNA Isolation Kit (Qiagen, Valencia, CA, USA). Quality and quantity of the total RNA samples were evaluated with 2100 Bioanalyzer (Agilent, Santa Clara, CA) and Nanodrop 1000 (Thermo Fisher Scientific, Wilmington, DE), respectively.
Real-time RT-PCR
Total RNA was isolated with TRIZOL reagent (Invitrogen). Reverse transcription was performed from 1–2 μg of total RNA, incubating 1 hour at 42°C with MLV-reverse transcriptase (Invitrogen). Quantitative PCR was performed using real-time PCR (ViiA7, Applied Biosystems), 40 cycles of 95°C for 12 s and 60°C for 1 min using SybrGreen. Primers used are shown in Supplemental Table 1. All PCR reactions were done in triplicate. The comparative Ct method was used to quantify transcripts that were normalized for human GAPDH. The following set of primers were used: GAPDH FSG 5ʹ-ACATCATCCCTGCCTCTACTG-3ʹ and RSG 5ʹ-ACCACCTGGTGCTCAGTGTA-3ʹ; TREM-1 FSG 5ʹ-TGATCTACCAGCCTCCCAAG-3ʹ and RSG 5ʹ-AGCTTGGGTCACAGTTCTGG-3ʹ; ABCA1 FSG 5ʹ-CCAGGCCAGTACGGAATTC-3ʹ and RSG 5ʹ-CCTCGCCAAACCAGTAGGA-3ʹ; TGM2 FSG 5ʹ-GCCACTTCATTTTGCTCTTCAA-3ʹ and RSG 5ʹ-TCCTCTTCCGAGTCCAGGTACA-3ʹ.
Mixed lymphocytes reaction and intracellular staining
DCs (1 x 10⁴) activated with LPS (100 ng/ml) in the presence or absence of 9-Cis Retinoic Acid (1 μM) and activated with were co-cultured with allogenic CD4+ Naïve T cells (1 x 10⁵ cells/well) isolated with the naive CD4+ T Cell Isolation Kit II (Miltenyi Biotec). After 72 hours rhIL-2 (10 U/ml) was added. On days 6 each MLR was stained with an anti-CD3 antibody and analyzed by flow cytometry intracellular staining for the cytokines TNFα and IFNγ.
Mixed lymphocytes reaction and T cell proliferation
Monocyte-DCs (1.5 x 10⁵) were activated with LPS (100 ng/ml) in the presence of 9-Cis Retinoic Acid (1 μM) and stimulated with anti-TREM-1 mAb or with control IgG1 for 24 hours. Then, DCs were collected, washed and co-cultured (1 x 10⁴) with allogenic T cells (1 x 10⁵ cells/well) previously isolated with the Pan T cell isolation kit (Miltenyi) and labeled with 5 μM of CFSE for 20ʹ. After 72 hours rhIL-2 (10 U/ml) was added. On day 6 each MLR was analyzed by FACS. The T cell proliferation was calculated as the percentage of CFSE+ T cells as compared to non-stimulated CFSE+ T cells.
Chemotaxis assay
Chemotaxis assays were performed using 5-μm pore polycarbonate filters in a 24-well transwell chamber (Corning Costar Corporation). Human T lymphocytes from peripheral blood mononuclear cells of healthy donors were isolated by using the Pan T cell isolation kit (Miltenyi). Purified T cells (2 x 10⁵/100 μl) in RPMI 0.5% BSA were seeded in the upper chamber, whereas in the lower chamber we added 600 μl of medium (RPMI 10% Hyclone) or 600 μl of supernatants from DCs activated for 24 hours with LPS in the presence of 9-Cis Retinoic Acid and stimulated with either anti-TREM-1 mAb or control IgG. Two hours later, migrated cells were measured by flow cytometer acquisition of a fixed number of beads (5.000/sample) (Polysciences). Results of migration experiments were calculated as described previously.Citation48 Spontaneous migration was always subtracted.
Chromatin immunoprecipitacion assay
ChIP experiments were performed using the U937 line differentiated with PMA 10 ng/ml for 72 h and subsequently stimulated with T1317 or AtRA for 6 hours. In brief, 20 × 106 cells were fixed for 10 min at RT with 1% formaldehyde. Crosslinking was terminated by the addition of 125 mM glycine. Cells were rinsed with PBS and centrifuged at 1500 rpm for 5 min at 4°C. Pellets were resuspended in 50 nM Hepes-KOH pH 7.5, 140 mM NaCl, 1 mM EDTA, 10% glycerol, 0.5% NP-40, 0.25% Triton X-100 and leupeptin-pepstatinA-aprotinin at 5 μg/ml [pH 8.1]. Nuclei were collected by centrifugation (4500 rpm for 5 min at 4°C), resuspended in 10 mM Tris-HCl, 200 mM NaCl, 1 mM EDTA, 0.5 mM EGTA and leupeptin-pepstatinA-aprotinin at 5 μg/ml [pH 8.1], and rotated for 10 min at 4°C. Washed nuclei were centrifuged, resuspended in 1 mM EDTA, 10 mM Tris-HCl, 100 mM NaCl, 0.5 mM EGTA, 0.1% Na-Deoxycholate, 0.5% N-sauroylsarconsin and leupeptin-pepstatinA-aprotinin at 5 μg/ml [pH 8.1], and then sonicated to generate DNA fragment sizes of 0.2–0.8 kb, using the Diagenode Bioruptor twin (20 cycles, 30 s on/off, maximum power). Samples were cleared by centrifugation at 14000 rpm for 10 min at 4°C. 2.5 % of the cleared supernatant was used as input, and the remaining volume was immunoprecipitated with 4 μg of anti-LXR antibody (provided by Knut R. Steffensen),Citation49,Citation50 or anti-RAR (sc-773 Santa Cruz)Citation22 and a rabbit IgG serum. Immunoprecipitated DNA was purified using Qiaquick PCR Purification kit (Qiagen), and amplified by qPCR on a ViiA7, Applied Biosystems. Regions within TREM-1 promoter were tested using the following primers: Vimentin FSG 5ʹ-CCATGGTTACACCAC-3ʹ and RSG 5ʹ-AGTAAGAGCGTGCTG-3ʹ; SREBP-1c FSG 5ʹ-AGCGGGTTAAAGGCGGAC-3ʹ and RSG 5ʹ-AGTTTCACCCCGCGGC-3ʹ; ALDH1A1 FSG 5ʹ-GGCCTTAGTGGCCAGAGCAG-3ʹ and RSG 5ʹ-TGCACGGGCTAAAGTTTATTTGC-3ʹ; TREM-1B FSG 5ʹ-TGGGCCTGACTCTCTTCACT-3ʹ and RSG 5ʹ-TGACCTAGAGGCTTCGGAAA-3ʹ. We identified two putative LXRE in the 5ʹ-untranslated regions of the TREM-1 promoter (one at −197/-221 and the other one at −285/-309 bp). The primers used to amplify the immunoprecipitated DNA encompass both the LXRE sequences (between the −346 bp 5ʹ -untranslated region and +1 bp). We used TREM-1 primers as reported in.Citation49
Analysis of TREM-1+ DCs in healthy donors and fluids from cancer patients
Cells from blood of 9 healthy donors were separated by Ficoll gradient, washed twice with PBS and then stained with the following mAbs anti-human CD11b-PerCP-Cy5.5, CD16-FITC, CD11c-PE, CD1c-PE-Cy7, TREM-1-APC, HLA-DR-APC-Cy7. Dead cells were excluded by Dead Cell Stain Kit (Live/Dead Fixable Pacific Blue) used accordingly to the manufacturer’s recommendations. CD11b+ cells were purified from fluids of 9 advanced cancer patients and stained with the above-reported mAbs. CD11b+ cells were isolated with CD11b MicroBeads (Miltenyi Biotec). Samples were run on a Canto II flow cytometer (BD) and analyzed by FlowJo software, gating on live cells. Whisker plot analysis of the results between the two groups was performed by Wilcoxon matched-pairs signed rank test with Prism software. Peripheral blood mononuclear cells from healthy donors and fluids from cancer patients were obtained after written informed consent approved by the Institutional Ethics Committee
TREM-1, ABCA1 and TGM2 expression and statistical association among the transcripts
Monocyte-DCs were activated with LPS and exposed to pleural effusions for 24 h. Then, mono-DCs were collected and RNA extracted by TRIZOL as described above. Samples were then analyzed by qPCR for the expression of TREM-1, ABCA1 and TGM-2 transcripts. A written informed consent was appropriately signed by cancer patients before using pleural effusions or ascites. To show the correlation between ABCA1 and TREM-1 and between TGM2 and TREM-1, a X-Y graph was built up using the numerical values and the trend lines obtained after a simple linear regression analysis. By using the same method, the coefficients of determination, R2, and the p-values were obtained and reported in the text. No logarithmic transformation of the numerical values was performed and outliers where removed whenever applicable. In the reported graphs both ABCA1 and TGM2 were treated as independent variables whereas TREM-1 as a dependent variable.
Analysis of TREM-1 and ITGAX expression and overall survival and relapse free survival in NSCLC and ovarian cancer sample datasets
The correlation between TREM1, or TREM1 plus ITGAX (CD11c) gene expression and Overall Survival or Relapse Free Survival in NSCLC and Ovarian Cancer was performed by using the PROGgeneV2 Prognostic Database.Citation24 For NSCLC samples the analysis was performed by interrogating the GSE8894 datasets containing 137 postoperative NSCLC samples (69 High expressors and 68 Low expressors). For ovarian cancer samples the analysis was performed by interrogating the TCGA datasets containing 578 ovarian samples (289 High expressors and 289 Low expressors). For creation of Kaplan Meier plots, gene expression variable (High and Low expressors) was bifurcated based on median.
Tumor challenge in wild-type and Trem1,3-/- chimera mice
We transplanted lethally irradiated (11 Gy) C57BL/6 mice with bone marrow of Trem1,3−/-, or wild type mice (5 × 10⁶ bone marrow cells/mouse). Six-eight weeks later, we challenged mice with LLC tumor cells (0.35 x 10⁶). TREM-1 analysis was performed by FACS on splenocytes at the end of the experiments. Transplanted mice were treated with enrofloxacin for 15 days (7.5 mg/150 μl Baytril 5% solution in 300 ml of drinking water) accordingly to the indication of the veterinary staff of our spf facility. We evaluated tumor size by measuring perpendicular diameters by a caliper. Data are reported as the mean tumor volume ± SEM. Animal studies were approved by the Institutional Animal Care and Use Committee of the San Raffaele Scientific Institute (IACUC n° 656) and by the Italian Ministry of Health.
Analysis of LLC-infiltrating cells
Tumors collected 17 days after injection were cut into small fragments and digested for 45–60 min at 37°C with 1.4 mg/ml collagenase A, B, and D (Roche) and 40 μg/ml DNase
(Roche) mixture in RPMI medium with 10% FBS. Single cell suspensions were washed and labeled with Dead Cell Stain kit reagents for 30 min at 4°C. After washing, the cells were incubated for 5 min at RT with Fc-blocking solution (10 μg/ml mouse Fc Block; BD) and labeled with CD11b, Ly6G, CD11c CD45.1, or CD45.2 mAbs (Biolegend) and anti-mouse TREM-1 (R&D Systems). Samples were run by FACSCalibur flow cytometer (BD) and analyzed by FlowJo software gating on live cells.
Immunohistochemistry and quantification of tumor-infiltrating CD3+ and CD8+ cells
Deparaffinated histologic sections after antigen retrieval were incubated for 1 h at RT with primary anti-CD3 (clone CD2-12, BioRad) or anti-CD8 antibodies (clone D4W27 Cellsignal), followed, after rinsing in PBS, by rat on mouse HRP polymer (RT517 Biocare) or rabbit on rodent HRP polymer (RMR622 Biocare) respectively, and developed with DAB and H2O2. The amount of immunoreactive CD3+ and CD8+ cells was calculated as the number of positive cells in tumor areas at 400x magnification in 16 high-power fields enriched of T lymphocytes. The analysis was performed on slides from 2 experiments with 3 mice/group (Wild type vs Trem-1,3−/- bone marrow chimera mice challenged with LLC tumors as described above).
Statistical analysis
Data are expressed as mean ± SEM and were analyzed for significance by ANOVA with Dunnet’s, Bonferroni’s or Tukey’s multiple comparison test, or by Student’s t test. The analysis was performed with Prism software.
Disclosure of potential conflicts of interest
No potential conflicts of interest were disclosed.
Author Contributions
R.F., L.R., K.R.S., C.B. M.C. and V.R. designed research; R.F., L.R., L.Ra., A.P., T.J., D.M., C.D., M.M., and C.B. performed research; G.M., A.B., G.Ma. and A.B. provided clinical samples and patients’ clinical data. M.Ce. and M.C. provided TREM-1 reagents and Trem-1,3−/- mice. K.R.S. provided reagents for LXR ChIP experiments. R.C. performed correlative studies among TREM-1, ABCA1 and TGM-2 gene expression. R.F., L.Ra., C.B. and V.R. analyzed data; R.F. and V.R. wrote the paper.
Supplemental Material
Download Zip (2.8 MB)Acknowledgments
We thank Elisa Lenti and Noemi Di Meglio for technical help. We are grateful to Catia Traversari for discussion and suggestions. This work was funded by the Italian Association for Cancer Research (AIRC) (IG 19016) and the Italian Ministry of Health (RF2009). L.Ra. is recipient of a fellowship from the “Fondazione Umberto Veronesi”.
Supplementary material
Supplemental data for this article can be accessed in publishers website.
Additional information
Funding
Related Research Data
References
- Austyn JM. Dendritic cells in the immune system-history, lineages, tissues, tolerance, and immunity. Microbiol Spectr. 2016;4.
- Worbs T, Hammerschmidt SI, Förster R. Dendritic cell migration in health and disease. Nat Rev Immunol. 2017;17:30–48. doi: 10.1038/nri.2016.116.
- Pulendran B. The varieties of immunological experience: of pathogens, stress, and dendritic cells. Annu Rev Immunol. 2015;33:563–606. doi: 10.1146/annurev-immunol-020711-075049.
- Audiger C, Rahman MJ, Yun TJ, Tarbell KV, Lesage S. The importance of Dendritic cells in maintaining immune tolerance. J Immunol. 2017;198:2223–2231. doi: 10.4049/jimmunol.1601629.
- Bensinger SJ, Tontonoz P. Integration of metabolism and inflammation by lipid-activated nuclear receptors. Nature. 2008;454:470–477. doi: 10.1038/nature07202.
- Peet DJ, Janowski BA, Mangelsdorf DJ. The LXRs: a new class of oxysterol receptors. Curr Opin Genet Dev. 1998;8:571–575.
- Raccosta L, Fontana R, Corna G, Maggioni D, Moresco M, Russo V. Cholesterol metabolites and tumor microenvironment: the road towards clinical translation. Cancer Immuno Immunother. 2016;65:111–117. doi: 10.1007/s00262-015-1779-0.
- Klesney-Tait J, Turnbull IR, Colonna M. The TREM receptor family and signal integration. Nat Immunol. 2006;7:1266–1273. doi: 10.1038/ni1411.
- Bouchon A, Dietrich J, Colonna M. Cutting edge: inflammatory responses can be triggered by TREM-1, a novel receptor expressed on neutrophils and monocytes. J Immunol. 2000;164:4991–4995.
- Klesney-Tait J, Colonna M. Uncovering the TREM-1-TLR connection. Am J Physiol Lung Cell Mol Physiol. 2007;293:L1374–6. doi: 10.1152/ajplung.00415.2007.
- Bouchon A, Facchetti F, Weigand MA, Colonna M. TREM-1 amplifies inflammation and is a crucial mediator of septic shock. Nature. 2001;410:1103–1107. doi: 10.1038/35074114.
- Schenk M, Bouchon A, Seibold F, Mueller C. TREM-1–expressing intestinal macrophages crucially amplify chronic inflammation in experimental colitis and inflammatory bowel diseases. J Clin Invest. 2007;117:3097–3106. doi: 10.1172/JCI30602.
- Zysset D, Weber B, Rihs S, Brasseit J, Freigang S, Riether C, Banz Y, Cerwenka A, Simillion C, Marques-Vidal P, et al. TREM-1 links dyslipidemia to inflammation and lipid deposition in atherosclerosis. Nat Commun. 2016;7:13151. doi: 10.1038/ncomms13151.
- Nguyen AH, Berim IG, Agrawal DK. Chronic inflammation and cancer: emerging roles of triggering receptors expressed on myeloid cells. Expert Rev Clin Immunol. 2015;11:849–857. doi: 10.1586/1744666X.2015.1043893.
- Ho -C-C, Liao W-Y, Wang C-Y, Lu Y-H, Huang H-Y, Chen H-Y, Chan W-K, Chen H-W, Yang P-C. TREM-1 expression in tumor-associated macrophages and clinical outcome in lung cancer. Am J Respir Crit Care Med. 2008;177:763–770. doi: 10.1164/rccm.200704-641OC.
- Bosco MC, Pierobon D, Blengio F, Raggi F, Vanni C, Gattorno M, Eva A, Novelli F, Cappello P, Giovarelli M, et al. Hypoxia modulates the gene expression profile of immunoregulatory receptors in human mature dendritic cells: identification of TREM-1 as a novel hypoxic marker in vitro and in vivo. Blood. 2011;117:2625–2639. doi: 10.1182/blood-2010-06-292136.
- Read CB, Kuijper JL, Hjorth SA, Heipel MD, Tang X, Fleetwood AJ, Dantzler JL, Grell SN, Kastrup J, Wang C, et al. Cutting edge: identification of neutrophil PGLYRP1 as a ligand for TREM-1. J Immunol. 2015;194:1417–1421. doi: 10.4049/jimmunol.1402303.
- Tammaro A, Derive M, Gibot S, Leemans JC, Florquin S, Dessing MC. TREM-1 and its potential ligands in non-infectious diseases: from biology to clinical perspectives. Pharmacol Ther. 2017;177:81–95. doi: 10.1016/j.pharmthera.2017.02.043.
- Kim T-H, Lee B, Kwon E, Choi SJ, Lee YH, Song GG, Sohn J, Ji JD. Regulation of TREM-1 expression by 1,25-dihydroxyvitamin D3 in human monocytes/macrophages. Immunol Lett. 2013;154:80–85. doi: 10.1016/j.imlet.2013.08.012.
- Matalonga J, Glaria E, Bresque M, Escande C, Carbó JM, Kiefer K, Vicente R, León TE, Beceiro S, Pascual-García M, et al. the nuclear receptor LXR limits bacterial infection of host macrophages through a mechanism that impacts cellular NAD metabolism. Cell Rep. 2017;18:1241–1255. doi: 10.1016/j.celrep.2017.01.007.
- Evans RM, Mangelsdorf DJ. Nuclear receptors, RXR, and the Big Bang. Cell. 2014;157:255–266. doi: 10.1016/j.cell.2014.03.012.
- van de Pavert SA, Ferreira M, Domingues RG, Ribeiro H, Molenaar R, Moreira-Santos L, Almeida FF, Ibiza S, Barbosa I, Goverse G, et al. Maternal retinoids control type 3 innate lymphoid cells and set the offspring immunity. Nature. 2014;508:123–127. doi: 10.1038/nature13158.
- Segura E, Touzot M, Bohineust A, Cappuccio A, Chiocchia G, Hosmalin A, Dalod M, Soumelis V, Amigorena S. Human inflammatory dendritic cells induce Th17 cell differentiation. Immunity. 2013;38:336–348. doi: 10.1016/j.immuni.2012.10.018.
- Goswami CP, Nakshatri H. PROGgeneV2: enhancements on the existing database. BMC Cancer. 2014;14:970. doi: 10.1186/1471-2407-14-970.
- Raccosta L, Fontana R, Maggioni D, Lanterna C, Villablanca EJ, Paniccia A, Musumeci A, Chiricozzi E, Trincavelli ML, Daniele S, et al. The oxysterol-CXCR2 axis plays a key role in the recruitment of tumor-promoting neutrophils. J Exp Med. 2013;210:1711–1728. doi: 10.1084/jem.20130440.
- Lanterna C, Musumeci A, Raccosta L, Corna G, Moresco M, Maggioni D, Fontana R, Doglioni C, Bordignon C, Traversari C, et al. The administration of drugs inhibiting cholesterol/oxysterol synthesis is safe and increases the efficacy of immunotherapeutic regimens in tumor-bearing mice. Cancer Immuno Immunother. 2016;65:1303–1315. doi: 10.1007/s00262-016-1884-8.
- Bain CC, Montgomery J, Scott CL, Kel JM, Girard-Madoux MJH, Martens L, Zangerle-Murray TFP, Ober-Blöbaum J, Lindenbergh-Kortleve D, Samsom JN, et al. TGFbetaR signalling controls CD103(+)CD11b(+) dendritic cell development in the intestine. Nat Commun. 2017;8:620. doi: 10.1038/s41467-017-00658-6.
- Ostuni R, Natoli G. Lineages, cell types and functional states: a genomic view. Curr Opin Cell Biol. 2013;25:759–764. doi: 10.1016/j.ceb.2013.07.006.
- Wu J, Li J, Salcedo R, Mivechi NF, Trinchieri G, Horuzsko A. The proinflammatory myeloid cell receptor TREM-1 controls Kupffer cell activation and development of hepatocellular carcinoma. Cancer Res. 2012;72:3977–3986. doi: 10.1158/0008-5472.CAN-12-0938.
- Liao R, Sun T-W, Yi Y, Wu H, Li Y-W, Wang J-X, Zhou J, Shi Y-H, Cheng Y-F, Qiu S-J, et al. Expression of TREM-1 in hepatic stellate cells and prognostic value in hepatitis B-related hepatocellular carcinoma. Cancer Sci. 2012;103:984–992. doi: 10.1111/j.1349-7006.2012.02273.x.
- Zhou J, Chai F, Lu G, Hang G, Chen C, Chen X, Shi J. TREM-1 inhibition attenuates inflammation and tumor within the colon. Int Immunopharmacol. 2013;17:155–161. doi: 10.1016/j.intimp.2013.06.009.
- Saurer L, Zysset D, Rihs S, Mager L, Gusberti M, Simillion C, Lugli A, Zlobec I, Krebs P, Mueller C. TREM-1 promotes intestinal tumorigenesis. Sci Rep. 2017;7:14870. doi: 10.1038/s41598-017-14516-4.
- Taniguchi K, Karin M. NF-κB, inflammation, immunity and cancer: coming of age. Nat Rev Immunol. 2018;18:309–324. doi: 10.1038/nri.2017.142.
- Iliev ID, Spadoni I, Mileti E, Matteoli G, Sonzogni A, Sampietro GM, Foschi D, Caprioli F, Viale G, Rescigno M. Human intestinal epithelial cells promote the differentiation of tolerogenic dendritic cells. Gut. 2009;58:1481–1489. doi: 10.1136/gut.2008.175166.
- Guilliams M, Crozat K, Henri S, Tamoutounour S, Grenot P, Devilard E, de Bovis B, Alexopoulou L, Dalod M, Malissen B. Skin-draining lymph nodes contain dermis-derived CD103(-) dendritic cells that constitutively produce retinoic acid and induce Foxp3(+) regulatory T cells. Blood. 2010;115:1958–1968. doi: 10.1182/blood-2009-09-245274.
- Penna G, Amuchastegui S, Giarratana N, Daniel KC, Vulcano M, Sozzani S, Adorini L. 1,25-Dihydroxyvitamin D3 selectively modulates tolerogenic properties in myeloid but not plasmacytoid dendritic cells. J Immunol. 2007;178:145–153.
- Szeles L, Keresztes G, Torocsik D, Balajthy Z, Krenacs L, Poliska S, Steinmeyer A, Zuegel U, Pruenster M, Rot A, et al. 1,25-dihydroxyvitamin D3 is an autonomous regulator of the transcriptional changes leading to a tolerogenic dendritic cell phenotype. J Immunol. 2009;182:2074–2083. doi: 10.4049/jimmunol.0803345.
- Cassani B, Villablanca EJ, Quintana FJ, Love PE, Lacy-Hulbert A, Blaner WS, Sparwasser T, Snapper SB, Weiner HL, Mora JR. Gut-tropic T cells that express integrin α4β7 and CCR9 are required for induction of oral immune tolerance in mice. Gastroenterology. 2011;141:2109–2118. doi: 10.1053/j.gastro.2011.09.015.
- Villablanca EJ. Retinoic acid-producing DCs and gut-tropic FOXP3(+) regulatory T cells in the induction of oral tolerance. Oncoimmunology. 2013;2:e22987. doi: 10.4161/onci.22987.
- Schenk M, Bouchon A, Birrer S, Colonna M, Mueller C. Macrophages expressing triggering receptor expressed on myeloid cells-1 are underrepresented in the human intestine. J Immunol. 2005;174:517–524.
- Hall JA, Grainger JR, Spencer SP, Belkaid Y. The role of retinoic acid in tolerance and immunity. Immunity. 2011;35:13–22. doi: 10.1016/j.immuni.2011.07.002.
- Joseph SB, Castrillo A, Laffitte BA, Mangelsdorf DJ, Tontonoz P. Reciprocal regulation of inflammation and lipid metabolism by liver X receptors. Nat Med. 2003;9:213–219. doi: 10.1038/nm820.
- Ghisletti S, Huang W, Ogawa S, Pascual G, Lin M-E, Willson TM, Rosenfeld MG, Glass CK. Parallel SUMOylation-dependent pathways mediate gene- and signal-specific transrepression by LXRs and PPARgamma. Mol Cell. 2007;25:57–70. doi: 10.1016/j.molcel.2006.11.022.
- Ag N, Bensinger SJ, Hong C, Beceiro S, Bradley MN, Zelcer N, Deniz J, Ramirez C, Díaz M, Gallardo G, et al. Apoptotic cells promote their own clearance and immune tolerance through activation of the nuclear receptor LXR. Immunity. 2009;31:245–258. doi: 10.1016/j.immuni.2009.06.018.
- Ito A, Hong C, Rong X, Zhu X, Tarling EJ, Hedde PN, Jacobs WR, Hendrix RW, Lawrence JG, Hatfull GF. LXRs link metabolism to inflammation through Abca1-dependent regulation of membrane composition and TLR signaling. Elife. 2015;4:e08009. doi: 10.7554/eLife.06416.
- Oishi Y, Spann NJ, Link VM, Muse ED, Strid T, Edillor C, Kolar MJ, Matsuzaka T, Hayakawa S, Tao J, et al. SREBP1 Contributes to resolution of pro-inflammatory TLR4 signaling by reprogramming fatty acid metabolism. Cell Metab. 2017;25:412–427. doi: 10.1016/j.cmet.2016.11.009.
- Chen J, Bardes EE, Aronow BJ, Jegga AG. ToppGene Suite for gene list enrichment analysis and candidate gene prioritization. Nucleic Acids Res. 2009;37:W305–11. doi: 10.1093/nar/gkp427.
- Villablanca EJ, Raccosta L, Zhou D, Fontana R, Maggioni D, Negro A, Sanvito F, Ponzoni M, Valentinis B, Bregni M, et al. Tumor-mediated liver X receptor-alpha activation inhibits CC chemokine receptor-7 expression on dendritic cells and dampens antitumor responses. Nat Med. 2010;16:98–105. doi: 10.1038/nm.2074.
- Jakobsson T, Venteclef N, Toresson G, Damdimopoulos AE, Ehrlund A, Lou X, Sanyal S, Steffensen KR, Gustafsson J-A, Treuter E. GPS2 is required for cholesterol efflux by triggering histone demethylation, LXR recruitment, and coregulator assembly at the ABCG1 locus. Mol Cell. 2009;34:510–518. doi: 10.1016/j.molcel.2009.05.006.
- Pehkonen P, Welter-Stahl L, Diwo J, Ryynanen J, Wienecke-Baldacchino A, Heikkinen S, Treuter E, Steffensen KR, Carlberg C. Genome-wide landscape of liver X receptor chromatin binding and gene regulation in human macrophages. BMC Genomics. 2012;13:50. doi: 10.1186/1471-2164-13-50.