
ABSTRACT
Chronic lymphocytic leukemia (CLL) is associated with abnormal T-cell responses responsible for defective anti-tumor activities. Intriguingly, CLL B cells share phenotypical characteristics with regulatory B (Breg) cells suggesting that they might negatively control the T-cell activation and immune responses. We elaborated an in vitro co-culture system with T cells to evaluate the Breg capacities of CLL B cells following innate Toll-like receptor 9 (TLR9) engagement. We demonstrated that B cells from half of the patients exhibited regulatory capacities, whilst B cells from the remaining patients were unable to develop a Breg function. The T cell sensitivities of all patients were normal suggesting that defective Breg activities were due to intrinsic CLL B cell deficiencies. Thus, TLR-dedicated gene assays highlighted differential signature of the TLR9 negative regulation pathway between the two groups of patients. Furthermore, correlations of the doubling time of lymphocytosis, the time to first treatment, the mutational status of IgVH and the Breg functions indicate that patients with efficient Breg activities have more aggressive CLL than patients with defective Breg cells. Our in vitro observations may open new approaches for adjusting therapeutic strategies targeting the Breg along with the evolution of the disease.
Introduction
Chronic lymphocytic leukemia (CLL) is a clinically heterogeneous disease characterized by the accumulation of CD5+ tumor B cells originating either from naïve B cells,Citation1 marginal zone B cells,Citation2 mature CD5+ B cells,Citation3 or from the CD27+ memory B cell compartment.Citation4 Development of the disease is associated with abnormal immune responses that may be responsible for the defective anti-tumor activity.Citation5 T cells display abnormal functions and are unable to trigger, sustain and complete an immune response against the tumor cells.Citation6 One explanation can be found in the differential sensitivity of CD4+ and CD8+ T cells to be terminated by CLL B cells.Citation7 The enriched regulatory T (Treg) cells in progressive CLL patients compared with indolent patients and normal individuals also suggests a down-regulation of the tumor-specific response.Citation8
It has now been widely demonstrated that some B cells have regulatory properties to control adaptive as well as innate immune responses in autoimmunity, Citation9,Citation10 infections,Citation11 allergiesCitation12 and cancers mainly through IL-10-dependent and IL-10 independent mechanisms.Citation13–Citation15 Thus, one of the predominant regulatory factors secreted by Breg cells is IL-10.Citation16 The IL-10 producing Breg cells, called B10 cells in mice,Citation17 represent less than 5% of the B-cell pool in humans.Citation18 They differentiate from CD24hi CD27+ memory B cells expressing the CD5 molecule following BCR and subsequent CD40 signaling,Citation19 suggesting that antigen exposure and T-cell contact are key components for their generation.Citation20 However, TLR9 and IL-21R signals are able to generate effector B10 cellsCitation17,Citation21 indicating that innate stimulations can also activate efficient regulatory activities. Other Breg cells can be functionally defined by their IL-10-independent control of the immune responses. Thus, CD24hiCD38hiCD5+ B cells suppress the proliferative response of T cellsCitation22 and the function of dendritic cellsCitation23 mainly by cellular interactions, TGF-β production and Treg expansion.Citation24 Their regulatory properties are acquired following CD40 activation during cell-to-cell contacts and are up-regulated following TLR9 engagement.
Breg and CLL B cells share phenotypical characteristics, both expressing CD5, CD24 and CD27Citation25 and low levels of surface IgM.Citation18,Citation26 They also share physiological analogies. While non-stimulated CLL cells produce low levels of IL-10,Citation27 in vitro stimulation through CD40L or TLR9 induces significant production of IL-10,Citation25 similar to human Breg cells.Citation9,Citation17,Citation22 Furthermore, the inability of CLL B cells to stimulate T cell proliferation or their Th1 polarizationCitation28 associated with increased Treg frequenciesCitation29 suggest that they could exhibit regulatory properties like Breg cells inhibiting the T cell proliferation through an IL-10-independent mechanism,Citation22,Citation30 suppressing the Th1 polarization through the production of IL-10Citation20 and expanding the Treg cells.Citation22,Citation24 Taken together, the disturbance of the immune responses observed in CLL patients may result from the development of different Breg functions.Citation31
While CLL B cells may share IL-10-dependent immunosuppressive functions with B10 cells leading to the control of Th1 polarization,Citation25 their IL-10-independent regulatory properties to control the T cell proliferation during immune responses have never been identified. To evaluate these capacities, we developed an autologous in vitro co-culture system. We highlight that B cells from half of the patients exhibit efficient regulatory capacities, whilst B cells from the remaining patients are unable to develop regulatory function after TLR9 stimulation. Comparison of the two groups indicates differential gene expression signatures related to the control of the TLR9 pathway. Moreover, Breg activity appears to be associated with the clinical evolution suggesting that the development of the IL-10-independent regulatory control of the CLL B cells may be associated with the aggressive outcome of the disease.
Results
Tlr9-induced Breg activity differentiates two groups of CLL patients
To assess the IL-10-independent Breg function, purified B cells were incubated for 4 days with autologous T cells activated by anti-CD3 and anti-CD28 mAb to induce their proliferation in the presence of CpG-ODN.Citation22 TLR9 stimulation of CLL B cells identified two groups of patients ()). A regulatory activity was observed in the first group, classified as Reg POS CLL patients, for which the T cell proliferation was inhibited by +8.0 ± 1.2%. In the second group, classified as Reg NEG CLL patients, no inhibition of the T cell proliferation was induced (−8.2 ± 1.3%; p < 0.001) ()). Because the control of the T cell proliferative response by the B cells is IL-10 independent,Citation22 but involves a TGF-β-dependent mechanism as previously demonstrated with blocking Abs,Citation24 both cytokines were assessed in the two groups. Consistent with these observations, the level of the inhibition of the T cell proliferation was not associated with the concentration of IL-10 but was slightly, though not significantly, correlated with the concentration of TGF-β detected in the co-culture’s supernatants ()). Furthermore, because CLL B cells are prone to die spontaneously in vitro,Citation32 the level of the B cell mortality after 4 days of co-cultures was evaluated. Reg POS and Reg NEG CLL B cells exhibited 7.8 ± 2.1% and 8.2 ± 2.3% of mortality respectively ()), indicating that the different Breg behavior cannot be ascribed to different survival levels. Moreover, the level of inhibition of T cell proliferation was not enhanced when the CLL B cell ratio increased (p < 0.05) ()), suggesting that B cell regulatory deficiency in the Reg NEG CLL is independent of lymphocytosis. The ensuing experiments were therefore performed at a 1T:1B ratio for all samples.
Figure 1. The regulatory activity of TLR9-stimulated CLL B cells is impaired. Purified peripheral blood T cells from CLL patients were labeled with cell trace violet (CTV), stimulated with anti-CD3 and anti-CD28 mAbs, and their proliferative response evaluated by the decreased CTV fluorescence intensity after four days of cultures with or without purified autologous CpG-stimulated B cells added at a 1:1 ratio. (a) Representative examples of T cell proliferation (left) and determination (right) of Reg POS CLL (n = 30) and Reg NEG CLL (n = 26) B cell regulatory activities evaluated as the B cell-induced inhibition of T cell proliferation. (b) Correlations between the B cell-induced inhibition of the T cell proliferation and the concentrations of IL-10 and TGF-β in the supernatants determined by ELISA. Regression lines are shown. (c) Frequencies of CD19+ DRAQ7+ died B cells after 4 days of co-cultures evaluated by flow cytometry. (d) Regulatory activities of Reg POS CLL (n = 3) and Reg NEG CLL (n = 6) B cells evaluated in co-cultures with T cells at various T cell:B cell ratio. Results are expressed as Mean ± SEM. *p < 0.05; **p < 0.01; ***p < 0.001; ns, not significant.
CLL T cell proliferation response is not defective
It can be argued that T cell differential sensitivitiesCitation7 and/or differential CD4:CD8 ratioCitation33 could be responsible for the discrepancies in the Breg activities. However, the T cells exhibited similar levels of mortality after 4 days of co-culturing (p > 0.05) and the CD4:CD8 ratios were found to be identical between Reg POS CLL and Reg NEG CLL patients (p > 0.05) ()). Moreover, the proliferation index of CD4+ and CD8+ T cells ()) were equivalent between Reg POS CLL (2.8 ± 0.2 and 3.1 ± 0.1, respectively) and Reg NEG CLL (2.7 ± 0.1 and 2.7 ± 0.3, respectively) (p > 0.05), and the CD4+ and CD8+ T cells were similarly regulated by their B cell counterparts in autologous co-culture experiments ()). Taken together, these results indicate that the distinct Breg activities between the two groups of CLL patients are not due to differential CD4+ or CD8+ T cell sensitivities.
Figure 2. CLL T cell proliferative response is effective. T and B cells were purified from the peripheral blood of CLL patients and healthy controls (HC). T cells were labeled with cell trace violet (CTV), stimulated with anti-CD3 and anti-CD28 mAbs, and their proliferative response evaluated by the decreased CTV fluorescence intensity after four days of cultures with or without CpG-stimulated B cells. (a) Frequencies of CD19-DRAQ7+ died T cells after 4 days of co-culture evaluated by flow cytometry and CD4:CD8 T cells ratio in peripheral blood before co-culture. (b) Proliferation capacity of Reg POS CLL (n = 6) and Reg NEG CLL (n = 6) CD4+ T cells and CD8+ T cells stimulated without B cells. (c) Determination of the CLL B cell-induced inhibition of autologous CD4+ T cell and CD8+ T cell proliferation. (d) Regulatory activities of Reg POS CLL (n = 8) and Reg NEG CLL (n = 16) B cells evaluated in heterologous co-cultures with HC cells. Mean ± SEM. *p < 0.05; **p < 0.01, ***p < 0.001; ns, not significant.
Furthermore, in heterologous co-cultures ()), healthy control (HC) B cells similarly inhibited the proliferation of Reg POS CLL T cells (+17.8 ± 3.5%) and Reg NEG CLL T cells (+13.0 ± 1.8%) (p > 0.05). Conversely, Reg POS CLL B cells but not Reg NEG CLL B cells inhibited the proliferation of HC T cells (+5.7 ± 2.0% vs −12.2 ± 7.3%, p < 0.05, respectively). All these data indicate identical sensitivities of the T cells from Reg POS CLL and Reg NEG CLL patients and emphasize that B cells from Reg NEG CLL patients exhibit intrinsic defective Breg capacities compared to B cells from Reg POS CLL patients.
Differential efficient signaling pathways in Reg POS and Reg NEG CLL B cells
To understand the differential Breg capacities of CLL B cells, we first searched for phenotypic discrepancies. As expected, all B cells displayed a unique cell surface phenotype ()), confirming the CLL diagnosis established by Matutes et al. for both Reg POS and Reg NEG patients with higher level of CD5 and reduced expression of CD22, CD79b, IgM, IgD and FMC7 relative to HC B cells.Citation34,Citation35 As previously described, decreased levels of CD19 and CD20 were also found confirming the cellular origin of these cells. However, the densities of molecules previously shown to be associated with regulatory function such as CD23, TLR9, CD24, BR3 IL-21R, CD25, CD38 or TACI were similar on Reg POS and Reg NEG CLL B cells (p > 0.05) ()). Because CD27− naïve B cells were considered to possess a greater regulatory capacity than CD27+ memory B lymphocytes,Citation30 CD27 expression was also evaluated. All cells were found to be positive with identical CD27 MFI on Reg POS and Reg NEG CLL B cells (p > 0.05), suggesting that the presence of CD27 is unlikely associated with the efficacy of the Breg effect of the CLL B cells. Finally, CD40 which is known to be required for the generation of the Bregs,Citation22 was also similarly expressed on Reg POS and Reg NEG CLL B cells (p < 0.05), suggesting that this interacting molecule is unlikely responsible for the difference in the Breg activity.
Figure 3. Phenotypic characteristics of CLL B cells. (a) Representative examples of peripheral B cell flow cytometry analysis from healthy controls (HC), Reg POS CLL and Reg NEG CLL patients. (b) Mean fluorescence intensity (MFI) of all markers analyzed on HC (n = 29), Reg POS CLL (n = 21) and Reg NEG CLL (n = 20) B cells. Representative examples of CD40 expression on HC (n = 5), Reg low CLL (n = 5) and Reg NEG CLL (n = 5) B cells. (c) Determination of HC, Reg POS CLL and Reg NEG CLL B cell regulatory activities evaluated as the CpG-activated B cell-induced inhibition of T cell proliferation in a 4-day autologous co-culture with or without anti-CD40L blocking mAb. Results are expressed as Mean ± SEM. *p < 0.05; **p < 0.01, ***p < 0.001; ns, not significant.
To go further in depth, we then questioned the efficiency of the activating TLR9 signaling. B cells were incubated with CpG-ODN for 48h. The MFI of the CD86 and CD25 molecules were up-regulated without significant differences between Reg POS and Reg NEG CLL B cells ()). However, while Reg POS CLL displayed higher proportion of CD69+ activated B cells, TLR9 stimulation increased their frequencies in the two groups indicating that Reg POS as well as Reg NEG CLL B cells can be activated by CpG-ODN ()). The TLR9-induced up-regulation of CD40 expression was also evaluated.Citation22,Citation24 Reg NEG CLL B cells exhibited a lower up-regulated expression of CD40 molecules compared to the enhanced density triggered on Reg POS CLL B cells ()). These results suggest a defective TLR9 signaling pathway in the Reg NEG CLL B cells that may be responsible for their inability to develop Breg activity in close contact with the T cells.
Figure 4. Specific TLR9 pathway functionalities in CLL B cells. (a) Peripheral B cells from Reg POS CLL and Reg NEG CLL patients were stimulated for 2 days with or without CpG-ODN. Representative examples of CD86, CD25, CD69 and CD40 expression analyzed by flow cytometry (upper) and index of induction (lower) on Reg POS CLL (n = 5) and Reg NEG CLL (n = 5) B cells. Results are expressed as Mean±SEM.***p < 0.001. (b-c) After 3 days of co-cultures with autologous activated T cells, CpG-stimulated HC, Reg POS CLL and Reg NEG CLL B cells were sorted. TLR-associated gene expressions were assessed using TaqMan array qRT-PCR and protein expressions assessed by Western Blot. (b) Heat maps of differential expression profiles (Ct values) between Reg POS CLL and Reg NEG CLL B cells are shown. (c) Fold change expression of mRNA and proteins in Reg POS and Reg NEG CLL B cells compared to HC B cells.
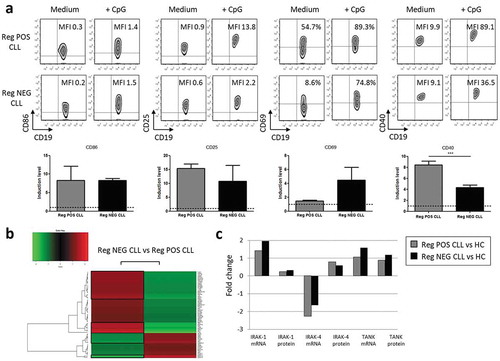
Therefore, we deciphered the TLR9 pathway engaged and controlled following CpG-ODN stimulation and 3 days of co-cultures. Among 66 genes analyzed in the TLR-dedicated TaqMan gene expression assays, 29 genes were over-expressed and 10 genes were under-expressed in the Reg NEG CLL B cells compared to the Reg POS CLL B cells ()). Among these clusters, 12 genes were relevant to the TLR9 pathways (). In the Reg NEG B cells, 4 genes associated with activating signals were over-expressed (TBK1, IRAK-4, IRAK-1 and REL) when 6 genes were under-expressed (IRF-7, IRF-8, MAPK14, MAPK13, RELB and UBC). Moreover, 2 genes associated with inhibitory signals of the TLR9 pathway were also over-expressed in the Reg NEG CLL B cells (TOLLIP and TANK) when none were under-expressed compared to the Reg POS CLL B cells. Compared with HC, this differential expression was confirmed at the mRNA and protein levels for IRAK-1, IRAK-4 and TANK molecules for which specific bands could be identified with the corresponding mAbs on the Western Blot ()). The imbalance in favor of the inhibitory signals of the TLR9 pathway may be the basis of the inability for the Reg NEG CLL B cells to develop a Breg function following TLR9 stimulation.
Table 1. Differential expression of the TLR9 pathway-associated genes in Reg NEG CLL B cells compared to Reg POS CLL B cells.
Correlation of the Breg capacities, the time to first treatment and the doubling time of lymphocytosis
Finally, the correlation of the Breg capacities with clinical aspects was assessed (). Breg activities were not correlated with either sex, age of diagnosis, the Binet stage, lymphocytosis, or CD38 expression. Identical repartitions of cytogenetic abnormalities ()) as well as mutational status of IgVH ()) were also observed in Reg POS and Reg NEG CLL B cells. However, patients with unmutated IgVH status are known to exhibit a more aggressive form of CLL compared with patients harboring a mutated IgVH.Citation36 We wish to evaluate the impact of the Breg efficiency on the CLL agressivity. We found that the doubling time of lymphocytosis appeared more quickly for the patients with unmutated IgVH than for the patients with mutated IgGVH, and even more quickly for the Reg POS CLL patients than for the Reg NEG CLL patients (p < 0.05) ()). Furthermore, the time to first treatment occurred earlier for the patients with unmutated IgVH than for the patients with mutated IgVH and even more earlier for the Reg POS CLL patients than for the Reg NEG CLL patients (p < 0.05) ()). These observations indicate that the detection of Breg activity is associated with a more aggressive form of CLL.
Table 2. Clinical characteristics of the CLL patients.
Figure 5. Patients with regulatory B cell activity present a more aggressive form of CLL. Comparisons of chromosomal abnormalities (a) and IGVH mutational status (b) between Reg POS CLL and Reg NEG CLL patients. (c-d) Kaplan-Meier graphs for the comparisons between Reg POS CLL and Reg NEG CLL patients according to their IGVH mutational status. (c) Comparisons of the doubling time of lymphocytosis. (d) Comparisons of the time to first treatment. ns, not significant.
Discussion
Breg cells turn off the anti-tumor T-cell immune responses in solid cancers by the inhibition of the T cell proliferation and the expansion of the Treg cells.Citation37,Citation38 Their role in the development of CLL is not fully clarified and the question as to whether CLL B cells can be considered as Breg cells contributing to disease progression has not yet been elucidated. Two functional mechanisms defining distinct subsets of Breg cells have been recognized to date. The first corresponds to B cells expressing IL-10Citation18 leading to the control of the Th1 polarization and inflammatory responses.Citation39 CLL B cells share the functional capacity to express IL-10Citation27 although the identification and characterization of IL-10 competent CLL cells remain to be established.Citation25 The second mechanism is IL-10-independent and requires cell-to-cell contactCitation40 with CD40/CD40L interaction leading to the control of the T cell proliferation.Citation22,Citation30 Herein, TLR9 engagement, known to induce efficient IL-10-independent Breg activities in HC B cellsCitation22 defined two groups of patients classified as Reg POS and Reg NEG CLL. No evident association could be found with either clinical aspect or with the IgVH mutational status of any patients, suggesting that defective IL-10-independent Breg activity is not associated with specific antigen patterns. Heterogeneous responses to CpG-stimulation have already been reported with proliferation of CLL B cells in half of the cases but also with apoptosis in some cases.Citation41–Citation43 It is likely that the variation of intra-cellular signaling pathways might determine different CLL B cell behaviours in response to TLR9 engagement as shown for example by the variable magnitude of Akt signaling.Citation44 Thus, it has been recently demonstrated that the levels of CD19 expression and the associated intracellular pathways are key elements in the efficient TLR9-induced B cell activation. CD19 abrogated expression and an altered PI3K/Akt/BTK-dependent CD19 pathway result in a TLR9 activation defect.Citation45 As previously observed,Citation46,Citation47 we found lower CD19 surface expression on CLL B cell patients compared to HC B cells but the levels were similar on Reg POS and Reg NEG CLL B cells, suggesting that CD19 expression is unlikeky involved in the Breg deficiencies of the Reg NEG patients. Furthermore, the over-expression of the inhibitors TOLLIP and TANK in the Reg NEG CLL B cells participating in the inhibition of the TLR9 signals could explain the absence of Breg activities in these patients. Consistent with this hypothesis, TLR9 stimulation induced a lowered CD40 up-regulation on Reg NEG CLL B cells. This implies defective CD40-mediated transductionsCitation48 that might be inappropriate to efficiently activate the CLL B cells during the close contact with T cells and may impede the development of Breg activities.Citation22
Our observations indicate that the TLR9-induced Breg control of the T cell proliferation develops in patients with shorter doubling time of lymphocytosis and with earlier time to first treatment suggesting that IL-10-independent Breg properties may be more readily apparent in more aggressive CLL B cells. These Breg functions may control anti-tumor immune responses over time and could explain why time from diagnosis is associated with the severity of immune suppression, especially when TLR9 signaling is effective.Citation5 There are also arguments supporting the concept of CLL B cells that may exhibit IL-10-competence contributing to the immunosuppression observed in these patients.Citation25 Further studies will be required to evaluate whether IL-10-dependent and -independent regulatory mechanisms may jointly occur or appear separately during disease progression and whether these Breg activities may be the properties of distinct or common CLL cells. The emergence or disappearance of the Breg effects might influence the outcome of the disease’s severity. Ultimately, understanding how these Breg mechanisms are controlled may help in the selection of targeted therapies that could be adjusted along with the evolution of the disease.
Materials and methods
Patients and normal controls
Fifty-six untreated patients fulfilling the criteria for the diagnosis of CLL were enrolled in the study and were scored clinically according to Matutes and colleagues.Citation34 Twenty males and 15 females ranging in age from 40 to 84 were scored at stage A, 10 males and 8 females ranging in age from 43 to 79 scored at stage B and 3 males ranging in age from 54 to 71 scored at stage C. For some experiments, blood was also taken from 29 aged-matched healthy controls (HC). Consent was obtained from all individuals and the protocol conducted in compliance with the Declaration of Helsinki and approved by the Ethical Board at the Brest University Medical School Hospital (OFICE, nov 26th, 2015, collection 2008–214).
Cell preparation
Peripheral blood mononuclear cells were separated by density-gradient centrifugation on Ficoll-Hypaque (Eurobio, Courtaboeuf, France). B lymphocytes were enriched with a negative pan B-cell isolation kit (Miltenyi Biotec, Paris, France). Due to the weak frequency in CLL, T cells were directly isolated from the patients’peripheral blood using the positive MACSxpress Pan T cell isolation kit (Miltenyi Biotec) while T lymphocytes from HC were isolated with neuraminidase-treated sheep red blood cells (Thermo scientific, Hampshire, United Kingdom). The purity was over 90% in all conditions.
Cell culture
Cells were cultured at 37°C into 96-well plates coated with a goat affiniPure F(ab’)2 anti-mouse IgG fragment (Jackson Immunoresearch, Baltimore, USA) in RPMI1640 medium (Sigma Aldrich, Saint Louis, USA) supplemented with 2 mM L-glutamine, antibiotics and 10% of human AB serum (Sigma Aldrich). 4.10Citation4 T cells were stimulated with mouse anti-human CD3 (0.2µg/ml, Clone OKT3, Biolegend, San Diego, USA) and anti-human CD28 (0.2µg/ml, Clone CD28.2, Beckman Coulter, Marseille, France) mAb to induce their proliferation. TLR9 of B cells was activated with CpG-ODN 2006 (0.25 µM, Invivogen, Toulouse, France). T and B cells were co-cultured at a 1:1 ratio as previously described,Citation22 unless otherwise indicated, for four days. For the proliferation assays, T cells were first labeled with the CellTrace™ Violet Cell Proliferation Kit (ThermoFisher scientific, Waltham, USA) and analyzed by flow cytometry (Navios, Beckman Coulter, Villepinte, France). The proliferative response was evaluated using the FlowJo software (FlowJo, Ashland, USA) as a proliferation index into two conditions: when T cells were cultured alone and when T cells were co-cultured with B cells in the presence of CpG-ODN. The inhibition of proliferation in the presence of B cells was then calculated according to the following formula: ((Proliferation index of T cells cultured alone – Proliferation index of T cells co-cultured with B cells)/Proliferation index of T cells cultured alone)x100. To study the B cell activation, 5.10Citation5 CLL B cells were cultured alone for 48h in a 48-well plate with or without anti-CD40 activating mAb (2µg/ml, Beckman Coulter) or CpG-ODN (0.25µM).
Flow cytometry
All antibodies were from Beckman Coulter unless otherwise specified: FITC-conjugated anti-TLR9 (Imgenex, San Diego, USA), CD268 (B-cell activating factor- receptor (BAFF-R, Biolegend), IgD, CD19, CD25 (BD Biosciences, San Jose, USA), phycoerythrin (PE)-conjugated anti-CD5, CD19, CD86, IL21R (BD Biosciences, Grenoble, France), IgM, CD267 (TACI, Biolegend), CD69, CD40, PE-cyanin(Cy)5.5-conjugated anti-CD4, anti-CD27, CD25, CD79b, PE-Cy7-conjugated anti-CD19, CD23, CD38, allophycocyanin (APC)-conjugated anti-CD40, CD24, APC-Alexa Fluor 700 (AF700)-conjugated anti-CD19, APC-AF750-conjugated anti-CD5, Pacific blue (PB)-conjugated anti-CD22, CD20 and FMC7, Krome Orange (KO)-labelled anti–CD8 mAbs. 1 × 10Citation6 lymphocytes were incubated for 30 min at 4°C with saturating concentrations of mAbs. The determination of the mean fluorescence intensity (MFI) of all markers required a minimum of 5,000 events. The results were standardized to those obtained with isotype controls. For intracellular staining, a preliminary permeabilization was performed with the cytofix/cytoperm kit (BD Biosciences). For the proliferation evaluation after co-culture, the fluorescence intensity of Cell Trace Violet was analyzed on CD19-negative T cells. Their viability was assessed using the DRAQ7 DNA staining dye (DRAQ7 Biostatus, Beckman Coulter).
Elisa
Concentrations of IL-10 and TGF-β from the supernatants of co-cultures were measured with OptEIA™ IL-10 (BD Biosciences) and Human TGF-beta 1 Quantikine (R&D System) ELISA kits, respectively.
Real time quantitative PCR (qRT-PCR) and western blot
After 3 days of co-culture with autologous T cells, CpG-simulated B cells from CLL patients and HC were positively selected with the CD19 MicroBeads kit (Miltenyi Biotec) for qRT-PCR and Western Blot studies. Total RNA was extracted with the RNeasy Plus Micro kit (Qiagen, Courtaboeuf, France) and reverse transcribed to cDNA with Superscript II reverse transcriptase (Invitrogen). Gene expression patterns of TLR pathways were evaluated using the TaqMan Array Plate (Applied Biosystems, Foster City, USA). For each group defined below, 3 samples of cDNA were diluted (1/40), mixed and added on one plate. Relative expression was normalized with the mean of all CTs (Cycle Threshold) and compared to each other with the fold change method.Citation49 CT values greater than 35 reflected no expression and were excluded from analysis.
After washing at 4°C in TNE buffer (25mM Tris-HCl pH 7.5, 140 mM NaCl and 1 mM EDTA), positively selected B cells were incubated for 30 min in 1% Triton X-100 in TNE buffer containing anti-proteases cocktail (Sigma). Samples were separated by SDS-PAGE electrophoresis and proteins transferred on polyvinylidene difluoride (PVDF) membranes. After 1 h of saturation with 5% milk in 0.1% Tween 20 buffer, PVDF membranes were incubated in the presence of either rabbit anti-IRAK-1, anti-IRAK-4 (Cell signaling) or anti-TANK (Abcam) antibodies. After washes, HRP-conjugated anti-rabbit immunoglobulins (Jackson) were added, revealed using the ECL Advance Kit (GE Healthcare) and membranes analyzed with Quantity One Software (BioRad).
Mutational status of IgVH
The immunoglobulin variable heavy chain (IgVH) gene mutation status was determined after PCR amplification and sequencing based on the BIOMED-2 consortium guidelines.Citation50100ng of genomic DNA isolated with the BioSprint 15 DNA Blood kit (Qiagen), 0.25µl of Ampli Taq Gold DNA Polymerase (Applied Biosystem), 10pmol of each primer, 0.2mM dNTP Mix, 1.5mM MgCl2, 1x PCR Buffer II, and water adjusted to 50µl were used to perform the multiplex PCR amplifications. PCR products were controlled through 2% agarose gel, purified with ExoSAP-IT PCR product cleanup kit (Affymetrix, High Wycombe, United Kingdom) and sequenced with a Big Dye Terminator v3.1 cycle sequencing kit (Applied Biosystem). Results were analyzed with the database IMGT/HighV-Quest (The international ImMunoGeneTics information system, Montpellier).Citation51 A homology sequence >98% defined an un-mutated status.
Statistics
All the results were analyzed with GraphPad Software and presented as Mean ± SEM. Analyses were performed using Mann-Whitney and Chi-square statistical tests, with significances assessed at p < 0.05.
Abbreviations
| MFI | = | mean fluorescence intensity |
| ND | = | not determined |
| UND | = | undetermined. p: Comparison between Reg POS and Reg NEG CLL patiens. |
Disclosure of Potential Conflicts of Interest
No potential conflicts of interest were disclosed.
Acknowledgments
Thanks are due to Catherine Riou and Valérie Olivier who were supported by the Canceropôle Grand Ouest, for their help in collecting the clinical informations and to Stéphanie Deshayes and Charlotte Laot for their experimental support. We are grateful to Geneviève Michel and Simone Forest for their secretarial assistance and to Jean-Marc Serme and Wesley H. Brooks for their editorial assistance.
Additional information
Funding
Related Research Data
References
- Forconi F, Potter KN, Wheatley I, Darzentas N, Sozzi E, Stamatopoulos K, Mockridge CI, Packham G, Stevenson FK. The normal IGHV1-69-derived B-cell repertoire contains stereotypic patterns characteristic of unmutated CLL. Blood. 2010;115:71–77. doi:10.1182/blood-2009-06-225813.
- Chiorazzi N, Ferrarini M. Cellular origin(s) of chronic lymphocytic leukemia: cautionary notes and additional considerations and possibilities. Blood. 2011;117:1781–1791. doi:10.1182/blood-2010-07-155663.
- Seifert M, Sellmann L, Bloehdorn J, Wein F, Stilgenbauer S, Durig J, Kuppers R. Cellular origin and pathophysiology of chronic lymphocytic leukemia. J Exp Med. 2012;209:2183–2198. doi:10.1084/jem.20120833.
- Klein U, Tu Y, Stolovitzky GA, Mattioli M, Cattoretti G, Husson H, Freedman A, Inghirami G, Cro L, Baldini L, et al. Gene expression profiling of B cell chronic lymphocytic leukemia reveals a homogeneous phenotype related to memory B cells. J Exp Med. 2001;194:1625–1638.
- Forconi F, Moss P. Perturbation of the normal immune system in patients with CLL. Blood. 2015;126:573–581. doi:10.1182/blood-2015-03-567388.
- Scrivener S, Goddard RV, Kaminski ER, Prentice AG. Abnormal T-cell function in B-cell chronic lymphocytic leukaemia. Leuk Lymphoma. 2003;44:383–389. doi:10.1080/1042819021000029993.
- Tinhofer I, Marschitz I, Kos M, Henn T, Egle A, Villunger A, Greil R. Differential sensitivity of CD4+ and CD8+ T lymphocytes to the killing efficacy of Fas (Apo-1/CD95) ligand+ tumor cells in B chronic lymphocytic leukemia. Blood. 1998;91:4273–4281.
- Jadidi-Niaragh F, Yousefi M, Memarian A, Hojjat-Farsangi M, Khoshnoodi J, Razavi SM, Jeddi-Tehrani M, Shokri F. Increased frequency of CD8+ and CD4+ regulatory T cells in chronic lymphocytic leukemia: association with disease progression. Cancer Invest. 2013;31:121–131. doi:10.3109/07357907.2012.756110.
- Lemoine S, Morva A, Youinou P, Jamin C. Regulatory B cells in autoimmune diseases: how do they work? Ann N Y Acad Sci. 2009;1173:260–267. doi:10.1111/j.1749-6632.2009.04651.x.
- Jamin C, Morva A, Lemoine S, Daridon C, de Mendoza AR, Youinou P. Regulatory B lymphocytes in humans: a potential role in autoimmunity. Arthritis Rheum. 2008;58:1900–1906. doi:10.1002/art.23487.
- Fillatreau S. Novel regulatory functions for Toll-like receptor-activated B cells during intracellular bacterial infection. Immunol Rev. 2011;240:52–71. doi:10.1111/j.1600-065X.2010.00991.x.
- Smits HH. B cells in allergic diseases: bad or better? Autoimmunity. 2012;45:415–426. doi:10.3109/08916934.2012.665525.
- Gorosito Serran M, Fiocca Vernengo F, Beccaria CG, Acosta Rodriguez EV, Montes CL, Gruppi A. The regulatory role of B cells in autoimmunity, infections and cancer: perspectives beyond IL10 production. FEBS Lett. 2015;589:3362–3369. doi:10.1016/j.febslet.2015.08.048.
- Zhang Y, Gallastegui N, Rosenblatt JD. Regulatory B cells in anti-tumor immunity. Int Immunol. 2015;27:521–530. doi:10.1093/intimm/dxv034.
- Ray A, Wang L, Dittel BN. IL-10-independent regulatory B-cell subsets and mechanisms of action. Int Immunol. 2015;27:531–536. doi:10.1093/intimm/dxv033.
- Mauri C, Bosma A. Immune regulatory function of B cells. Annu Rev Immunol. 2012;30:221–241. doi:10.1146/annurev-immunol-020711-074934.
- Yanaba K, Bouaziz JD, Matsushita T, Tsubata T, Tedder TF. The development and function of regulatory B cells expressing IL-10 (B10 cells) requires antigen receptor diversity and TLR signals. J Immunol. 2009;182:7459–7472. doi:10.4049/jimmunol.0900270.
- Iwata Y, Matsushita T, Horikawa M, Dilillo DJ, Yanaba K, Venturi GM, Szabolcs PM, Bernstein SH, Magro CM, Williams AD, et al. Characterization of a rare IL-10-competent B-cell subset in humans that parallels mouse regulatory B10 cells. Blood. 2011;117:530–541. doi:10.1182/blood-2010-07-294249.
- Tedder TF. B10 cells: A functionally defined regulatory B cell subset. J Immunol. 2015;194:1395–1401. doi:10.4049/jimmunol.1401329.
- Matsushita T, Horikawa M, Iwata Y, Tedder TF. Regulatory B cells (B10 cells) and regulatory T cells have independent roles in controlling experimental autoimmune encephalomyelitis initiation and late-phase immunopathogenesis. J Immunol. 2010;185:2240–2252. doi:10.4049/jimmunol.1001307.
- Yoshizaki A, Miyagaki T, DiLillo DJ, Matsushita T, Horikawa M, Kountikov EI, Spolski R, Poe JC, Leonard WJ, Tedder TF. Regulatory B cells control T-cell autoimmunity through IL-21-dependent cognate interactions. Nature. 2012;491:264–268. doi:10.1038/nature11501.
- Lemoine S, Morva A, Youinou P, Jamin C. Human T cells induce their own regulation through activation of B cells. J Autoimmun. 2011;36:228–238. doi:10.1016/j.jaut.2011.01.005.
- Morva A, Lemoine S, Achour A, Pers JO, Youinou P, Jamin C. Maturation and function of human dendritic cells are regulated by B lymphocytes. Blood. 2012;119:106–114. doi:10.1182/blood-2011-06-360768.
- Nouel A, Pochard P, Simon Q, Segalen I, Le Meur Y, Pers JO, Hillion S. B-Cells induce regulatory T cells through TGF-beta/IDO production in A CTLA-4 dependent manner. J Autoimmun. 2015;59:53–60. doi:10.1016/j.jaut.2015.02.004.
- DiLillo DJ, Weinberg JB, Yoshizaki A, Horikawa M, Bryant JM, Iwata Y, Matsushita T, Matta KM, Chen Y, Venturi GM, et al. Chronic lymphocytic leukemia and regulatory B cells share IL-10 competence and immunosuppressive function. Leukemia. 2013;27:170–182. doi:10.1038/leu.2012.165.
- Coelho V, Krysov S, Steele A, Sanchez Hidalgo M, Johnson PW, Chana PS, Packham G, Stevenson FK, Forconi F. Identification in CLL of circulating intraclonal subgroups with varying B-cell receptor expression and function. Blood. 2013;122:2664–2672. doi:10.1182/blood-2013-02-485425.
- Rossi M, Gentile M, Toscano R, Recchia AG, Bossio S, Caruso N, De Stefano L, Granata T, Pellicano M, Vigna E, et al. Enumeration of interleukin-10-positive B cells from peripheral blood of patients with chronic lymphocytic leukemia. Leuk Lymphoma. 2014;55:1394–1396. doi:10.3109/10428194.2013.824078.
- Buhmann R, Nolte A, Westhaus (D), Emmerich B, Hallek M. CD40-activated B-cell chronic lymphocytic leukemia cells for tumor immunotherapy: stimulation of allogeneic versus autologous T cells generates different types of effector cells. Blood. 1999;93:1992–2002.
- Piper KP, Karanth M, McLarnon A, Kalk E, Khan N, Murray J, Pratt G, Moss PA. Chronic lymphocytic leukaemia cells drive the global CD4+ T cell repertoire towards a regulatory phenotype and leads to the accumulation of CD4+ forkhead box P3+ T cells. Clin Exp Immunol. 2011;166:154–163. doi:10.1111/j.1365-2249.2011.04466.x.
- Nouel A, Segalen I, Jamin C, Doucet L, Caillard S, Renaudineau Y, Pers JO, Le Meur Y, Hillion S. B cells display an abnormal distribution and an impaired suppressive function in patients with chronic antibody-mediated rejection. Kidney Int. 2014;85:590–599. doi:10.1038/ki.2013.457.
- Mohr A, Renaudineau Y, Bagacean C, Pers J-O, Jamin C, Bordron A. Regulatory B lymphocyte functions should be considered in chronic lymphocytic leukemia. Oncoimmunology. 2016;5:e1132977. doi:10.1080/2162402X.2015.1132977.
- Collins RJ, Verschuer LA, Harmon BV, Prentice RL, Pope JH, Kerr JF. Spontaneous programmed death (apoptosis) of B-chronic lymphocytic leukaemia cells following their culture in vitro. Br J Haematol. 1989;71:343–350.
- Wu J, Xu X, Lee EJ, Shull AY, Pei L, Awan F, Wang X, Choi JH, Deng L, Xin HB, et al. Phenotypic alteration of CD8+ T cells in chronic lymphocytic leukemia is associated with epigenetic reprogramming. Oncotarget. 2016;7:40558–40570. doi:10.18632/oncotarget.9941.
- Matutes E, Owusu-Ankomah K, Morilla R, Garcia Marco J, Houlihan A, Que TH, Catovsky D. The immunological profile of B-cell disorders and proposal of a scoring system for the diagnosis of CLL. Leukemia. 1994;8:1640–1645.
- Moreau EJ, Matutes E, A’Hern RP, Morilla AM, Morilla RM, Owusu-Ankomah KA, Seon BK, Catovsky D. Improvement of the chronic lymphocytic leukemia scoring system with the monoclonal antibody SN8 (CD79b). Am J Clin Pathol. 1997;108:378–382.
- Pflug N, Bahlo J, Shanafelt TD, Eichhorst BF, Bergmann MA, Elter T, Bauer K, Malchau G, Rabe KG, Stilgenbauer S, et al. Development of a comprehensive prognostic index for patients with chronic lymphocytic leukemia. Blood. 2014;124:49–62. doi:10.1182/blood-2014-02-556399.
- Olkhanud PB, Damdinsuren B, Bodogai M, Gress RE, Sen R, Wejksza K, Malchinkhuu E, Wersto RP, Biragyn A. Tumor-evoked regulatory B cells promote breast cancer metastasis by converting resting CD4(+) T cells to T-regulatory cells. Cancer Res. 2011;71:3505–3515. doi:10.1158/0008-5472.CAN-10-4316.
- Qin Z, Richter G, Schuler T, Ibe S, Cao X, Blankenstein T. B cells inhibit induction of T cell-dependent tumor immunity. Nat Med. 1998;4:627–630.
- Yanaba K, Bouaziz JD, Haas KM, Poe JC, Fujimoto M, Tedder TF. A regulatory B cell subset with a unique CD1dhiCD5+ phenotype controls T cell-dependent inflammatory responses. Immunity. 2008;28:639–650. doi:10.1016/j.immuni.2008.03.017.
- Ray A, Basu S, Williams CB, Salzman NH, Dittel BN. A novel IL-10-independent regulatory role for B cells in suppressing autoimmunity by maintenance of regulatory T cells via GITR ligand. J Immunol. 2012;188:3188–3198. doi:10.4049/jimmunol.1103354.
- Jahrsdorfer B, Muhlenhoff L, Blackwell SE, Wagner M, Poeck H, Hartmann E, Jox R, Giese T, Emmerich B, Endres S, et al. B-cell lymphomas differ in their responsiveness to CpG oligodeoxynucleotides. Clin Cancer Res. 2005;11:1490–1499. doi:10.1158/1078-0432.CCR-04-1890.
- Decker T, Schneller F, Hipp S, Miething C, Jahn T, Duyster J, Peschel C. Cell cycle progression of chronic lymphocytic leukemia cells is controlled by cyclin D2, cyclin D3, cyclin-dependent kinase (cdk) 4 and the cdk inhibitor p27. Leukemia. 2002;16:327–334. doi:10.1038/sj.leu.2402389.
- Jahrsdorfer B, Wooldridge JE, Blackwell SE, Taylor CM, Griffith TS, Link BK, Weiner GJ. Immunostimulatory oligodeoxynucleotides induce apoptosis of B cell chronic lymphocytic leukemia cells. J Leukoc Biol. 2005;77:378–387. doi:10.1189/jlb.0604373.
- Longo PG, Laurenti L, Gobessi S, Petlickovski A, Pelosi M, Chiusolo P, Sica S, Leone G, Efremov DG. The Akt signaling pathway determines the different proliferative capacity of chronic lymphocytic leukemia B-cells from patients with progressive and stable disease. Leukemia. 2007;21:110–120. doi:10.1038/sj.leu.2404417.
- Morbach H, Schickel JN, Cunningham-Rundles C, Conley ME, Reisli I, Franco JL, Meffre E. CD19 controls Toll-like receptor 9 responses in human B cells. J Allergy Clin Immunol. 2016;137:889–98 e6. doi:10.1016/j.jaci.2015.08.040.
- Ginaldi L, De Martinis M, Matutes E, Farahat N, Morilla R, Catovsky D. Levels of expression of CD19 and CD20 in chronic B cell leukaemias. J Clin Pathol. 1998;51:364–369.
- Huh YO, Schweighofer CD, Ketterling RP, Knudson RA, Vega F, Kim JE, Luthra R, Keating MJ, Medeiros LJ, Abruzzo LV. Chronic lymphocytic leukemia with t(14;19)(q32;q13) is characterized by atypical morphologic and immunophenotypic features and distinctive genetic features. Am J Clin Pathol. 2011;135:686–696. doi:10.1309/AJCPOEFP3SLX6HXJ.
- Laytragoon-Lewin N, Duhony E, Bai XF, Mellstedt H. Downregulation of the CD95 receptor and defect CD40-mediated signal transduction in B-chronic lymphocytic leukemia cells. Eur J Haematol. 1998;61:266–271.
- Livak KJ, Schmittgen TD. Analysis of relative gene expression data using real-time quantitative PCR and the 2(-Delta Delta C(T)) Method. Methods. 2001;25:402–408. doi:10.1006/meth.2001.1262.
- van Dongen JJ, Langerak AW, Bruggemann M, Evans PA, Hummel M, Lavender FL, Delabesse E, Davi F, Schuuring E, Garcia-Sanz R, et al. Design and standardization of PCR primers and protocols for detection of clonal immunoglobulin and T-cell receptor gene recombinations in suspect lymphoproliferations: report of the BIOMED-2 Concerted Action BMH4-CT98-3936. Leukemia. 2003;17:2257–2317. doi:10.1038/sj.leu.2403202.
- Alamyar E, Duroux P, Lefranc MP, Giudicelli V. IMGT((R)) tools for the nucleotide analysis of immunoglobulin (IG) and T cell receptor (TR) V-(D)-J repertoires, polymorphisms, and IG mutations: IMGT/V-QUEST and IMGT/HighV-QUEST for NGS. Methods Mol Biol. 2012;882:569–604. doi:10.1007/978-1-61779-842-9_32.