
ABSTRACT
The self-immunopeptidome is the repertoire of all self-peptides that can be presented by the combination of MHC variants carried by an individual, defined by their HLA genotype. Each MHC variant presents a distinct set of self-peptides, and the number of peptides in a set is variable. Subjects carrying MHC variants that present fewer self-peptides should also present fewer mutated peptides, resulting in decreased immune pressure on tumor cells. To explore this, we predicted peptide-MHC binding values using all unique 8-11mer human peptides in the human proteome and all available HLA class I allelic variants, for a total of 134 billion unique peptide--MHC binding predictions. From these predictions, we observe that most peptides are able to be presented by relatively few (< 250) MHC, while some can be presented by upwards of 1,500 different MHC. There is substantial overlap among the repertoires of peptides presented by different MHC and no relationship between the number of peptides presented and HLA population frequency. Nearly 30% of self-peptides are presentable by at least one MHC, leaving 70% of the human peptidome unsurveyed by T cells. We observed similar distributions of predicted self-immunopeptidome sizes in cancer subjects compared to controls, and within the pan-cancer population, predicted self-immunopeptidome size combined with mutational load to predict survival. Self-immunopeptidome analysis revealed evidence for tumor immunoediting and identified specific peptide positions that most influence immunogenicity. Because self-immunopeptidome size is defined by HLA genotypes and approximates neoantigen load, HLA genotyping could offer a rapid predictive biomarker for response to immunotherapy.
Introduction
The Major Histocompatibility Complex (MHC) is encoded by the genes of the Human Leukocyte Antigen (HLA) locus. HLA genes show high allelic variation, resulting in MHC molecules that have different peptide binding preferences, mainly due to variation at anchor positions within the MHC binding groove.Citation1 We define a self-immunopeptidome as the repertoire of all self-peptides that can be presented by the specific combination of class I MHC variants carried by an individual. For a given cell, only a subset of the entire possible self-immunopeptidome is presented dependent on the transcriptional profile of that cell type. A self-immunopeptidome is highly personalized, depending on the specific HLA genotype of an individual. Some individuals have large self-immunopeptidomes able to present a wide range of peptides, whereas other individuals will have small self-immunopeptidomes, presenting a more limited set of peptides.
Tumor neoantigens are mutated self-peptides presented by tumor cell MHC molecules, and are capable of eliciting anti-cancer T cell responses.Citation2–Citation8 In principle, individuals with large self-immunopeptidomes should be more able to present a diversity of neoantigens (due to a general increased ability to present peptides) and these individuals may, therefore, be better able to mount natural immune responses to control malignant cell growth. Indeed, there is evidence for improved response to cancer immunotherapies for individuals having higher diversity of their class I HLA loci.Citation9 It is possible that individuals with smaller self-immunopeptidomes would be more vulnerable to immune threats such as cancer and/or infectious disease. In the context of immune surveillance of cancer, it has been observed that in individuals with cancer, mutations that are poorly presented across a range of MHC occur at higher frequencies than mutations that are readily presented by many MHC,Citation10 suggesting that tumor cells can exploit gaps in the self-immunopeptidome, and that individuals with smaller self-immunopeptidomes will have greater cancer risk.
Here, we measured the range of self-immunopeptidome sizes present in human cohorts by predicting, computationally, the fraction of the human proteome able to be presented by each class I MHC molecule. These predictions are designed to provide a relative measure of how well each MHC molecule presents human peptides, utilizing all peptides in the canonical human reference proteome. Notably, these predictions do not include information such as expression level in different cell types, antigen processing requirements, or non-canonical peptides derived from proteasomal splicing.Citation11,Citation12 By performing this exhaustive computation up-front, we were then able to query the results for any given individual with a known HLA class I genotype to predict the overall size of their self-immunopeptidome. Our analysis of The Cancer Genome Atlas (TCGA) data revealed a small but statistically significant decrease in size of predicted self-immunopeptidomes for cancer subjects compared to non-cancer subjects. We also explored the phenomenon of immune-editingCitation13 by predicting the immunogenicity of mutations. Here, immunogenicity of a mutation is defined by the number of mutant peptide-MHC pairs (neoantigens) containing the mutation that are predicted to bind MHC-I with IC50 < 500 nM. We compared the immunogenicity of mutations found in cancer subjects to sets of matched in silico generated mutations. By this approach we identified the amino acid positions in peptide epitopes that have the strongest influence on immunogenicity.
Results
Exhaustive binding prediction of all self-peptides to MHC-I
The complete human reference proteome was downloaded from EMBL-EBI, containing 21,006 protein and 71,173 additional isoform sequences. Typically, class I MHC peptides are restricted to 8-11mer peptides due to the closed ends of the MHC binding groove.Citation14 As such, all possible 8-11mer peptides were extracted from this reference sequence using a sliding window, yielding over 146,000,000 peptides, of which 46,029,730 are unique. For each of the 46,029,730 unique 8-11mer peptides we predicted binding to each of 2,915 HLA class I alleles available in NetMHCpan v3.0. Executing these 134,176,662,950 binding predictions required over 110 CPU years of compute (see Methods) and provides a new predicted human immunopeptidome resource. We tested whether an IC50- or rank-based threshold would better represent the number of observed MHC-eluted peptides using mass spectrometry (MS) data (see Methods: Selecting the most suitable binding prediction threshold). For 66 MHC alleles with Human peptide data available from SysteMHC AtlasCitation15 MS data, we compared the number of unique peptides predicted to bind using the two thresholds to the number of peptides observed to bind these MHC using MS data. By Spearman’s rank correlation, thresholding by IC50 yielded a better correlation to the observed peptide data than thresholding by rank (IC50 ρ = 0.558, p = 1.1 × 10⁻⁶, Supplementary Figure 1; Rank ρ = 0.314, p = 0.010). Importantly, this demonstrates that the number of predicted self-peptides as defined by IC50 < 500 nM correlates with observed experimental data. We filtered the output to include the 987,968,036 pMHCs (0.7 % of all combinations tested) that had predicted IC50 < 500 nM and this set was used to calculate predicted self-immunopeptidome sizes. The results of this compute are now made available for researchers, obviating the need for these computational predictions to be repeated (http://doi.org/10.5281/zenodo.1453418).
MHC frequency in NetMHCpan training data correlates weakly with peptide presentation properties
As HLA alleles with greater representation in the NetMHCpan training data likely have more reliable binding predictions, we computed the correlation between the fraction of all unique human peptides presented by an MHC and the number of datapoints for the HLA allele encoding that MHC variant in the NetMHCpan training data (http://tools.immuneepitope.org/static/main/binding_data_2013.zip, summarized in Supplementary Table 1). We observed a weak correlation between the fraction of all unique human peptides predicted to be presented by an MHC and the number of datapoints in the training data (Spearman ρ = 0.388, p = 5.5 × 10⁻⁵). We saw no difference in the fraction of all unique human peptides presented by an MHC for MHC included in the training data vs. those with no training data (p = 0.1185, T test). To further address peptide- binding prediction reliability for HLA alleles lacking training data, we used the SysteMHC Atlas MS data to determine the number of distinct MHC-eluted peptides identified by MS that were also identified via self-immunopeptidome predictions, for alleles that are or are not present in the NetMHCpan training data (Supplementary Figure 2). The proportion of MS-observed peptides predicted by self-immunopeptidome analysis is not significantly different for alleles that are in the NetMHCpan training data (mean ± SD: 0.619 ± 0.24, n = 42) compared to alleles not present in the training data (0.511 ± 0.21, n = 24; p = 0.061, T test). This demonstrates that potential bias from training of the peptide- binding predictions is not a significant factor when predicting the self-immunopeptidome. Extending this analysis, we compared the identities of self-peptides predicted to be presented by each of six cell lines (taking into account the class I HLA types of each cell line) to the peptides identified directly by MS and reported in the SysteMHC Atlas (Supplementary Figure 3). This analysis shows that, on average, 81.6 % of peptides observed by MS analysis are predicted by the self-immunopeptidome analysis. The predicted self-immunopeptidome includes many additional peptides not observed by MS analysis because the self-immunopeptidome analysis included the entire proteome, whereas only a subset of the proteome will be expressed within a specific cell line. Additionally, MS analysis has limited sensitivity and does not provide an exhaustive view of the peptides present on the surface of the cell. Further discrepancies between the observed and predicted peptidomes may be derived from non-canonical proteasome-spliced peptides (discussed above) or polymorphisms present in these cell lines.
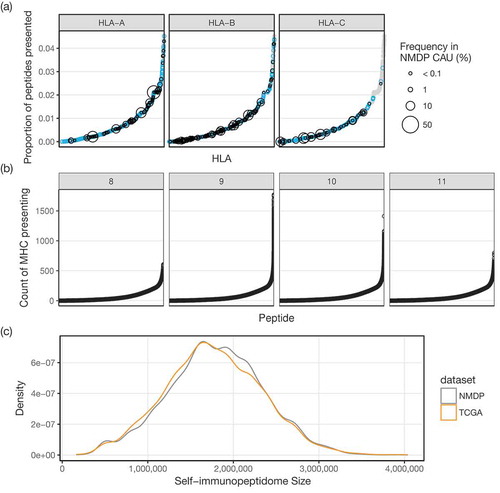
As a separate test, we checked for any effect that HLA population frequency may have on the size of predicted self-immunopeptidomes. This was done using the 330 HLA alleles with non-zero population frequencies in the USA National Marrow Donor Program (NMDP) Caucasian dataset from http://www.allelefrequencies.net,Citation16 selected as most ethnicities within the TCGA dataset are Caucasian. We observed no significant correlation between population frequency and fraction of unique peptides presented (Spearman ρ = −0.096, p = 0.082). For single MHC molecules, fractions of unique peptides ranged from 0.0 % (HLA-B*15:137) to 4.5 % (HLA-A*02:229) of all 8-11mer self-peptides ()). Within the set of all peptides comprising the predicted human immunopeptidome, most peptides are able to be presented by relatively few (< 250) MHC, while some can be presented by upwards of 1,500 different MHC ()). Taking all 2,915 MHC together, 29.7 % of all 8-11mer self-peptides are predicted to be presented, showing that there is significant overlap between the repertoire of peptides presented by different MHC. Additionally, these comprehensive peptide-MHC binding predictions suggest, within the limits of the accuracy of these predictions, that over 70 % of the human peptidome is unable to be presented by MHC and is not surveyed (nor naturally tolerized) by T cells.
Figure 1. (a) Fraction of the human peptidome predicted to be presented by each of 2,915 class I MHC. MHC are plotted along the x-axis in increasing fraction (y-axis). Gray points are all MHC combined, and the overlaid blue points identify those from the specific gene (HLA-A, -B, or -C) in each panel. Black circles show the population frequency, when available, of that allele in the USA NMDP Caucasian dataset. (b) Number of MHC predicted to present each presented peptide. Peptides are plotted along the x-axis in increasing numbers of MHC (y-axis), with each peptide length in separate panels (8mer: n = 1,522,052, 9mer: n = 4,667,489, 10mer: n = 4,704,530, 11mer: n = 2,790,531). (c) Distribution of predicted self-immunopeptidome sizes from NMDP and TCGA. Density plot showing the relative frequency (y-axis) of predicted self-immunopeptidomes of varying sizes (x-axis). TCGA (orange) subjects, on average, have smaller predicted self-immunopeptidomes than NMDP (gray) donors.
The distribution of predicted self-immunopeptidome sizes are similar between cancer and non-cancer datasets
The self-immunopeptidome presented by any individual is dependent on the up to six different class I HLA alleles encoded by their genome. We define the self-immunopeptidome size for an individual to be the size of the (possibly) overlapping sets of distinct 8-11mer peptides predicted to be presented by each of their MHC-I. To compare the distribution of predicted self-immunopeptidome sizes for individuals with cancer compared to those without, we used data from TCGACitation17 and the NMDP.Citation18
We obtained class I HLA types for the TCGA dataset, predicted using OptiTypeCitation19 as part of “The Immune Landscape of Cancer”,Citation17 and for the NMDP datasetCitation18 where typing was done by PCR- and amplicon sequencing-based techniques. As most ethnicities in the TCGA dataset are Caucasian, and to control for potential confounding effects of varying allele usage in different ethnicities, we filtered the TCGA and NMDP data to exclude non-Caucasian subjects for this analysis only. The resulting distributions of predicted self-immunopeptidome sizes for both TCGA and NMDP datasets are shown in ) (TCGA 1,767,986 ± 561,474 (mean ± SD), n = 6,415; NMDP 1,797,092 ± 553,010 (mean ± SD), n = 7,867). Predicted self-immunopeptidome sizes for TCGA are slightly smaller than the NMDP distribution (p = 1.9 × 10⁻³, two sample T test), though the distributions are not distinct enough to have any practical utility in predicting if an unknown subject would belong to either group.
In cancer, predicted self-immunopeptidome size correlates with predicted neoantigen load and progression free interval
Despite there being only a small difference in predicted self-immunopeptidome size between cancer and non-cancer datasets, predicted self-immunopeptidome size may have a clinically relevant effect within the cancer dataset. We hypothesized that in TCGA, individuals with larger self-immunopeptidomes would have improved outcomes due to there being a higher probability of mutations in these tumors generating neoantigens.
As SNV neoantigen data from TCGA was calculated as the number of pMHC containing a mutated amino acid,Citation17 we can combine the coding SNV mutational load and predicted self-immunopeptidome size in these subjects to approximate their SNV neoantigen load. If we express the predicted self-immunopeptidome size as a fraction of all unique peptides that are presented by that genotype, and multiply this by the coding SNV mutational load to get an approximated SNV neoantigen load, we observe a strong positive correlation between approximated SNV neoantigen load and TCGA SNV neoantigen load (Pearson r = 0.987, p < 2.2 × 10⁻¹⁶). This result suggests that using a combination of coding mutational load and predicted self-immunopeptidome size together, as approximated SNV neoantigen load, could be very useful as an indicator of tumor immunogenicity because it does not require exhaustive neoantigen predictions to be performed.
To test the utility of predicted self-immunopeptidome size as a measure of tumor immunogenicity in a pan-cancer context, we performed Cox proportional hazard survival analysis on the TCGA data using progression free intervals as the endpoint.Citation20 In a multivariate Cox-PH model containing race, age, gender and cancer type as covariates, increases in predicted self-immunopeptidome size alone did not significantly decrease the hazard rate, (HR = 0.930 for an increase in predicted self-immunopeptidome size of 1 million peptides, p = 0.082, 95% CI: 0.856–1.001; details of full model in Supplementary Table 2). However, when switching the predictor from predicted self-immunopeptidome size to the approximated SNV neoantigen load described above, a significant protective effect is observed (HR = 0.995, p = 3.2 × 10⁻³, 95% CI: 0.991–0.998; details of full model in Supplementary Table 3). We obtain comparable results when using either the comprehensive TCGA SNV neoantigen load or number of coding SNV mutations (Supplementary Tables 4 and 5) and observe that these models all fit the data equally well (AIC = 25,348.62 using coding SNV count; AIC = 25,347.65 using approximated SNV neoantigen load; 25,349.47 using comprehensive TCGA SNV neoantigen load), demonstrating that in the context of outcomes, predicted self-immunopeptidome size and mutational load combine to provide the same clinical information obtained by comprehensive neoantigen predictions.
Differential patterns of peptide presentation derived from in vivo and in silico mutations are consistent with immunoediting
We hypothesized that evidence of immune surveillance and immune evasion would be detectable by comparing pMHCs derived from TCGA SNVs to pMHCs originating from in silico generated random mutations which have not undergone immunoediting. For every TCGA subject, we used the predicted SNV neoantigens from above.Citation17 Then, we generated a matched set of in silico coding SNVs (with amino predicted pMHCs from these in silico SNVs. As expected, there is a high correlation between the number of TCGA and in silico mutant pMHCs per subject (Pearson r = 0.999, p < 2.2 × 10⁻¹⁶), as these were derived from the same number of starting mutations and the same set of HLA alleles. We further stratified the TCGA predicted pMHCs by the expression of the source mutation. For each of 5,748 TCGA subjects that we have RNA-seq data for, we classified each of the 1,181,367 coding SNVs as expressed if there were at least 3 sequence reads containing the variant base. We identified evidence of expression for 417,335 (35 %) of these coding SNVs.
To investigate the effect of immune editing in the TCGA subjects, we compared the predicted immunogenicity of expressed SNVs, non-expressed SNVs, and random in silico generated SNVs. Predicted immunogenicity was calculated as the number of neoantigens per SNV. Within each subject, potential neoantigens are defined as the subset of the up to 38 peptides (all 8-11mers containing the variant) × up to 6 HLA alleles = up to 228 peptide-MHC pairs that are predicted to bind. Importantly, every SNV may generate zero or a few neoantigens. We hypothesized that there would be fewer neoantigens per expressed TCGA SNVs (lower predicted immunogenicity) because this pool would have been depleted by neoantigen-reactive T cells. Indeed, we observed fewer neoantigens per expressed SNV compared to both in silico and non-expressed SNVs (); p < 2.2 × 10⁻¹⁶, paired T tests), and more neoantigens per non-expressed TCGA SNV than per random SNV (); p = 1.9 × 10⁻¹⁴, paired T test). When looking at each cancer site individually, the trend of more neoantigens per non-expressed SNV and fewer neoantigens per expressed SNV was maintained for all cancer sites except LIHC, CESC, BLCA, and SKCM (Supplementary Figure 5). It should be noted that unlike other TCGA cancer sites, the majority of SKCM samples are from lymph node metastasis,Citation20 and as such they represent tumors at a different stage of development and with biased immune cell content compared to the rest of the dataset.
Figure 2. (a) Boxplots for the average immunogenicity (neoantigens per SNV; y-axis) per subject for non-expressed, in silico, and expressed SNVs (x-axis). Colored lines showing the average number of neoantigens per SNV for each cancer type are overlaid. Outliers above a threshold of 5 neoantigens per SNV are omitted from plot to simplify the display. (b) Scatterplot showing direct comparison of the number of neoantigens per expressed (x-axis) or non-expressed (y-axis) SNV. Colored lines show the locally weighted average neoantigens per non-expressed SNV (LOESS) for each cancer type across x-axis values. Orange dashed line separates subjects predicted to have suppressed immune response (right of line, pink shade, n = 956) from those with a normal (i.e. non-suppressed) immune response (left of line, n = 4,792). Plot zoomed in to show bulk of the data – 55 outliers of the 5,748 total data points fall outside of this window. (c) Survival curves showing the effect of evidence of normal immune response (blue) compared to suppressed immune response (red), adjusted for the effect of covariates from the Cox proportional hazards multivariate model.
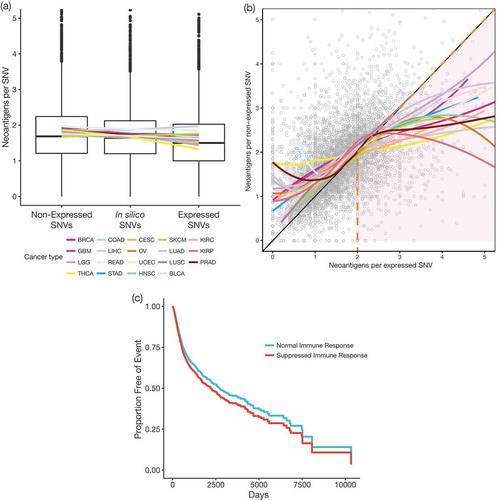
Directly comparing numbers of neoantigens per SNV from expressed and non-expressed SNVs in each TCGA subject, we observe that the general trend of more neoantigens per non-expressed SNV (as shown in )) appears to reverse for samples that have greater than two neoantigens per expressed SNV ()). One interpretation of this observation is that tumors with higher numbers of neoantigens per expressed SNV have been able to retain more expressed neoantigens because they have suppressed the immune response by mechanisms such as an immunosuppressive microenvironment or downregulation of MHC. To explore this further, we classified samples as having a suppressed immune response if they met the following criteria: (1) they have more neoantigens per expressed SNV than neoantigens per non-expressed SNV, and (2) they have greater than two neoantigens per expressed SNV. Survival analysis comparing these two groups supports this notion ()), with the samples having a putatively suppressed immune response showing decreased PFI (HR = 1.138, p = 0.027, 95% CI = 1.015–1.275; multivariate Cox-PH model with cancer type, age, race and gender as covariates).
Relative depletion of variants in MHC-binding anchor positions of peptide epitopes identify potentially immunogenic positions
We were interested in whether different amino acid positions within neoantigens show different signatures of immunogenicity. Given that expressed mutations from TCGA exist within established tumors and coexist with the host immune system, neoantigens originating from these mutations were not immunogenic enough to result in tumor eradication within these subjects. One factor that may influence immunogenicity is the position within the presented peptide that the variant resides.Citation21 We investigated whether there was a bias in the usage of positions within the peptide for the variant amino acid for neoantigens from expressed TCGA variants compared to random, in silico generated mutations. We noted that an important factor to consider is whether, for each neoantigenic peptide, the corresponding wildtype peptide is also predicted to bind to the same MHC. If the wildtype peptide is also presented, this would be expected to result in T cell tolerance to the wildtype peptide and may highlight certain amino acid positions as being relevant to breaking or taking advantage of this pre-existing tolerance when mutated. To investigate this, we looked up wildtype pMHC binding scores for all expressed TCGA and in silico mutations in our predicted human immunopeptidome dataset. All analysis was performed on the set of neoantigens where both the mutant and matched wildtype peptides were predicted to bind.
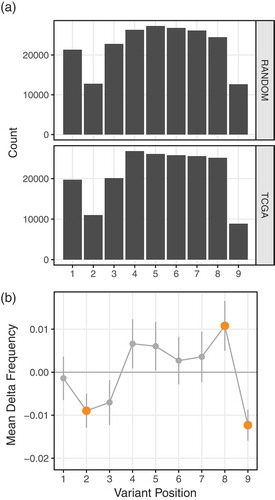
We limited our analysis to 9mers, which are the most common peptide length and have the most well-defined MHC-binding interactions.Citation22 Looking at neoantigens derived from random, in silico generated mutations, we observe fewer variants at positions 2 and 9 of these neoantigens compared to the other positions when the corresponding wildtype peptide also binds the MHC (); top panel). This is expected, as these positions are the most influential on peptide-MHC binding and most likely to confer loss of MHC binding when mutated;Citation23 these are the two canonical MHC-binding anchor positions. This trend is recapitulated in the neoantigens derived from expressed TCGA mutations (); bottom panel), confirming that this effect is intrinsic to peptide-MHC binding and not an artifact of in silico mutagenesis. Ignoring wildtype binding status yields a uniform distribution across the possible variant positions (Supplementary Figure 6).
Figure 3. (a) Counts of neoantigens containing the variant at each position within the peptide. Variants occur in positions 2 and 9 at the lowest frequency. This trend is consistent for both random in silico derived mutations (top panel) and TCGA-derived mutations (bottom panel). (b) Differences in frequency (y-axis) of the variant amino acid being in each position (x-axis) of a presented peptide for TCGA mutations compared to random mutations. Mean values are shown (points), with lines showing 95% confidence intervals of the means. Positions with significant enrichment or depletion (padj < 0.05, T test) are displayed larger and colored orange. Only data for 9mers shown; 189,057 TCGA neoantigens and 200,688 in silico neoantigens for 5,482 subjects.
To control for this non-uniform distribution of variant position usage, we directly compared the frequency that each position is being used in the TCGA and in silico datasets. Positions which are relatively depleted of mutations in the expressed TCGA dataset relative to the random in silico dataset may be the result of immune editing during tumor development, deleting cells which carry mutations at these positions. Similarly, positions which are relatively enriched in the TCGA dataset may be non-immunogenic, being able to persist while co-existing with the host immune system. To identify positions that have an enrichment or depletion of mutations in the TCGA dataset relative to the random in silico mutation dataset, we first converted the raw count of neoantigens with variants at each position into the frequency that each variant position is used within each subject’s neoantigen repertoire. For each subject, we then calculated the difference in frequencies at each position between the TCGA and random in silico derived mutations, and tested, over the entire dataset, whether these differences were statistically significant.
We observed a significant depletion of position 2 and 9 variants in TCGA neoantigen data compared to the in silico-derived neoantigens ()). Note that these positions held the lowest number of mutations in both datasets because we limited the data to cases where the wildtype and mutant versions are both predicted to bind, and mutations at these positions will typically impair peptide-MHC binding. However, mutations at positions 2 and 9 do not always result in loss of binding, and in some cases can even increase binding affinity.Citation24 Therefore, the relative depletion of TCGA position 2 and 9 variants relative to in silico variants may be due to enhancement of immunogenicity conferred by these mutations as a result of improved peptide-MHC binding stability,Citation25,Citation26 or from changes to the peptide conformation within the MHC binding groove. It is well established that subtle changes to peptide conformation can have large effects on T cell reactivity,Citation27,Citation28 exposing regions of the peptide to the TCR that were previously concealed. Conversely, we observe a relative enrichment of TCGA position 8 (so called anchor-adjacent) variants, suggesting changes here are tolerated because they do not increase immunogenicity ()). Features of this general trend of depletion at the anchors and enrichment just interior to the anchors is seen across all peptide lengths (Supplementary Figure 7). In the context of overcoming existing T cell tolerance to wildtype peptides, these data suggest that, counterintuitively, variants at anchor positions are the most immunogenic and are selected against during tumor development.
Discussion
We performed exhaustive binding predictions between every unique 8-11mer peptide that exists in the reference human proteome to nearly 3,000 MHC molecules available for prediction – generating, to our knowledge, the largest set of peptide-MHC binding predictions to date, and which can now serve as a community resource. This resource supported the fast and efficient characterization of thousands of individuals from TCGA and NMDP for their predicted ability to present self-peptides. It is important to note that these predictions ignore protein expression and abundance in different cell types, antigen processing requirements, epitope destruction, and issues such as proteasome-generated spliced peptides that might represent a substantial component of the self-immunopeptidome.Citation11,Citation12 Currently, it is not possible to perform our predicted self-immunopeptidome analysis for these spliced peptides as there are no algorithms to predict their occurrence nor are there well annotated databases of those that exist.
Individuals with cancer from TCGA have marginally smaller predicted self-immunopeptidomes compared to non-cancer NMDP individuals. More importantly, within the TCGA dataset having larger predicted self-immunopeptidomes correlates with better outcomes. This supports previous findings of an HLA-effect on survival.Citation9,Citation29,Citation30 Additionally, predicted self-immunopeptidome size and mutational load combine to approximate the neoantigen load, and this strongly correlates with the actual predicted neoantigen load (based on personalized binding predictions of all mutant peptides to MHC), supporting the potential utility of approximated neoantigen load as a clinical metric in assessing the immunogenicity of tumors without the need to perform more exhaustive neoantigen predictions. This approach may also facilitate the calculation of approximated neoantigen loads in subjects from all mutation types, not limited to SNVs, without the additional neoantigen prediction processing required for more complex mutation types.
Immunoediting is a well accepted phenomenon that occurs during cancer development.Citation31 By comparing observed mutations from immune-exposed TCGA tumors to in silico generated mutations, we were able to detect signals of immune-evasion within the TCGA data. It is important to note that our in silico mutations are random and do not necessarily confer the same cancer growth advantage, or in fact any biological relevance, that is likely found in the set of TCGA mutations and thus are used as a measure of baseline pMHC generation. Compared to in silico mutations, we observed a general trend of decreased immunogenicity for expressed TCGA mutations, and an increase for non-expressed mutations. This supports the view that the majority of TCGA tumors are immune-edited, as we see higher immunogenicity from non-expressed SNVs than would be expected by chance. This could be the result of immune-editing over time shaping the mutational profile of these cancer cells through accumulation of mutations that would be potentially immunogenic if expressed, but are immunologically inconsequential when present in non-expressed genes. Under this framework, we also identified samples that showed evidence of a suppressed immune response, permitting relatively more immunogenic mutations in expressed genes. These subjects demonstrate decreased progression free survival, supporting the concept that these individuals harbour tumours which have suppressed the natural immune response to the tumor.
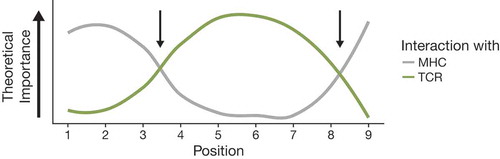
Given that highly immunogenic mutations could be rapidly recognized by the immune system and cancer cells containing these mutations would not survive, we assume that the mutations we see have decreased immunogenicity. By comparing the variant positions within the presented peptides to the positions containing the in silico mutations, we were able to identify positions which were depleted (more immunogenic) and enriched (less immunogenic). Immunogenic positions were canonical MHC binding positions, likely resulting in significant changes to the topography of the presented peptide and a greater likelihood of breaking T cell tolerance, or increasing the stability of the peptide-MHC complex.Citation21 Non-immunogenic positions were anchor-adjacent. Changes in anchor-adjacent positions may represent an optimization between effects on MHC-binding and visibility of the variant to the T cell receptor. This is supported by work describing positions important for MHC binding and T cell interaction,Citation21,Citation32–Citation34 summarized in . These observations on the relative importance of certain positions in influencing the immunogenicity of peptides may help refine epitope immunogenicity prediction algorithms.
Figure 4. Relative importance of positions in presented peptides for interactions with MHC (gray) and TCR (green) based on existing knowledge of immunogenicity in the literature. Two positions representing the minimization of effects on interactions with both MHC and TCR are denoted with arrows.
Our findings were generalizable across cancer types, with the identification of immune-edited tumours not being restricted to any one cancer type. Similar efforts to characterize different immune subtypes within TCGA have recently been undertaken.Citation17 Based on gene expression data, six immune subtypes were identified in TCGA tumours, described according to different immune pathways that are most active in each subtype. Across these TCGA immune subtypes, our measure of average mutation immunogenicity (neoantigens per expressed SNV) was smaller for subjects in the immunologically quiet (C5) cluster, though this may be due to a higher number of zero counts in this cluster due to a relative dearth of mutations.
Given the TCGA tumor samples were obtained pre-treatment, our measure of immunogenicity is relevant within the context of the natural immune response. These predictions and trends may not extend to cases where immunotherapies are used to modulate the immune response – pMHCs present in these immune-exposed samples which are assumed to be not naturally immunogenic may still form potent immune targets for immunotherapies. Future studies applying similar comparative approaches to the mutational landscapes of tumors before and after immunotherapy would be useful in identifying predictive measures of immunogenicity in these contexts.
Methods
Reference proteome
The human reference proteome was downloaded from EMBL-EBI (http://ftp.ebi.ac.uk/pub/databases/reference_proteomes/QfO/Eukaryota/UP000005640_9606.fasta.gz and http://ftp.ebi.ac.uk/pub/databases/reference_proteomes/QfO/Eukaryota/UP000005640_9606_additional.fasta.gz), using the April 2016 Qf0 release. This contained references for 21,006 protein sequences from the canonical set of proteins, plus 71,173 additional isoform sequences. These were combined for the complete analysis to ensure all unique peptides which exist in the human reference proteome were captured.
Condensing the proteome
Within the reference proteome, a specific 8-11mer peptide sequence may occur multiple times (non-unique peptides). To reduce the amount of computation required, we will only compute peptide-MHC binding for the set of unique 8-11mer peptides. All unique 8-11mer peptides were extracted from the complete proteome and written to a file. However, we determined that the compute time per peptide using NetMHCpan 3.0Citation22 is significantly sped up by providing NetMHCpan with longer protein sequences and having it automatically extract all n-mers by sliding window rather than providing each n-mer individually (two orders of magnitude, data not shown). To take advantage of this, we desired a set of amino acid sequences which, when parsed with a sliding window, only contain peptides from these unique sets, and only contain each peptide exactly once. To achieve this, we re-assembled all unique n-mers into sets of artificial protein sequences using the following greedy algorithm (in pseudocode):
for n in [8,9,10,11]:
start a set of artificial proteins Sn for peptides of length n;
for each unique peptide of length n:
if the first or last n-1 amino acids of the peptide matches the last or first n-1 amino acids of any artificial protein in Sn:
extend that artificial protein with the additional N- or C-terminal amino acid;
else:
start a new artificial protein in Sn with the peptide sequence;
end for;
end for;
This resulted in four sets of artificial protein sequences (one for each peptide length) containing each unique 8-11mer peptide exactly once when parsing with a sliding window. This shrunk the amino acid space required to be explored from the 36,688,307 amino acids of the reference × 4 peptide lengths = 146,753,228 total amino acids to 12,600,566 (for 8mers) + 12,635,023 (for 9mers) + 12,734,064 (for 10mers) + 12,835,955 (for 11mers) = 50,805,608 total amino acids (34 % of the reference).
Selecting the most suitable binding prediction threshold
Within the literature, multiple thresholds are used to classify pMHC binders using NetMHCpan algorithms.Citation22,Citation35–Citation37 The two most common thresholds to classify binders are a binding affinity threshold (IC50 < 500 nM), and a rank-based threshold (Percentile Rank < 2 %). While the most correct threshold is as-of-yet undiscovered, and likely will depend on the source of the data being used (self vs. mutated vs. infectious agent peptides), these two thresholds have been demonstrated to provide useful and informative results.Citation10,Citation38,Citation39 To determine which of these two thresholds would perform best for our purposes of estimating the size of the set of self-peptides presented by each class I MHC, we used publicly available mass-spectrometry (MS) data from SysteMHC Atlas.Citation15 All datasets containing Human peptide data in the context of MHC class I molecules were downloaded from systemhcatlas.org on February 7, 2018 (n = 194). These data comprised 66 MHC molecules (15 HLA-A, 34 HLA-B, 17 HLA-C) and 135,092 total pMHC interactions.
We performed binding predictions using NetMHCpan 3.0Citation22 for all unique 8-11mer peptides obtained from a 10% random subsample of the human proteome (proteins were randomly selected from the human proteome until 10% of the total human proteome length was achieved, results from this depth correlate strongly with those from the full dataset, data not shown) to all class I MHC molecules available for prediction. For each MHC, we tallied the number of pMHC by either the IC50 < 500 nM, or the Rank < 2 % threshold. For 66 MHC alleles with Human peptide data available from SysteMHC, we compared the number of unique peptides predicted to bind using the two thresholds to the number of peptides observed to bind these MHC using MS data.
By Spearman’s rank correlation, thresholding by IC50 yields a better correlation to the observed peptide data than thresholding by rank (IC50 ρ = 0.558, p = 1.1 × 10⁻⁶, Supplementary Figure 1; Rank ρ = 0.314, p = 0.010). To control for any effect that sample size might have in the SysteMHC data, we generated a linear model using either IC50- or Rank-based threshold counts to explain the observed peptide counts, with the number of samples in SysteMHC data for each MHC as a covariate. Using this model, we found the counts using the IC50-based threshold to be a better predictor of the number of in vivo presented peptides (IC50 adjusted R2 = 0.686; Rank adjusted R2 = 0.591). Therefore, we used the IC50 < 500 nM threshold to predict pMHC binding.
Running peptide-MHC binding predictions
Calls to NetMHCpan were batched into sets of approximately 1,000 artificial proteins and a single HLA and split into 1,676,125 separate jobs to run on a compute cluster. As the size of each artificial protein varied, proteins were sorted by length and then distributed across all jobs to ensure that on average each job had a similar number of total peptides to be predicted (and thus took a similar length of time to complete). On average, each job took 35 minutes, totaling over 110 CPU years to complete all predictions.
Comparing distributions of predicted self-immunopeptidome sizes
For a cancer dataset, we used HLA data from The Cancer Genome Atlas (TCGA)Citation17 Class I HLA calling was performed using OptiTypeCitation19 for 9,957 samples. For a non-cancer dataset, we obtained HLA genotypes from the National Marrow Donor Program (NMDP).Citation18 Class I HLA typing was performed using a mix of DNA and sequence-based techniques for 13,996 participants. For each individual, we calculated their predicted self-immunopeptidome size as the number of distinct peptides predicted to bind to their set of class I MHCs. To control for any effect from differing ethnicities skewing the frequencies of certain HLA alleles between the two datasets, we first restricted our data to the individuals with Caucasian ethnicity (TCGA n = 6,415, NMDP n = 7,867). We then tested if the two distributions were statistically different from each other by performing a T test.
Tallying mutations and neoantigens in TCGA
TCGA mutation information was tallied by Ellrott et al.Citation40 and downloaded from the Genomic Data Commons (GDC) (https://gdc.cancer.gov/about-data/publications/mc3-2017; id: 8b851024-2915-4d66-8a84-d03199b616fd; filename: mc3.v0.2.8.CONTROLLED.maf.gz). Class I HLA genotypes were performed by Thorsson et al.Citation17 and downloaded from the GDC (https://gdc.cancer.gov/about-data/publications/panimmune; id: cf05dd5-9653-497a-8c7e-45ba0d1d237a; filename: OptiTypeCallsHLA_20171207.tsv). pMHC predictions were performed as described in Thorsson et al.Citation17
Survival analysis in TCGA
TCGA clinical data was obtained from Liu et al.Citation20 Supplementary Table S1. Cox proportional hazard models were built using the survival package in R, using the progression free interval variable “PFI.1” from Liu et al.Citation20 Covariates in survival models were “age at initial pathologic diagnosis”, “gender”, “race”, and “cancer type”. Tumor stage was only available for a subset of cancer sites, so was excluded as a covariate from these pan-cancer survival models.
Comparing presentation of TCGA mutations (in vivo) to simulated mutations (in silico)
All non-synonymous SNVs from the TCGA mutation file were used, and the frequency of every possible amino acid change was tallied (Supplementary Figure 4). These amino acid change frequencies were then used to generate a pool of 50,000 random amino acid changes across the reference human proteome. First, 50,000 positions were randomly selected across the proteome. For each position, the reference amino acid was randomly mutated to a different amino acid using the measured amino acid change frequencies from the TCGA data. All peptides containing these mutations had pMHC predictions generated for all available HLA alleles (5,456,375,705 unique combinations), and results were stored in a database for querying.
For each TCGA subject, a random sample of the above simulated mutations was selected to match the size of the number of non-synonymous SNVs from that subject. Of these selected mutations, all pMHCs corresponding to this subset of random mutations and that TCGA subject’s specific HLA genotype were selected and tallied, acting as a matched, simulated pMHC repertoire.
Identification of expressed SNVs in TCGA
To determine if a TCGA SNV is expressed, we used the SamtoolsCitation41 v0.1.8 mpileup command to obtain all bases seen at the genomic coordinate of the SNV from the RNA-seq bam file of that subject. An SNV was classified as expressed if the mutated base was observed at least three times.
Measuring differences in variant position usage from TCGA pMHCs compared to in silico pMHCs
This analysis was performed for each peptide length separately. For each subject, we first enumerate the variant position usage within the peptides from TCGA pMHCs, and repeat this for the in silico pMHCs. For each subject, we then filter the data to retain positions which have at least one pMHC with the variant at that position from both the TCGA and in silico sets. We then calculate the frequency that each position is used by dividing the count of each position by the number of peptides of that length in the subject. We then calculate delta, the difference in these frequency values for the TCGA pMHCs compared to the in silico pMHCs. For each position, we perform a T test on these delta values to see if there is evidence that they are significantly different from zero. For visualization, we plot the mean of these delta values for each position, with bars showing the 95% confidence interval on the mean as reported by the T test. We use the Bonferroni correction to adjust the p-values for multiple testing.
Code and data availability
All custom code relating to the prediction of the self-immunopeptidome is available at https://github.com/scottdbrown/self-immunopeptidome_cancer/. The predicted human immunopeptidome dataset is available at http://doi.org/10.5281/zenodo.1453418.
Abbreviations
| UCEC | = | Uterine corpus endometrial carcinoma |
| THCA | = | Thyroid carcinoma |
| TCGA | = | The Cancer Genome Atlas |
| STAD | = | Stomach adenocarcinoma |
| SNV | = | Single Nucleotide Variant |
| SKCM | = | Skin cutaneous melanoma |
| SD | = | Standard Deviation |
| READ | = | Rectum adenocarcinoma |
| PRAD | = | Prostate adenocarcinoma |
| pMHC | = | Peptide-MHC |
| PFI | = | Progression Free Interval |
| OV | = | Ovarian serous cystadenocarcinoma |
| NMDP | = | National Marrow Donor Program |
| MS | = | Mass Spectrometry |
| MHC | = | Major Histocompatibility Complex |
| LUSC | = | Lung squamous cell carcinoma |
| LUAD | = | Lung adenocarcinoma |
| LIHC | = | Liver hepatocellular carcinoma |
| LGG | = | Brain lower grade glioma |
| KIRP | = | Kidney renal papillary cell carcinoma |
| KIRC | = | Kidney renal clear cell carcinoma |
| HR | = | Hazard Ratio |
| HNSC | = | Head and neck squamous cell carcinoma |
| HLA | = | Human Leukocyte Antigen |
| GBM | = | Glioblastoma multiform |
| Cox-PH | = | Cox proportional hazard |
| COAD | = | Colon adenocarcinoma |
| CI | = | Confidence Interval |
| CESC | = | Cervical squamous cell carcinoma and endocervical adenocarcinoma |
| BRCA | = | Breast invasive carcinoma |
| BLCA | = | Bladder urothelial carcinoma |
| AIC | = | Akaike Information Criteria |
Disclosure of Potential Conflicts of Interest
No potential conflicts of interest were disclosed.
Supplemental Material
Download MS Excel (10.5 KB)Supplemental Material
Download MS Word (979.3 KB)Acknowledgments
We thank NIH and the Cancer Genome Atlas Research Network for data access (study accession phs000178.v8.p7). The results published here are in part based upon data generated by The Cancer Genome Atlas managed by the NCI and NHGRI. Information about TCGA can be found at http://cancergenome.nih.gov. We also thank the National Marrow Donor Program (NMDP) for data access.
Supplementary material
Supplemental data for this article can be accessed on the publisher’s website.
Additional information
Funding
References
- Sette A, Sidney J. HLA supertypes and supermotifs: a functional perspective on HLA polymorphism. Curr Opin Immunol. 1998;10(4):478–482. doi:10.1016/S0952-7915(98)80124-6.
- Lennerz V, Fatho M, Gentilini C, Frye RA, Lifke A, Ferel D, Wölfel C, Huber C, Wölfel T. The response of autologous T cells to a human melanoma is dominated by mutated neoantigens. Proc Natl Acad Sci U S A. 2005;102(44):16013–16018. doi:10.1073/pnas.0500090102.
- Matsushita H, Vesely MD, Koboldt DC, Rickert CG, Uppaluri R, Magrini VJ, Arthur CD, White JM, Chen Y-S, Shea LK, et al. Cancer exome analysis reveals a T-cell-dependent mechanism of cancer immunoediting. Nature. 2012;482(7385):400–404. doi:10.1038/nature10755.
- Heemskerk B, Kvistborg P, Schumacher TNM. The cancer antigenome. Embo J. 2013;32(2):194–203. doi:10.1038/emboj.2012.333.
- Lu Y-C, Yao X, Li YF, El-Gamil M, Dudley ME, Yang JC, Almeida JR, Douek DC, Samuels Y, Rosenberg SA, et al. Mutated PPP1R3B is recognized by T cells used to treat a melanoma patient who experienced a durable complete tumor regression. J Immunol. 2013;190(12):6034–6042. doi:10.4049/jimmunol.1202830.
- Robbins PF, Lu Y-C, El-Gamil M, Li YF, Gross C, Gartner J, Lin JC, Teer JK, Cliften P, Tycksen E, et al. Mining exomic sequencing data to identify mutated antigens recognized by adoptively transferred tumor-reactive T cells. Nat Med. 2013;19(6):747–752. doi:10.1038/nm.3161.
- van Rooij N, van Buuren MM, Philips D, Velds A, Toebes M, Heemskerk B, Lja VD, Behjati S, Hilkmann H, El Atmioui D, et al. Tumor exome analysis reveals neoantigen-specific T-cell reactivity in an ipilimumab-responsive melanoma. J Clin Oncol. 2013;31(32):e439–42. doi:10.1200/JCO.2012.47.7521.
- Wick DA, Webb JR, Nielsen JS, Martin SD, Kroeger DR, Milne K, Castellarin M, Twumasi-Boateng K, Watson PH, Holt RA, et al. Surveillance of the tumor mutanome by T cells during progression from primary to recurrent ovarian cancer. Clin Cancer Res. 2014;20(5):1125–1134. doi:10.1158/1078-0432.CCR-13-2147.
- Chowell D, Morris LGT, Grigg CM, Weber JK, Samstein RM, Makarov V, Kuo F, Kendall SM, Requena D, Riaz N, et al. Patient HLA class I genotype influences cancer response to checkpoint blockade immunotherapy. Science. 2017 Dec 7;80:eaao4572.doi:10.1126/science.aao4572.
- Marty R, Kaabinejadian S, Rossell D, Slifker MJ, van de Haar J, Engin HB, de Prisco N, Ideker T, Hildebrand WH, Font-Burgada J, et al. MHC-I genotype restricts the oncogenic mutational landscape. Cell. 2017;171(6):1272–1283.e15. doi:10.1016/j.cell.2017.09.050.
- Liepe J, Marino F, Sidney J, Jeko A, Bunting DE, Sette A, Kloetzel PM, Stumpf MPH, Heck AJR, Mishto M. A large fraction of HLA class I ligands are proteasome-generated spliced peptides. Science. 2016;354(6310):354–358. doi:10.1126/science.aaf4384.
- Granados DP, Laumont CM, Thibault P, Perreault C. The nature of self for T cells-a systems-level perspective. Curr Opin Immunol. 2015;34:1–8. doi:10.1016/j.coi.2014.10.012.
- Schreiber RD, Old LJ, Smyth MJ. Cancer immunoediting: integrating immunity’s roles in cancer suppression and promotion. Science. 2011;331(6024):1565–1570. doi:10.1126/science.1203486.
- Eichmann M, de Ru A, van Veelen PA, Peakman M, Kronenberg-Versteeg D. Identification and characterisation of peptide binding motifs of six autoimmune disease-associated human leukocyte antigen-class I molecules including HLA-B*39:06. Tissue Antigens. 2014;84(4):378–388. doi:10.1111/tan.12413.
- Shao W, Pedrioli PGA, Wolski W, Scurtescu C, Schmid E, Vizcaíno JA, Courcelles M, Schuster H, Kowalewski D, Marino F, et al. The SysteMHC Atlas project. Nucleic Acids Res. 2018;46(D1):D1237–D1247. doi:10.1093/nar/gkx664.
- González-Galarza FF, Takeshita LYC, Santos EJM, Kempson F, Maia MHT, da Silva ALS, Teles e Silva AL, Ghattaoraya GS, Alfirevic A, Jones AR, et al. Allele frequency net 2015 update: new features for HLA epitopes, KIR and disease and HLA adverse drug reaction associations. Nucleic Acids Res. 2015;43(D1):D784–D788. doi:10.1093/nar/gku1166.
- Thorsson V, Gibbs DL, Brown SD, Wolf D, Bortone DS, Ou Yang TH, Porta-Pardo E, Gao GF, Plaisier CL, Eddy JA, et al. The immune landscape of cancer. Immunity. 2018;48(4):812–830.e14. doi:10.1016/j.immuni.2018.03.023.
- Gragert L, Madbouly A, Freeman J, Maiers M. Six-locus high resolution HLA haplotype frequencies derived from mixed-resolution DNA typing for the entire US donor registry. Hum Immunol. 2013;74(10):1313–1320. doi:10.1016/J.HUMIMM.2013.06.025.
- Szolek A, Schubert B, Mohr C, Sturm M, Feldhahn M, Kohlbacher O. OptiType: precision HLA typing from next-generation sequencing data. Bioinformatics. 2014;30(23):1–7. doi:10.1093/bioinformatics/btu548.
- Liu J, Lichtenberg TM, Hoadley KA, Poisson LM, Lazar AJ, Cherniack AD, Kovatich AJ, Benz CC, Levine DA, Lee AV, et al. An integrated TCGA pan-cancer clinical data resource to drive high-quality survival outcome analytics. Cell. 2018;173(2):400–416.e11. doi:10.1016/j.cell.2018.02.052.
- Calis JJA, Maybeno M, Greenbaum JA, Weiskopf D, De Silva AD, Sette A, Keşmir C, Peters B. Properties of MHC class I presented peptides that enhance immunogenicity. PLoS Comput Biol. 2013;9(10):e1003266. doi:10.1371/journal.pcbi.1003266.
- Nielsen M, Andreatta M. NetMHCpan-3.0; improved prediction of binding to MHC class I molecules integrating information from multiple receptor and peptide length datasets. Genome Med. 2016;8(1):33. doi:10.1186/s13073-016-0288-x.
- Lund O, Nielsen M, Kesmir C, Petersen AG, Lundegaard C, Worning P, Sylvester-Hvid C, Lamberth K, Roder G, Justesen S, et al. Definition of supertypes for HLA molecules using clustering of specificity matrices. Immunogenetics. 2004;55(12):797–810. doi:10.1007/s00251-004-0647-4.
- Bjerregaard A-M, Nielsen M, Jurtz V, Barra CM, Hadrup SR, Szallasi Z, Eklund AC. An analysis of natural T cell responses to predicted tumor neoepitopes. Front Immunol. 2017;8:1566. doi:10.3389/fimmu.2017.01566.
- Borbulevych OY, Baxter TK, Yu Z, Restifo NP, Baker BM. Increased immunogenicity of an anchor-modified tumor-associated antigen is due to the enhanced stability of the peptide/MHC complex: implications for vaccine design. J Immunol. 2005;174(8):4812–4820. doi:10.4049/JIMMUNOL.174.8.4812.
- Harndahl M, Rasmussen M, Roder G, Dalgaard Pedersen I, Sørensen M, Nielsen M, Buus S. Peptide-MHC class I stability is a better predictor than peptide affinity of CTL immunogenicity. Eur J Immunol. 2012;42(6):1405–1416. doi:10.1002/eji.201141774.
- Degano M, Garcia KC, Apostolopoulos V, Rudolph MG, Teyton L, Wilson IA. A functional hot spot for antigen recognition in a superagonist TCR/MHC complex. Immunity. 2000;12(3):251–261.
- Sharma AK, Kuhns JJ, Yan S, Friedline RH, Long B, Tisch R, Collins EJ. Class I major histocompatibility complex anchor substitutions alter the conformation of T cell receptor contacts. J Biol Chem. 2001;276(24):21443–21449. doi:10.1074/jbc.M010791200.
- Tsukahara T, Kawaguchi S, Torigoe T, Asanuma H, Nakazawa E, Shimozawa K, Nabeta Y, Kimura S, Kaya M, Nagoya S, et al. Prognostic significance of HLA class I expression in osteosarcoma defined by anti-pan HLA class I monoclonal antibody, EMR8–5. Cancer Sci. 2006;97(12):1374–1380. doi:10.1111/j.1349-7006.2006.00317.x.
- Bijen CBM, Bantema-Joppe EJ, de Jong RA, Leffers N, Mourits MJE, Eggink HF, van der Zee AGJ, Hollema H, de Bock GH, Nijman HW. The prognostic role of classical and nonclassical MHC class I expression in endometrial cancer. Int J Cancer. 2010;126(6):1417–1427. doi:10.1002/ijc.24852.
- Dunn GP, Bruce AT, Ikeda H, Old LJ, Schreiber RD. Cancer immunoediting: from immunosurveillance to tumor escape. Nat Immunol. 2002;3(11):991–998. doi:10.1038/ni1102-991.
- Frankild S, de Boer RJ, Lund O, Nielsen M, Kesmir C. Amino acid similarity accounts for T cell cross-reactivity and for “Holes” in the T cell repertoire Zhang L, editor. PLoS ONE. 2008;3(3):e1831. doi:10.1371/journal.pone.0001831.
- Yadav M, Jhunjhunwala S, Phung QT, Lupardus P, Tanguay J, Bumbaca S, Franci C, Cheung TK, Fritsche J, Weinschenk T, et al. Predicting immunogenic tumour mutations by combining mass spectrometry and exome sequencing. Nature. 2014;515(7528):572–576. doi:10.1038/nature14001.
- Bristol JA, Schlom J, Abrams SI. Development of a murine mutant ras CD8+ CTL peptide epitope variant that possesses enhanced MHC class I binding and immunogenic properties. J Immunol. 1998;160:2433–2441.
- Kim Y, Sidney J, Buus SS, Sette A, Nielsen M, Peters B. Dataset size and composition impact the reliability of performance benchmarks for peptide-MHC binding predictions. BMC Bioinformatics. 2014;15(1):241. doi:10.1186/1471-2105-15-241.
- Paul S, Weiskopf D, Angelo MA, Sidney J, Peters B, Sette A. HLA class I alleles are associated with peptide-binding repertoires of different size, affinity, and immunogenicity. J Immunol. 2013;191(12):5831–5839. doi:10.4049/jimmunol.1302101.
- Sette A, Vitiello A, Reherman B, Fowler P, Nayersina R, Kast WM, Melief CJ, Oseroff C, Yuan L, Ruppert J, et al. The relationship between class I binding affinity and immunogenicity of potential cytotoxic T cell epitopes. J Immunol. 1994;153(12):5586–5592.
- Brown SD, Warren RL, Gibb EA, Martin SD, Spinelli JJ, Nelson BH, Holt RA. Neo-antigens predicted by tumor genome meta-analysis correlate with increased patient survival. Genome Res. 2014;24(5):743–750. doi:10.1101/gr.165985.113.
- Rooney MS, Shukla SA, Wu CJ, Getz G, Hacohen N. Molecular and genetic properties of tumors associated with local immune cytolytic activity. Cell. 2015;160(1–2):48–61. doi:10.1016/j.cell.2014.12.033.
- Ellrott K, Bailey MH, Saksena G, Covington KR, Kandoth C, Stewart C, Hess J, Ma S, Chiotti KE, McLellan MD, et al. Scalable open science approach for mutation calling of tumor exomes using multiple genomic pipelines. Cell Syst. 2018;6(3):271–281.e7. doi:10.1016/j.cels.2018.03.002.
- Li H, Handsaker B, Wysoker A, Fennell T, Ruan J, Homer N, Marth G, Abecasis G, Durbin R. The sequence alignment/map format and SAMtools. Bioinformatics. 2009;25(16):2078–2079. doi:10.1093/bioinformatics/btp352.