
ABSTRACT
Background: Interferon treatment, as an important approach of anti-tumor immunotherapy, has been implemented in multiple clinical trials of glioma. However, only a small number of gliomas benefit from it. Therefore, it is necessary to investigate the clinical role of interferons and to establish robust biomarkers to facilitate its application.
Materials and methods: This study reviewed 1,241 glioblastoma (GBM) and 1,068 lower grade glioma (LGG) patients from six glioma cohorts. The transcription matrix and clinical information were analyzed using R software, GraphPad Prism 7 and Medcalc, etc. Immunohistochemical (IHC) staining were performed for validation in protein level.
Results: Interferon signaling was significantly enhanced in GBM. An interferon signature was developed based on five interferon genes with prognostic significance, which could reflect various interferon statuses. Survival analysis showed the signature could serve as an unfavorable prognostic factor independently. We also established a nomogram model integrating the risk signature into traditional prognostic factors, which increased the validity of survival prediction. Moreover, high-risk group conferred resistance to chemotherapy and high IFNB1 expression levels. Functional analysis showed that the high-risk group was associated with overloaded immune response. Microenvironment analysis and IHC staining found that high-risk group occupied a disorganized microenvironment which was characterized by an enrichment of M0 macrophages and neutrophils, but less infiltration of activated nature killing (NK) cells and M1 type macrophages.
Conclusion: This interferon signature was an independent indicator for unfavorable prognosis and showed great potential for screening out patients who will benefit from chemotherapy and interferon treatment.
Introduction
Glioblastoma (GBM) is the most common and lethal type of tumor of the central nervous system.Citation1 Even after standard intervention, GBM patients still suffer a median survival time of only 14 months. Traditionally, GBM is characterized by uncontrolled proliferation, an invasive nature, and activated angiogenesis. Recent studies highlighted immune disorder as a key driver facilitating GBM malignancy.Citation2 Our team found that overloaded immune response and disorganized immune microenvironment contribute to GBM’s poor outcome and treatment resistance.Citation3–Citation6 Interferons are termed as one of the most important families regulating the immune response, which are involved in activating antigen presenting cells and enhancing cytolytic function of effector cells. To date, interferon treatment has been implemented widely in clinical trials of glioma; however, only a subset of patients have benefited from it.Citation7–Citation9 This situation may result from the controversy in interferons clinical value for glioma. Some evidence suggests that interferons play an antitumor role in glioma by facilitating immunological surveillance, enhancing temozolomide sensitivity and prohibiting angiogenesis.Citation10–Citation12 However, other studies indicated that autocrine activation of the interferon signaling pathways promotes immune escape and leads to a multigenic resistance to immune checkpoint blockades in GBM.Citation13,Citation14 Thus, it is urgent to explore the clinical role of interferons in glioma and establish a reliable biomarker to facilitate its application.
Increasing evidence has suggested that interferon-related genes could serve as biomarkers to predict patients’ prognosis and response to interferon treatment.Citation15–Citation20 The availability of large-scale gene expression datasets brings the opportunity to develop and validate robust gene signatures. In this study, we profiled the status of interferon signaling in gliomas. An interferon signature was developed to stratify GBMs into high or low-risk groups with poor prognosis. Patients in the high-risk group are more likely to be resistant to chemotherapy and to interferon-beta treatment. Therefore, this project clarified the clinical role of interferons in GBM and established a signature, which may provide novel references for the usage of interferons in the clinical situation.
Results
Profiling of interferon signaling identified an interferon signature for GBM
To evaluate the differences in interferon signaling between LGG and GBM, we performed gene set variation analysis (GSVA) based on a series of interferon-related biological processes. The results showed their enrichment were significantly elevated in GBM, indicating GBM was characterized with an enhanced interferon phenotype (Supplementary Fig. S1A). To explore the clinical role of interferon status in GBM, an interferon gene set containing 132 genes was summarized in Supplementary Table S1.Citation21–Citation24 Univariate cox regression analysis was performed to investigate the prognostic role of these genes. Suppressor of cytokine signaling 3 (SOCS3), interferon-stimulated exonuclease gene 20 (ISG20), interferon-induced protein with tetratricopeptide repeats 5 (IFIT5), NLR family CARD domain containing 5 (NLRC5) and interferon regulatory factor 9 (IRF9) were identified as associated with overall survival of GBM patients (Supplementary Table S1). Among these five genes, SOCS3 and ISG20 were defined as risky genes with a hazard ratio (HR) > 1, whereas, IFIT5, NLRC5, and IRF9 were defined as protective genes with and HR < 1. Then, we established a risk model based on these five genes’ expression levels and their regression coefficients of univariate cox regression analysis as follows: Risk score = (0.1730 × SOCS3 expression) + (0.2370 × ISG20 expression) + (−0.4303 × IFIT5 expression) + (−0.2914 × NLRC5 expression) + (−0.2829 × IRF9 expression). The risk signature was used to classify patients into low or high-risk groups based on its median value.
To test the association between this signature and interferon status, principal components analysis (PCA) based on interferon-related genes were performed. The results showed a different distribution pattern between high and low-risk groups, which indicated that these two groups may have distinct interferon statuses (Supplementary Fig. S1B). We further conducted gene set enrichment analysis (GSEA) based on interferon-related terms and showed that these terms were highly enriched in the high-risk group (Supplementary Fig. S1C, D). These findings suggested that this signature correlated with interferon phenotypes and that the high-risk group possessed an activated interferon signaling status.
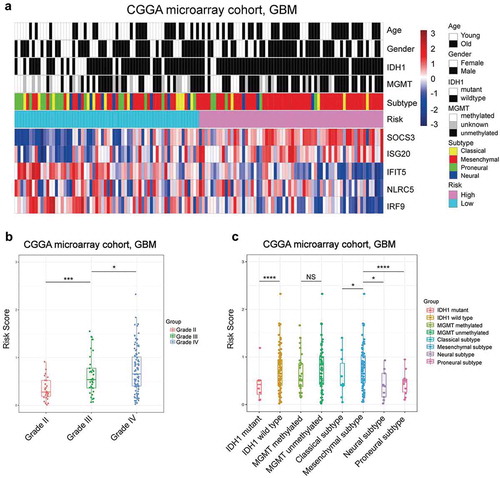
As interferon signaling was more highly enriched in GBM than LGG, we compared our interferon signature among World Health Organization (WHO) grades of the Chinese Glioma Genome Atlas (CGGA) microarray cohort. As expected, the risk score was significantly elevated along with glioma progression (). Then, we ranked GBM patients according to their risk score to visualize its association with clinical parameters. We found that higher risk indicated older patients, wild-type isocitrate dehydrogenase 1 (IDH1) and mesenchymal subtype (). The above results were confirmed in other validated cohorts (Supplementary Fig. S2), and the finding that risk score correlated with glioma’s grade was assured in protein levels by using IHC staining (Supplementary Fig. S3A). These 50 patients’ clinical information and IHC score of five prognostical genes were summarized in Supplementary Table S2. These findings suggested that the interferon-related prognostic risk was associated with several unfavorable clinical features.
Figure 1. The distribution pattern of the interferon signature in the CGGA microarray cohort. A, The expression pattern of the signature’s five genes with other clinical characteristics. B, The risk score was elevated significantly in higher grade gliomas. C, The higher risk patients were specifically enriched in the IDH1 wild type and mesenchymal subtype in GBM. (* means P < 0.05, ** means P < 0.01, *** means P < 0.001, **** means P < .0001).
The interferon signature is a robust prognostic indicator
To estimate the prognostic value of this interferon signature, we utilized the risk formula in discovery and validation cohorts, and stratified patients based on their median value. In discovery cohorts, we found the patients in the high-risk group had a shorter overall survival than those in the low-risk group (median OS = 363 vs 551 days; P < 0.0001; ). Furthermore, survival analyses in validation cohorts indicated that the survival time was significantly reduced in the high-risk group compared to that of the low-risk group (). In addition, we evaluated the correlation between the risk score and GBM patients’ survival according to our hospital’s data, and the result confirmed that high-risk score was significantly associated with worse overall survival in GBM patients (Supplementary Fig. S3B). The interferon signature was applied in LGG to explore its applicability. We found that high-risk patients also suffered reduced survival compared with low-risk LGG patients (Supplementary Fig. S3C–F), indicating this interferon signature was suitable for both LGG and GBM.
Figure 2. Prognostic value of the interferon signature in GBM. A, The high-risk group exhibited an unfavorable prognosis in GBM of CGGA microarray cohort. In the other five validation cohorts, there was also a significantly shorter survival times in the high-risk group compared with those patients in the low-risk group (B–F). High-risk group patients occupied a significantly reduced overall survival compared with low-risk group patients when stratified by age (G and H), KPS (I and J), IDH1 mutation status (K and L) and MGMT promoter status (M and N) in CGGA microarray cohort.
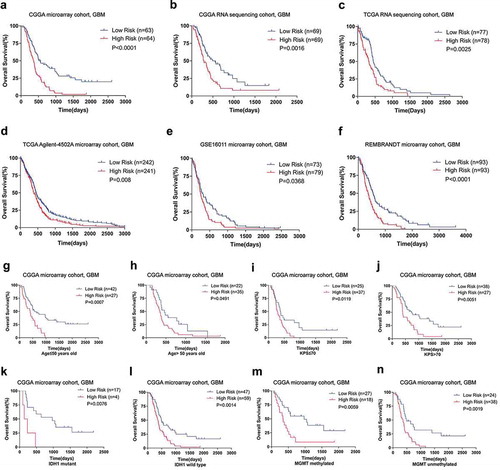
Next, we performed stratified survival analyses to test the prognostic significance of interferon signature as a categorical variable. GBM patients were stratified according to several clinicopathologic features, including age, karnofsky performance score (KPS), methylguanine methyltransferase (MGMT) promoter methylation and IDH1 mutation. In the discovery cohort, high-risk GBMs suffered worse prognosis than their low-risk counterpart (. In validation cohorts, survival analyses showed that the high-risk group survived significantly or statistical marginally shorter than the low-risk group (Supplementary Table S3). Additionally, to assess whether the interferon signature was independently correlated with survival time as a continuous variable, univariate and further multivariate cox analyses were performed. We found that the interferon signature was an independent prognostic indicator when adjusted for age, KPS, radiotherapy, and chemotherapy (). At the same time, the risk signature remained prognostic independently in most of the validation cohorts (Supplementary Table S4). These findings suggested that the interferon signature was a robust prognostic factor.
Table 1. Cox regression analysis of CGGA microarray cohort, GBM.
The interferon signature precisely predicts survival time
To estimate the validity of interferon signature in predicting survival time, we depicted receiver operating characteristic (ROC) curves based on 2- and 3-year survival and then calculated the area under curve (AUC). The results showed that the signature was more accurate in predicting 2-year survival (AUC = 0.781) and 3-year survival (AUC = 0.771) than traditional clinical parameters in discovery cohort (Supplementary Fig. S4A–B). The interferon-related signature also exhibited a well predictability for survival in internal and external validated cohorts (Supplementary Table S5).
Subsequently, we developed a nomogram in discovery cohort to achieve better translational and predictive potential (Supplementary Fig. S4C). The C-index of the nomogram was 0.704, which was significantly higher than its constituting factors (Supplementary Fig. S4D). The calibration plot exhibited high agreement between predicted and actual probability of 1, 2 and 3 years survival (Supplementary Fig. S4E). In validation cohorts, the nomogram showed highly predictive validity (Supplementary Table S6). These results suggested that the interferon-related signature is instructive for predicting GBM survival time.
High risk indicates chemotherapy resistance
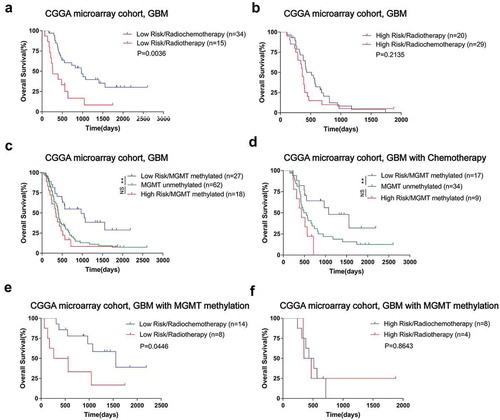
To explore the association between interferon relevant risk and treatment response, we conducted survival analysis under various treatment conditions in CGGA microarray cohort. In low-risk groups, patients with radio-chemotherapy survived significantly longer than those patients who received radiation alone (). However, the combined treatment’s superiority was impaired in the high-risk group (). MGMT promoter methylation is well established for implying better prognosis and chemotherapy sensitivity in GBM.Citation25 We further conducted survival analysis based on interferon signature, MGMT promoter status and treatment conditions. For all GBM patients or who received chemotherapy, MGMT promoter methylated patients with lower interferon-related risk had a survival advantage over the unmethylated patients. Moreover, the prognosis of MGMT promoter-methylated patients with a high-risk score was similar to that of unmethylated patients (). This situation prompted a further evaluation to clarify the value of this signature in predicting treatment response. We found that among MGMT promoter methylated GBM patients, those who with low interferon-related risk could benefit from additional chemotherapy (). Similar results were obtained in the TCGA sequencing cohort for validation (Supplementary Fig. S5). These results indicated that high-risk patients were resistant to chemotherapy even with a methylated MGMT promoter.
Figure 3. The risk signature mediated chemotherapy resistance in GBM of CGGA microarray cohort. A, For low-risk group, the patients with radio-chemotherapy survived significantly longer than those patients who received radiation alone. B, High-risk group patients did not benefit well from adjuvant chemotherapy. For all GBM patients who received chemotherapy, only the MGMT promoter methylated patients with a low-risk score had a survival advantage over the unmethylated ones; survival time of MGMT promoter-methylated patients with a high-risk score was similar to that of unmethylated patients (C and D). In GBMs with methylated MGMT promoters, only patients with a low-risk score benefited from chemotherapy (E and F). (* means P < 0.05, ** means P < 0.01, *** means P < 0.001, **** means P < 0.0001).
The high-risk group exhibits enhanced immune response and aggressive phenotypes
To investigate differential biological features between the low and high-risk groups of CGGA microarray cohort, we screened out differentially expressed genes with a criterion of log fold change (FC) > 1.5 and adjusted P value < 0.05. The results of gene ontology (GO) and Kyoto encyclopedia of genes and genomes (KEGG) analysis showed that the most relevant biological processes in the high-risk group were immune response processes, vasculature development and several classical oncogenic pathways (). To further confirm the relationship between these GO terms with the risk signature, we conducted GSVA based on more than 5000 terms and selected the results with adjusted P value < 0.0001 (Supplementary Table S7). We found that immune relevant processes were generally enriched in the high-risk group as expected, such as the chemotaxis of several kinds of immune cells and the responses they mediated. The high-risk group also showed a robust correlation with angiogenesis and other oncogenic pathways ().
Figure 4. The low and high-risk groups of CGGA microarray cohort exhibited different immune status and biological process. A, GO analysis based on up-regulated genes correlated with the high risk group. B, GSVA results showed that immune relevant processes and some oncogenic pathways were most significantly enriched in the high risk group. GSEA results showed that there was a positive enrichment of two immune related terms in the high risk group (C and D). PCA results exhibited that the low risk and high risk groups were generally distributed in different directions based on immune related genes (E).
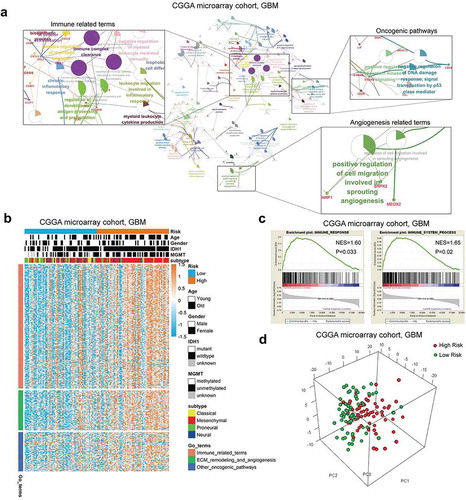
We conducted GSEA of two main immune relevant terms, “Immune Response” and “Immune Process”, with the results showing that there was a positive enrichment of these two terms in the high-risk group (). Furthermore, we conducted PCA based on immune-related genes (gene sets obtained from “Immune Response” and “Immune Process” go terms). The results exhibited that the low risk and high-risk groups were generally distributed in different directions, which may suggest that these groups exhibited different immune statuses (). In addition, the same analyses were conducted in internal and external validation cohorts, and the similar results were observed (Supplementary Fig. S6 and Fig. S7). These results indicated that the high-risk group was biologically characterized by an enhanced immune response.
As increasing evidence suggested that tumor neo-antigen load and mutation load exert critical role in driving immune response and infiltration,Citation26,Citation27 the Cancer Genome Atlas (TCGA) patients with available mutation and neo-antigen information were reviewed. There were no significantly differences in total mutations and neo-antigens between high and low-risk groups (Supplementary Fig. S8 A–B). Cancer-testis (CT) antigens were termed as another potential source of tumor antigens, which were aberrantly expressed in tumors and elicited an antigen-specific response. We summarized a set of CT genes according to Rooney’s study and compared their expression pattern between high and low-risk groups, but there were no differences as most of CT genes were down-regulated in GBM patients (Supplementary Fig. S8C). These results indicated that various antigen statuses had only a moderate influence on interferon-related prognostic risk.
The high-risk group conferred a disorganized immune microenvironment
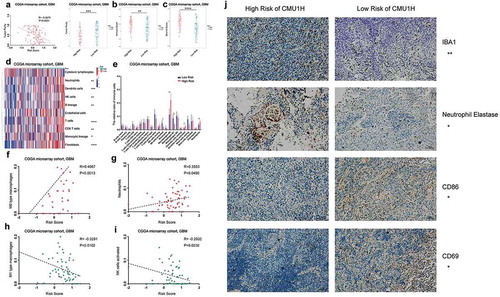
To clarify the relationship between interferon signature and microenvironment composition, we calculated the cellular proportion using ESTIMATE, Microenvironment Cell Populations-counter (MCP-counter) and CIBERSORT algorithms in CGGA microarray cohort. The results suggested that a significant negative correlation existed between the tumor purity and the risk score (). Enrichments of immune and stromal cells were observed in high-risk patients (). The results showed that several types of immune cells had distinct infiltration statuses between various risk groups, high-risk group accompanied with an enrichment of M0 macrophages and neutrophils, but less infiltration of activated NK cells and M1 type macrophages (). Correlation analyses confirmed that interferon signature positively correlated with M0 macrophages and neutrophils and negatively correlated with M1 macrophages and activated NK cells (). The same analyses were conducted in internal and external validation cohort, and the similar results were observed (Supplementary Fig. S9). Moreover, we selected antibody IBA1 to detect macrophage, anti-neutrophil elastase to statin neutrophil, anti-CD86 to evaluate M1 polarized macrophage and anti-CD69 to reflect the amount of activated NK cell based on 30 GBM samples.Citation5,Citation28,Citation29 The results showed that high-risk GBM patients exhibited significantly stronger staining of macrophage and neutrophil markers, but less M1 polarized macrophage and activated NK cell, which was consistent with CIBERSORT results ( AND Supplementary Fig. S9E). And the detail German immunohistochemical score (GIS) information of immune-related markers in 30 GBM samples had summarized in Supplementary Table S8.
Figure 5. The relationship between the interferon signature with the glioma microenvironment. A, There was a significantly negative correlation between the tumor purity and the risk score. The high-risk group occupied a higher immune score and stromal score (B and C). MCP analysis showed there was an extreme enrichment of immune and stromal cell in the high-risk group (D). CIBERSORT results showed that the high-risk group was associated with more macrophages and neutrophils; while activated NK cells and M1 type macrophages were enriched in low-risk group (E). Positive correlations exist between risk score and M0 macrophages as well as neutrophils (F and G), while the risk score showed a negative correlation with M1 macrophages and activated NK cells (H and I). J, IHC staining confirmed the CIBERSORT analysis results. (A-I were performed in CGGA microarray cohort; J was conducted in the First Hospital of China Medical University; * means P < 0.05, ** means P < 0.01, *** means P < 0.001, **** means P < 0.0001).
As the classical co-inhibitory immune checkpoints exert critical immune suppression in GBM, we investigated the correlation between our signature and several immune checkpoints. The results showed a robust positive correlation between them(Supplementary Fig. S10A). There were also positive correlations between the risk score and immune risk factors which were identified in our previous study,Citation6 while the risk score exhibited a robust negative correlation with those protective factors (Supplementary Fig. S10B). We further collected a series of immune inhibitory genes in GBM from our previous study and from the research of Doucette T et al.Citation6,Citation30 and found most of these genes were enriched in the high-risk group (Supplementary Fig. S10C). In conclusion, there is a more complicated and unfavorable immune environment in high-risk group, which indicates a more difficult challenge in the clinical intervention of this subgroup patients.
IFNB1 has distinct therapeutic implications between high and low-risk group
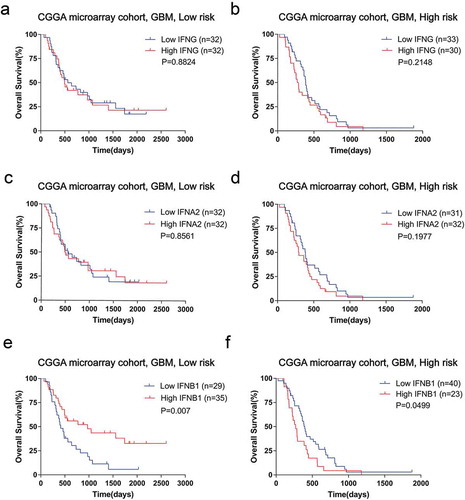
Identification of patients who will benefit from interferon treatment is urgently needed to facilitate its clinical application. To mimic the response to interferon treatment, we explored the prognostic role of important interferons (IFNA2, IFNB1, and IFNG) in the high and low-risk groups of CGGA microarray cohort (). Patients stratified by IFNG or IFNA2 had similar prognosis between the low and high-risk groups (). Notably, with regards to IFNB1, its overexpression indicated a survival benefit in the low-risk group (). However, in the high-risk group, patients with high levels of IFNB1 suffered a significantly reduced survival than their low expression counterparts (). A similar tendency could be confirmed in validation cohorts (Supplementary Fig. S11). Therefore, the interferon signature could predict response to interferon therapy and low-risk patients may obtain therapeutic effect from interferon-beta treatment.
Figure 6. Survival analyses stratified by interferon showed heterogeneity between low and high-risk group of CGGA microarray cohort. There were no significant survival differences in the low or high risk groups when stratified by IFNG (A and B) or IFNA2(C and D). E, In the low-risk group, the high IFNB1 group showed a benefit survival compared with low IFNB1 expression patients. F, In the high-risk group, there was a shorter survival of high IFNB1 expressing patients.
Discussion
Interferons exert a critical role in immune system processes and the antitumor immune response. Although interferon treatment is promising in some tumors, it is still difficult to produce a durable response and improve clinical outcome in gliomas.Citation11,Citation12,Citation31–Citation35 Therefore, it is important to elucidate the clinical value of interferons in glioma. Abundant evidence suggested that interferon-related genes could serve as biomarkers to estimate the clinical outcome and treatment response. In this study, we profiled interferon status and identified an interferon signature with prognostic and predictive value for glioma management.
Increasing evidence has demonstrated that the central nervous system is not immune-privileged.Citation2,Citation36 Our previous studies proposed that the overloaded immune response serves as a key driver in promoting glioma malignancy. Here, we found interferon status was more enhanced in GBM than LGG, which suggested that interferons may contribute to glioma progression. Despite many efforts, which sought to apply interferons in glioma management, there still exists controversy in its prognostic implications. Here, we profiled the prognostic value of 132 interferon-related genes in GBM and identified five (SOCS3, ISG20, IFIT5, NLRC5, and IRF9) that had prognostic significance. These five genes were tightly involved with interferon signaling, for example, SOCS3 was termed as a key negative regulator of type I interferon signaling, which could target IRF7 degradation to suppress TLR7 mediated type I IFN production.Citation37,Citation38 Same as SOCS3, NLRC5 also could negatively regulate the NFKB and type I IFN signaling pathway, even suppress the type I IFN secretion in plasmacytoid dendritic cells.Citation39,Citation40 ISG20 and IFIT5 were termed as the classical interferon-induced genes, ISG20 exerts antiviral activity through upregulation of type I interferon response proteins,Citation41 IFIT5 also could positively regulate NFKB signaling, which tightly involved with type I interferon response.Citation42 As for IRF9, termed as an integral transcription factor in mediating the type I interferon response, which could interacted with STAT2 and synergistically upregulated the transcriptional level of IFN and ISG genes.Citation43,Citation44 With the respect of their potential role in tumor malignancy, there were many experimental and clinical evidences supporting our observations that SOCS3 and ISG20 were risky genes, while IRF9 and NLRC5 were protective genes. For instance, Feng Y reported that promoter hypermethylation of SOCS3 was a favorable prognosticator for GBM patients.Citation45 ISG20 was reported as a pro-angiogenic factor in liver cancer.Citation46 On the other hand, IRF9 was termed as a key factor for eliciting the anti-proliferative activity of interferon alpha.Citation18,Citation47 Additionally, NLRC5 is a critical player in maintaining immune surveillance.Citation16,Citation48 For now, the biological function of IFIT5 remains elusive, recently one study found it was associated with epithelial to mesenchymal transition in renal cancer, but its potential role in immune regulation should be fully explored in tumors, especially in glioma.Citation49 Then we performed protein–protein interactions based on STRING database,Citation50 the results showed that IFIT5 may interact with some genes which exerts pivotal role in the IFN mediated signaling. Moreover, we conducted pearson co-expression analysis of IFIT5 in CGGA microarray cohort and selected the genes with Pearson constant R > 0.6 and adjusted P value <.05, these genes had summarized in Supplementary Table S9. The genes coexpressed with IFIT5 were conducted Go and KEGG analysis by Metascape website, the results revealed that most enriched terms were positive regulation of GTPase activity, regulation of apoptotic process and immune cells chemotaxis like macrophage and neutrophil, etc. (Figure S12B).The robust statistical nature of risk signature method has been fully validated in recent studies.Citation6,Citation51 Based on these five genes mentioned above, we established an interferon signature in GBM for the first time. This signature was stable for stratifying patient with various prognosis in six large sample-sized cohorts. Survival analyses suggested this signature was an independent prognostic indicator as both continuous and categorical variables.
Few studies have explored the biological implications of interferon-related prognostic status. Results based on PCA, GSEA and GSVA suggested that immune relevant processes were highly activated in the high-risk group. Meanwhile, the high-risk score was significantly associated with IDH1 wild type and mesenchymal subtype, which are recognized as immune activated.Citation30,Citation52,Citation53 These findings reinforced that high-risk patients were characterized by an enhanced immune response. As we known, in many types of cancer, enhanced immune response is always accompanied with favorable prognosis, but glioma exhibited a different situation. Many researches had indicated that glioma prefer to termed as a “cold tumor” with low content of CD8 + T cells and M1 polarized macrophages, which exert critical roles in the regulating of immune cytolysis ability.Citation2,Citation54,Citation55 We also found that the number of CD8 + T cells was inversely correlated with tumor grade and survival.Citation4 Moreover, our team’s previous study found that overloaded immune response and disorganized immune microenvironment contribute to GBM’s poor outcome because of the large infiltration of macrophages and neutrophils as well as the immune response their mediated.Citation5,Citation6 It is worth noting that anti-tumor immune response sometimes accompanied with high-intensity inflammation response, which may contribute to a severe brain edema and affect the prognosis of glioma patients because of the increased intracranial pressure.Citation56,Citation57 In this study, we found high-risk tissues were enriched with macrophages and neutrophils. Abundant evidence have proposed the role of macrophages and neutrophils in facilitating immune escape.Citation2,Citation58 Additionally, a series of immune inhibitory factors were enriched in the high-risk group. Therefore, the enhanced immune response of high-risk patients was mainly immunosuppressive. On the other hand, even the proportion of NK resting cells were increased in the high risk group, while activated NK cell were more abundant in low-risk patients. Similarly, the low-risk group was characterized by infiltration of M1 macrophages, which is a pro-inflammation of polarization.Citation59,Citation60 Therefore, the favorable prognosis of low-risk patients may result from an inflammatory microenvironment status. Additionally, we found that a series of immune inhibitory factors were in the high-risk group. These findings indicated that the interferon signature mainly affects the immune response as well as the immune environment of GBM, and there is a more difficult challenge in the clinical intervention of high-risk group patients.
How to identify patients who will benefit most from adjuvant treatment remains a challenge in improving GBM management. Our results suggest that interferon risk signature distinguishes survival only for patients with chemotherapy. Moreover, high-risk GBMs did not benefit from chemotherapy regardless of their MGMT promoter methylation status, which was consistent with previous concept that abnormal interferon status may contribute to chemotherapy resistance. Considering interferon-related genes could reflect the effectiveness of interferon treatment, we also explored the potency of utilizing our signature to predict response to interferon treatment. To mimic the response to interferon-related antitumor therapy, we conducted survival analysis stratified by expression levels of IFNs. Our results indicated that IFNB1 had distinct clinical implications between high and low-risk groups, that high-risk patients may also be resistant to interferon-beta treatment. Therefore, the interferon signature may provide references for guiding treatment. Meanwhile, suitable therapeutic strategies should be developed to improve clinical outcome of high-risk patients, who are resistant to both chemotherapy and interferon therapy.
Immune checkpoints target therapy is considered as one of the most promising strategies for tumors. Its effectiveness relies on the status of tumor antigen. Here, we found types of antigen load had moderate correlation with interferon-related risk. However, expression of inhibitory immune checkpoints was highly correlated with our risk signature. High-risk patients also expressed higher levels of inhibitory checkpoints. Considering tumor interferon signaling mediated resistance to immune checkpoint blockade,Citation61,Citation62 we suggested that high-risk GBMs may benefit from interferon interference combined with checkpoint blockades. Moreover, the five genes constituting the interferon signature could be deemed as suitable targets by weakening risky factors SOCS3 and ISG20 or enhancing the expression and activity of protective factors IRF9, NLRC5, and IFIT5.
In summary, we explored the interferon status and identified genes with significantly prognostic value. The first interferon signature in glioma was developed with various clinical implications. These findings are reliable as the large sample-sized cohorts for discovery and validation, and the robust nature of the risk score method. Our signature could be a clinically useful tool incorporated into an RNA profiling program to facilitate prognostication and treatment guidance. However, this study was also limited due to the fact it was a retrospective study, and lack of the information involved with interferon treatment, which should be further validated by prospective studies. Meanwhile, the molecular mechanism of these five genes involved in interferon response and prognosis determination should be fully investigated in order to support its application.
Materials and methods
Patients of databases
This study included 1,241 GBM and 1,068 lower grade glioma (LGG) patients. Patients were summarized from six cohorts: the Chinese Glioma Genome Atlas (CGGA) microarray cohort; CGGA RNA sequencing (RNA-seq) cohort; the Cancer Genome Atlas (TCGA) RNA-seq cohort; TCGA Agilent 4502A microarray cohort; GSE16011 microarray cohort; and REMBRANDT microarray cohort. The in house CGGA microarray cohort was used for discovery cohort, and CGGA RNA-seq cohort were used for internal validation. Moreover, the other four cohorts were defined as external validation sets, the normalized expression matrix and clinical information were obtained from GlioVis (http://gliovis.bioinfo.cnio.es/).Citation63 The clinicopathologic information of individual cohort was summarized in Supplementary Table S10, respectively.
The patient information from the CGGA microarray and RNA-seq cohorts was obtained from the CGGA database (http://www.cgga.org.cn). Tumor tissue samples were collected at the time of surgery after informed consent. Neuropathologists established the diagnosis and ensured the quality of tissues for further testing. For CGGA microarray cohort, raw data were extracted with the R package “affy” for average normalization followed by quantile normalization. As for genes with several probe sets, the maximum of all probes had been chosen. For CGGA RNA seq cohort, the normalized count reads from the pre-processed data were log2 transformed after adding a 0.5 pseudocount (to avoid infinite value upon log transformation).Citation5,Citation6 Overall survival (OS) was calculated from the date of diagnosis until death or the end of follow-up. The point of death is defined by death certification from local hospitals or police stations.
Bioinformatic analysis
The differentially expressed genes between the high and low-risk groups were identified by limma R package, with a criterion of absolute value of fold change more than 1.5 and an adjusted p value less than 0.05. To explore the functional implications associated with our interferon signature, gene ontology (GO) and Kyoto encyclopedia of genes and genomes (KEGG) pathway analyses were carried out using the ClueGo and Metascape websites.Citation64,Citation65 Gene set enrichment analysis (GSEA) and gene set variation analysis (GSVA) were performed to explore the enrichment of specific gene sets.Citation66,Citation67 The principal components analysis (PCA) and heatmap were performed with R packages to depict the expression patterns across patients. Function gene sets were obtained from (http://amigo.geneontology.org/amigo/landing). Stromal and immune scores were calculated by ESTIMATE R package and the purity of glioma was estimated based on the formula in the study of Yoshihara and colleagues.Citation68 Microenvironment Cell Populations-counter (MCP-counter) was used to estimate eight classical immune cells and two kinds of stromal cells.Citation69 The relative proportions of immune cells were calculated based on CIBERSORT algorithm,Citation70 samples with a CIBERSORT output of P < .05 were adopted for analysis. The mutation and neo-antigen information were obtained from the research of Michael S Rooney.Citation54
Immunohistochemical (IHC) staining
The glioma paraffin-embedded tissues were collected from the First Hospital of China Medical University (Grade II n = 10; Grade III n = 10; GBM n = 30). Twenty-eight cases of these GBM patients have available survival information (one case lost to follow-up, another one case survival length less than 30 days). The detailed protocol of IHC was described as our previous study.Citation4,Citation5 The five genes involved with the risk signature were stained with relevant antibodys (SOCS3, proteintech, 14025–1-AP; ISG20, proteintech, 22097–1-AP; IFIT5, proteintech, 13378–1-AP; NLRC5, Abcam, ab117624; IRF9, proteintch, 14167–1-AP). Immune cell markers were stained across these 30 GBM samples using followed antibodys(IBA1, Abcam, ab178846; Neutrophil elastase, Abcam, ab68672; CD86, Affinity, DF6332; CD69, proteintech, 10803–1-AP). A semiquantitative scoring system was applied following the German immunohistochemical score (GIS).Citation71 These 50 patients’ clinical information and IHC score of five interferon signature’s genes were summarized in Supplementary Table S2, and the detail GIS information of immune-related markers in 30 GBM samples had summarized in Supplementary Table S8. This study was approved by the Ethics Committee of the First Hospital of China Medical University. Informed consent was obtained from each patient.
Statistical analysis
Univariate cox regression analysis was used to identify prognostic genes. A risk signature was developed according to a linear combination of their expression levels weighted with regression coefficients from univariate cox regression analysis.Citation72 Patients were divided into high risk and low-risk group based on their median risk score. The prognostic difference was evaluated by Kaplan-Meier survival analysis and log-rank test. Univariate and further multivariate cox regression analyses were carried out to identify independent prognostic factors. A nomogram model consists of independent prognostic factors was established for a better prediction of prognosis. The prediction accuracy of the risk signature and other clinical features were determined by receiver operating characteristic (ROC) curves and C-index.Citation73 Student’s t-test was used to assess differences in distribution. Pearson correlation was used to calculate correlations. All statistical analyses were performed using SPSS (SPSS 20.0 Inc, Chicago, IL), GraphPad Prism 7(GraphPad Software Inc, LaJolla, CA), R software (R.3.5.1) and Medcalc (15.6.1). A two-sided p value less than 0.05 was regarded as statistically significant.
Conflicts of interest
The authors have no conflicts of interest to declare.
Disclosure
No potential conflicts of interest were disclosed.
Supplemental Material
Download Zip (3.5 MB)Acknowledgments
The authors would like to acknowledge all the members in Dr. Wu AH’s laboratory for help with this study. We thank Dr. Zhiguo Lin for developing of methodology. We also thank Dr. Xiaoyan Xu and Chen Chen for performing the data analysis.
Supplemental Material
Supplemental data for this article can be accessed on the publisher’s website.
Additional information
Funding
References
- Morgan LL. The epidemiology of glioma in adults: a “state of the science” review. Neuro-Oncology. 2015;17:623–624. doi:10.1093/neuonc/nou358.
- Quail DF, Joyce JA. The microenvironmental landscape of brain tumors. Cancer Cell. 2017;31:326–341. doi:10.1016/j.ccell.2017.02.009.
- Han S, Wang C, Qin X, Xia J, Wu A. LPS alters the immuno-phenotype of glioma and glioma stem-like cells and induces in vivo antitumor immunity via TLR4. J Exp Clin Cancer Res. 2017;36:83. doi:10.1186/s13046-017-0552-y.
- Han S, Zhang C, Li Q, Dong J, Liu Y, Huang Y, Jiang T, Wu A. Tumour-infiltrating CD4(+) and CD8(+) lymphocytes as predictors of clinical outcome in glioma. Br J Cancer. 2014;110:2560–2568. doi:10.1038/bjc.2014.162.
- Zhang CB, Cheng W, Ren X, Wang Z, Liu X, Li G, Han S, Jiang T, Wu A. Tumor purity as an underlying key factor in Glioma. Clin Cancer Res. 2017;23:6279–6291. doi:10.1158/1078-0432.CCR-16-2598.
- Cheng W, Ren X, Zhang C, Cai J, Liu Y, Han S, Wu A. Bioinformatic profiling identifies an immune-related risk signature for glioblastoma. Neurology. 2016;86:2226–2234. doi:10.1212/WNL.0000000000002770.
- Zitvogel L, Galluzzi L, Kepp O, Smyth MJ, Kroemer G. Type I interferons in anticancer immunity. Nat Rev Immunol. 2015;15:405–414. doi:10.1038/nri3845.
- Parker BS, Rautela J, Hertzog PJ. Antitumour actions of interferons: implications for cancer therapy. Nat Rev Cancer. 2016;16:131–144. doi:10.1038/nrc.2016.14.
- Payne MJ, Argyropoulou K, Fau - Lorigan P, Lorigan P, Fau - McAleer JJ, McAleer J, Fau - Farrugia D, Farrugia D, Fau - Davidson N, Davidson N, et al. Phase II pilot study of intravenous high-dose interferon with or without maintenance treatment in melanoma at high risk of recurrence. J Clin Oncol. 2014;32:185–190. doi:10.1200/JCO.2013.49.8717.
- De Palma M, Mazzieri R, Fau - Politi LS, Politi L, Fau - Pucci F, Pucci F, Fau - Zonari E, Zonari E, Fau - Sitia G, Sitia G, et al. Tumor-targeted interferon-alpha delivery by Tie2-expressing monocytes inhibits tumor growth and metastasis. Cancer Cell. 2008;14:299–311. doi:10.1016/j.ccr.2008.09.004.
- Hervas-Stubbs S, Perez-Gracia JL, Rouzaut A, Sanmamed MF, Le Bon A, Melero I. Direct effects of type I interferons on cells of the immune system. Clin Cancer Res. 2011;17:2619–2627. doi:10.1158/1078-0432.CCR-10-1114.
- Natsume A, Ishii D, Wakabayashi T, Tsuno T, Hatano H, Mizuno M, Yoshida J. IFN-beta down-regulates the expression of DNA repair gene MGMT and sensitizes resistant glioma cells to temozolomide. Cancer Res. 2005;65:7573–7579. doi:10.1158/0008-5472.CAN-05-0036.
- Qian J, Wang C, Wang B, Yang J, Wang Y, Luo F, Xu J, Zhao C, Liu R, Chu Y. The IFN-gamma/PD-L1 axis between T cells and tumor microenvironment: hints for glioma anti-PD-1/PD-L1 therapy. J Neuroinflammation. 2018;15(1):290. doi:10.1186/s12974-018-1330-2.
- Silginer M, Nagy S, Happold C, Schneider H, Weller M, Roth P. Autocrine activation of the IFN signaling pathway may promote immune escape in glioblastoma. Neuro-Oncology. 2017;19:1338–1349. doi:10.1093/neuonc/nox051.
- Lesinski GB, Zimmerer JM, Kreiner M, Trefry J, Bill MA, Young GS. Modulation of SOCS protein expression influences the interferon responsiveness of human melanoma cells. BMC Cancer. 2010;10:142. doi:10.1186/1471-2407-10-663.
- Ludigs K, Jandus C, Utzschneider DT, Staehli F, Bessoles S, Dang AT, Rota G, Castro W, Zehn D, Vivier E, et al. NLRC5 shields T lymphocytes from NK-cell-mediated elimination under inflammatory conditions. Nat Commun. 2016;7:10554. doi:10.1038/ncomms10554.
- Reu FJ, Bae SI, Cherkassky L, Leaman DW, Lindner D, Beaulieu N. Overcoming resistance to interferon-induced apoptosis of renal carcinoma and melanoma cells by DNA demethylation. J Clin Oncol. 2006;24:3771–3779. doi:10.1200/JCO.2005.03.4074.
- Tsuno T, Mejido J, Zhao T, Schmeisser H, Morrow A, Zoon KC. IRF9 is a key factor for eliciting the antiproliferative activity of IFN-alpha. J Immunother. 2009;803–816.
- Zitzmann K, Brand S, De Toni EN, Baehs S, Goke B, Meinecke J, Spottl G, Meyer HH, Auernhammer CJ. SOCS1 silencing enhances antitumor activity of type I IFNs by regulating apoptosis in neuroendocrine tumor cells. Cancer Res. 2007;67:5025–5032. doi:10.1158/0008-5472.CAN-06-2575.
- Yang Y, Zhou Y, Hou J, Bai C, Li Z, Fan J, Ng IOL, Zhou W, Sun H, Dong Q, et al. Hepatic IFIT3 predicts interferon-alpha therapeutic response in patients of hepatocellular carcinoma. Hepatology. 2017;66:152–166. doi:10.1002/hep.29156.
- Cheon H, Borden EC, Stark GR. Interferons and their stimulated genes in the tumor microenvironment. Semin Oncol. 2014;41:156–173. doi:10.1053/j.seminoncol.2014.02.002.
- Dalpke A, Heeg K, Bartz H, Baetz A. Regulation of innate immunity by suppressor of cytokine signaling (SOCS) proteins. Immunobiology. 2008;213:225–235. doi:10.1016/j.imbio.2007.10.008.
- Lupfer C, Kanneganti TD. The expanding role of NLRs in antiviral immunity. Immunol Rev. 2013;255:13–24. doi:10.1111/imr.12089.
- Ozato K, Tailor P, Kubota T. The interferon regulatory factor family in host defense: mechanism of action. J Biol Chem. 2007;282:20065–20069. doi:10.1074/jbc.R700003200.
- Melguizo C, Prados J, Gonzalez B, Ortiz R, Concha A, Alvarez PJ, Badet L, Hauet T. MGMT promoter methylation status and MGMT and CD133 immunohistochemical expression as prognostic markers in glioblastoma patients treated with temozolomide plus radiotherapy. J Transl Med. 2012;10:250. doi:10.1186/1479-5876-10-233.
- Brown SD, Warren RL, Gibb EA, Martin SD, Spinelli JJ, Nelson BH, Holt RA. Neo-antigens predicted by tumor genome meta-analysis correlate with increased patient survival. Genome Res. 2014;24:743–750. doi:10.1101/gr.165985.113.
- Rutledge WC, Kong J, Gao J, Gutman DA, Cooper LA, Appin C, Park Y, Scarpace L, Mikkelsen T, Cohen ML, et al. Tumor-infiltrating lymphocytes in glioblastoma are associated with specific genomic alterations and related to transcriptional class. Clin Cancer Res. 2013;19:4951–4960. doi:10.1158/1078-0432.CCR-13-0551.
- Meisen WH, Wohleb ES, Jaime-Ramirez AC, Bolyard C, Yoo JY, Russell L, Hardcastle J, Dubin S, Muili K, Yu J, et al. the impact of macrophage- and microglia-secreted TNFalpha on oncolytic HSV-1 therapy in the glioblastoma tumor microenvironment. Clin Cancer Res. 2015;21:3274–3285. doi:10.1158/1078-0432.CCR-14-3118.
- Vo DN, Alexia C, Allende-Vega N, Morschhauser F, Houot R, Menard C, Hoadley KA, Print C, Knowlton N, Black MA, et al. NK cell activation and recovery of NK cell subsets in lymphoma patients after obinutuzumab and lenalidomide treatment. Oncoimmunology. 2018;7:e1409322. doi:10.1080/2162402X.2018.1490854.
- Doucette T, Rao G, Rao A, Shen L, Aldape K, Wei J, Dziurzynski K, Gilbert M, Heimberger AB. Immune heterogeneity of glioblastoma subtypes: extrapolation from the cancer genome atlas. Cancer Immunol Res. 2013;1:112–122. doi:10.1158/2326-6066.CIR-13-0028.
- Chawla-Sarkar M, Lindner D, Fau - Liu YF, Liu Y, Fau - Williams BR, Williams B, Fau - Sen GC, Sen G, Fau - Silverman RH, Silverman R, et al. Apoptosis and interferons: role of interferon-stimulated genes as mediators of apoptosis. Apoptosis. 2003;8:237–249.
- De Beuckelaer A, Grooten J, De Koker S. Type I interferons modulate CD8(+) T cell immunity to mRNA vaccines. Trends Mol Med. 2017;23:216–226. doi:10.1016/j.molmed.2017.01.006.
- Happold C, Roth P, Silginer M, Florea AM, Lamszus K, Frei K, Deenen R, Reifenberger G, Weller M. Interferon-beta induces loss of spherogenicity and overcomes therapy resistance of glioblastoma stem cells. Mol Cancer Ther. 2014;13:948–961. doi:10.1158/1535-7163.MCT-13-0772.
- Kito T, Kuroda E, Fau - Yokota A, Yamashita U. Enhancement of macrophage cytotoxicity against murine gliomas by interferon beta: increase in nitric oxide production in response to glioma-derived soluble factors. J Neurosurg. 2002;97:619–626. doi:10.3171/jns.2002.97.3.0619.
- Takano S, Ishikawa E, Matsuda M, Yamamoto T, Matsumura A. Interferon-beta inhibits glioma angiogenesis through downregulation of vascular endothelial growth factor and upregulation of interferon inducible protein 10. Int J Oncol. 2014;45:1837–1846. doi:10.3892/ijo.2014.2620.
- Wang Q, Hu B, Hu X, Kim H, Squatrito M, Scarpace L, deCarvalho AC, Lyu S, Li P, Li Y, et al. tumor evolution of glioma-intrinsic gene expression subtypes associates with immunological changes in the microenvironment. Cancer Cell. 2018;33:152. doi:10.1016/j.ccell.2017.12.012.
- Yang K, Guan S, Zhang H, Chen Z. Induction of interleukin 6 impairs the anti-HBV efficiency of IFN-α in human hepatocytes through upregulation of SOCS3. J Med Virol. 2019;91:803–812. doi:10.1002/jmv.25382.
- Yu C-F, Peng W-M, Schlee M, Barchet W, Eis-Hübinger AM, Kolanus W, Geyer M, Schmitt S, Steinhagen F, Oldenburg J, et al. SOCS1 and SOCS3 Target IRF7 degradation to suppress TLR7-mediated type I IFN Production of Human plasmacytoid dendritic cells. J Immunol. 2018;200:4024–4035. doi:10.4049/jimmunol.1700510.
- Cui J, Zhu L, Xia X, Wang HY, Legras X, Hong J, Ji J, Shen P, Zheng S, Chen ZJ, et al. NLRC5 negatively regulates the NF-kappaB and type I interferon signaling pathways. Cell. 2010;141:483–496. doi:10.1016/j.cell.2010.03.040.
- Fekete T, Bencze D, Szabo A, Csoma E, Biro T, Bacsi A, Pazmandi K. Regulatory NLRs Control the RLR-Mediated Type I Interferon and Inflammatory Responses in Human Dendritic Cells. Front Immunol. 2018;9:2314. doi:10.3389/fimmu.2018.02314.
- Weiss CM, Trobaugh DW, Sun C, Lucas TM, Diamond MS, Ryman KD, Klimstra WB.The interferon-induced exonuclease ISG20 exerts antiviral activity through upregulation of type i interferon response proteins. mSphere. 2018;3.
- Zheng C, Zheng Z, Zhang Z, Meng J, Liu Y, Ke X, Hu Q, Wang H. IFIT5 positively regulates NF-κB signaling through synergizing the recruitment of IκB kinase (IKK) to TGF-β-activated kinase 1 (TAK1).. Cell Signal. 2015;27:2343–2354. doi:10.1016/j.cellsig.2015.08.018.
- Paul A, Tang TH, Ng SK. Interferon regulatory factor 9 structure and regulation. Front Immunol. 2018;9:1831. doi:10.3389/fimmu.2018.01831.
- Wu Z, Wang L, Xu X, Lin G, Mao H, Ran X, Zhang T, Huang K, Wang H, Huang Q, et al. Interaction of IRF9 and STAT2 synergistically up-regulates IFN and PKR transcription in Ctenopharyngodon idella. Mol Immunol. 2017;85:273–282. doi:10.1016/j.molimm.2017.03.013.
- Martini M, Pallini R, Luongo G, Cenci T, Lucantoni C, Larocca LM. Prognostic relevance of SOCS3 hypermethylation in patients with glioblastoma multiforme. Int J Cancer. 2008;123:2955–2960. doi:10.1002/ijc.23805.
- Lin S-L, Wu S-M, Chung I-H, Lin Y-H, Chen C-Y, Chi H-C, Lin T-K, Yeh C-T, Lin K-H. Stimulation of interferon-stimulated gene 20 by thyroid hormone enhances angiogenesis in liver cancer. Neoplasia. 2018;20:57–68. doi:10.1016/j.neo.2017.10.007.
- Lou Y-J, Pan X-R, Jia P-M, Li D, Xiao S, Zhang Z-L, Chen S-J, Chen Z, Tong J-H. IRF-9/STAT2 [corrected] functional interaction drives retinoic acid-induced gene G expression independently of STAT1. Cancer Res. 2009;69:3673–3680. doi:10.1158/0008-5472.CAN-08-4922.
- Yoshihama S, Vijayan S, Sidiq T, Kobayashi KS. NLRC5/CITA: a key player in cancer immune surveillance. Trends in Cancer. 2017;3:28–38. doi:10.1016/j.trecan.2016.12.003.
- Lo U-G, Bao J, Cen J, Yeh H-C, Luo J, Tan W, Hsieh J-T. Interferon-induced IFIT5 promotes epithelial-to-mesenchymal transition leading to renal cancer invasion. Am J Clin Exp Urol. 2019;7:31–45.
- Szklarczyk D, Gable AL, Lyon D, Junge A, Wyder S, Huerta-Cepas J, Simonovic M, Doncheva NT, Morris JH, Bork P, et al. STRING v11: protein-protein association networks with increased coverage, supporting functional discovery in genome-wide experimental datasets. Nucleic Acids Res. 2019;47:D607–D613. doi:10.1093/nar/gky1131.
- Shukla S, Evans JR, Malik R, Feng FY, Dhanasekaran SM, Cao X, Chen G, Beer DG, Jiang H, Chinnaiyan AM. Development of a RNA-Seq based prognostic signature in lung Adenocarcinoma. J Natl Cancer Inst. 2017;109(1).
- Amankulor NM, Kim Y, Arora S, Kargl J, Szulzewsky F, Hanke M, Margineantu DH, Rao A, Bolouri H, Delrow J, et al. Mutant IDH1 regulates the tumor-associated immune system in gliomas. Genes Dev. 2017;31:774–786. doi:10.1101/gad.294991.116.
- Cheng W, Ren X, Zhang C, Cai J, Han S, Wu A. Gene expression profiling stratifies IDH1-mutant glioma with distinct prognoses. Mol Neurobiol. 2017;54:5996–6005. doi:10.1007/s12035-016-0150-6.
- Rooney MS, Shukla SA, Wu CJ, Getz G, Hacohen N. Molecular and genetic properties of tumors associated with local immune cytolytic activity. Cell. 2015;160:48–61. doi:10.1016/j.cell.2014.12.033.
- Zhou W, Ke SQ, Huang Z, Flavahan W, Fang X, Paul J, Wu L, Sloan AE, McLendon RE, Li X, et al. Periostin secreted by glioblastoma stem cells recruits M2 tumour-associated macrophages and promotes malignant growth. Nat Cell Biol. 2015;17:170–182. doi:10.1038/ncb3090.
- Young JS, Dayani F, Morshed RA, Okada H, Aghi MK Immunotherapy for high grade gliomas: A clinical update and practical considerations for neurosurgeons. World neurosurgery 2019124 397–409 doi:10.1016/j.wneu.2018.12.222
- Zhu X, McDowell MM, Newman WC, Mason GE, Greene S, Tamber MS. Severe cerebral edema following nivolumab treatment for pediatric glioblastoma: case report. J Neurosurg Pediatr. 2017;19:249–253. doi:10.3171/2016.8.PEDS16326.
- Sippel TR, White J, Fau - Nag K, Tsvankin V, Klaassen M, Kleinschmidt-DeMasters BK, Waziri A. Neutrophil degranulation and immunosuppression in patients with GBM: restoration of cellular immune function by targeting arginase I. Clin Cancer Res. 2011;17:6992–7002. doi:10.1158/1078-0432.CCR-11-1107.
- Murray PJ, Wynn TA. Protective and pathogenic functions of macrophage subsets. Nat Rev Immunol. 2011;11:723–737. doi:10.1038/nri3073.
- Sica A, Mantovani A. Macrophage plasticity and polarization: in vivo veritas. J Clin Invest. 2012;122:787–795. doi:10.1172/JCI59643.
- Benci JL, Xu B, Qiu Y, Wu TJ, Dada H, Twyman-Saint Victor C, Cucolo L, Lee DSM, Pauken KE, Huang AC, et al. Tumor interferon signaling regulates a multigenic resistance program to immune checkpoint blockade. Cell. 2016;167:1540–1554. doi:10.1016/j.cell.2016.11.022.
- Minn AJ, Wherry EJ. Combination cancer therapies with immune checkpoint blockade: convergence on interferon signaling. Cell. 2016;165:272–275. doi:10.1016/j.cell.2016.03.031.
- Bowman RL, Wang Q, Carro A, Verhaak RGW, Squatrito M. GlioVis data portal for visualization and analysis of brain tumor expression datasets. Neuro-Oncology. 2017;19:139–141. doi:10.1093/neuonc/now247.
- Tripathi S, Pohl MO, Zhou Y, Rodriguez-Frandsen A, Wang G, Stein DA, Moulton H, DeJesus P, Che J, Mulder LF, et al. Meta- and orthogonal integration of influenza “OMICs” data defines a role for ubr4 in virus budding. Cell Host Microbe. 2015;18:723–735. doi:10.1016/j.chom.2015.11.002.
- Bindea G, Mlecnik B, Hackl H, Charoentong P, Tosolini M, Kirilovsky A, Fridman W-H, Pagès F, Trajanoski Z, Galon J. ClueGO: a Cytoscape plug-in to decipher functionally grouped gene ontology and pathway annotation networks. Bioinformatics. 2009;25:1091–1093. doi:10.1093/bioinformatics/btp101.
- Hänzelmann S, Castelo R, Fau - Guinney J. GSVA: gene set variation analysis for microarray and RNA-seq data. BMC Bioinformatics. 2013;14:7. doi:10.1186/1471-2105-14-7.
- Subramanian A, Tamayo P, Mootha VK, Mukherjee S, Ebert BL, Gillette MA, Paulovich A, Pomeroy SL, Golub TR, Lander ES, et al. Gene set enrichment analysis: a knowledge-based approach for interpreting genome-wide expression profiles. Proc Natl Acad Sci U S A. 2005;102:15545–15550. doi:10.1073/pnas.0506580102.
- Bindea G, Mlecnik B, Tosolini M, Kirilovsky A, Waldner M, Obenauf AC, Angell H, Fredriksen T, Lafontaine L, Berger A, et al. Spatiotemporal dynamics of intratumoral immune cells reveal the immune landscape in human cancer. Immunity. 2013;39:782–795. doi:10.1016/j.immuni.2013.10.003.
- Becht E, Giraldo NA, Lacroix L, Buttard B, Elarouci N, Petitprez F, Selves J, Laurent-Puig P, Sautès-Fridman C, Fridman WH, et al. Estimating the population abundance of tissue-infiltrating immune and stromal cell populations using gene expression. Genome Biol. 2016;17:218. doi:10.1186/s13059-016-1070-5.
- Newman AM, Liu CL, Green MR, Gentles AJ, Feng W, Xu Y, Hoang CD, Diehn M, Alizadeh AA. Robust enumeration of cell subsets from tissue expression profiles. Nat Methods. 2015;12:453–457. doi:10.1038/nmeth.3337.
- Remmele W, Schicketanz KH. Immunohistochemical determination of estrogen and progesterone receptor content in human breast cancer. Computer-assisted image analysis (QIC score) vs. subjective grading (IRS). Pathol Res Pract. 1993;189:862–866. doi:10.1016/S0344-0338(11)81095-2.
- Lossos IS, Czerwinski D, Fau - Alizadeh AA, Alizadeh A, Fau - Wechser MA, Wechser M, Fau - Tibshirani R, Tibshirani R, Fau - Botstein D, Botstein D, et al. Prediction of survival in diffuse large-B-cell lymphoma based on the expression of six genes. N Engl J Med. 2004;350:1828–1837. doi:10.1056/NEJMoa032520.
- Wang Y, Li J, Xia Y, Gong R, Wang K, Yan Z, Wan X, Liu G, Wu D, Shi L, et al. Prognostic nomogram for intrahepatic cholangiocarcinoma after partial hepatectomy. J Clin Oncol. 2013;31:1188–1195. doi:10.1200/JCO.2012.41.5984.