
ABSTRACT
Neutrophils are a heterogeneous population of myeloid cells which may either promote or hinder tumor growth and progression. Anti-tumor neutrophils have the capacity to kill tumor cells in a contact-dependent manner. However, the molecular mechanisms underlying tumor cell recognition by neutrophils remained unexplored. Tumor cells were shown to express aberrant glycosylation patterns and neutrophils are equipped with receptors capable of recognizing such glycosylations. Accordingly, we hypothesized that the receptor for advanced glycation end products (RAGE) may facilitate neutrophil recognition of tumor cells. Indeed, RAGE decoy receptors and RAGE-specific blocking antibodies dramatically reduce tumor cell susceptibility to neutrophil cytotoxicity. Unexpectedly, we found that tumor cell RAGE rather than neutrophil RAGE is important for the killing process. We further identified neutrophil Cathepsin G as the neutrophil component interacting with tumor cell RAGE. Cathepsin G-deficient neutrophils show impaired ability to kill tumor cells, suggesting that RAGE-Cathepsin G interaction is required for neutrophil cytotoxicity. These data unravel new aspects of neutrophil anti-tumor activity and identify a novel role for RAGE and Cathepsin G in neutrophil-mediated cytotoxicity.
Introduction
Neutrophils are the most abundant of all white blood cells in the human circulation and represent the first line defense against invading pathogens. Neutrophils are characterized by having a short half-life, being continuously replenished by maturing neutrophils in the bone marrow.Citation1 They rapidly respond to diverse signals in the microenvironment that affect their activation status and adhesion molecule profile, making them able to extravasate and execute their protective functions in affected tissues. The initial recruitment of neutrophils to the inflamed tissue is important for promoting the later adaptive immune responses.Citation2
Neutrophils play a dual role in the tumor microenvironment, where they exert both pro- and anti-tumor activities.Citation3–Citation6 Unlike traditionally perceived, neutrophils are not a homogeneous population of cells, but rather consist of various subpopulations with distinct functions.Citation1,Citation7,Citation8 Anti-tumor neutrophils are characterized by their ability to recognize tumor cells and induce tumor cell apoptosis via production of reactive oxygen species.Citation3,Citation9–Citation11 Neutrophils may also limit tumor growth by acting as antigen-presenting cellsCitation12 and by mediating antibody-dependent anti-tumor effects.Citation13 Both cytotoxic and pro-metastatic neutrophils accumulate in the pre-metastatic lung where they may either promote or limit metastatic seeding of tumor cells.Citation6,Citation9,Citation14–Citation16
The ability of neutrophils to kill tumor cells has been known for years,Citation9,Citation10,Citation14,Citation17–Citation20, and they do so in a contact-dependent manner involving the production of H2O2.Citation3,Citation9,Citation11 The observation that neutrophils form physical contact with tumor cells,Citation9 suggests a mechanism for specific recognition of tumor cells. While the interaction between neutrophils and tumor cells is clearly required for neutrophil cytotoxicity, the mechanisms employed by neutrophils to recognize tumor cells remain largely unknown. Neutrophils are equipped with a variety of receptors capable of recognizing potentially hazardous molecular patterns. Tumor cells express numerous aberrant glycosylation patterns which are potential ligands for such receptors. We, therefore, hypothesized that the receptor for advanced glycation end products (RAGE) may serve as the receptor used by neutrophils to recognize tumor cells. Here we show that blocking RAGE using soluble decoy receptors or RAGE-specific antibodies dramatically impairs neutrophil cytotoxicity. Surprisingly, we found that it is tumor cell expressed RAGE, rather than neutrophil expressed RAGE, that is critical for neutrophil cytotoxicity. Searching for the neutrophil component that interacts with tumor cell RAGE, we identified Cathepsin G, which in addition to its expression within neutrophil granules,Citation21 is also expressed on the neutrophil cell surface.Citation22 Cathepsin G-specific antibodies dramatically impaired neutrophil cytotoxicity, as did the expression of a competitive soluble form of Cathepsin G. Importantly, Cathepsin G-deficient neutrophils show impaired ability to kill tumor cells. Finally, we show that it is the presence of the Cathepsin G protein, rather than its enzymatic activity, which is important for the tumor cell killing. Together, these observations provide novel molecular insight into the mechanism that mediates tumor cell recognition by neutrophils. In addition, our observations identify a new role for Cathepsin G that is not related to its enzymatic activity.
Results
Previous studies have shown that tumor-entrained neutrophils have the capacity to kill tumor cells while causing no apparent damage to healthy cells.Citation7,Citation9 This suggests that neutrophils can specifically recognize tumor cells and target them for elimination. Neutrophils are equipped with a variety of receptors that are not epitope specific, but instead recognize patterns, which may indicate a threat. These pattern recognition receptors (PRRs) may be involved in detecting changes occurring in cancer cells and are thus potential candidates for facilitating the interaction between neutrophils and tumor cells required for the subsequent induction of tumor cell death. Since cancer cells often show altered glycosylation patterns,Citation23 we hypothesized that the receptor for advanced glycation end products (RAGE) may be involved in neutrophil recognition of tumor cells. RAGE has been shown to play a role in the recognition of endogenous molecules released upon infection, physiological stress and chronic inflammation.Citation24,Citation25 To assess the role of RAGE in neutrophil cytotoxicity, we generated AT3, E0771 and LLC cells expressing a tet-inducible soluble form of RAGE (sRAGE) () and challenged these cells with neutrophils in a co-culture setting. Remarkably, sRAGE-expressing AT3, E0771 and LLC cells showed a consistent reduction in their susceptibility to neutrophil cytotoxicity (). In contrast, tumor cells expressing soluble L-Selectin or soluble TLR4 receptor showed similar sensitivity to neutrophil cytotoxicity (data not shown), thus excluding a non-specific effect due to soluble receptor expression per se. Moreover, the addition of RAGE-specific blocking antibodies was highly effective in reducing neutrophil cytotoxicity toward AT3, LLC, E0771 and also B16-F10 cells (). Taken together, these observations suggest that RAGE is involved in the recognition step that enables neutrophil cytotoxicity toward a variety of tumor cells.
Figure 1. RAGE is required for neutrophil cytotoxicity.
a. Western blot analysis of doxycycline-induced (Dox.) sRAGE expression in the supernatant of AT3, LLC and E0771 cells. b. Killing of sRAGE-expressing AT3, LLC and E0771 cells by neutrophils. n = 5. c. Killing of AT3, LLC, E0771 and B16-F10 by neutrophils in co-culture in the presence of control or RAGE blocking antibody (1 μg/ml; R&D, AF1179). n = 6–9. d. Flow cytometry of RAGE expression on neutrophils (red). Black histogram represents the 2nd antibody only. e. Flow cytometry of blood from mice transplanted with wild-type (WT) or RAGE-/- bone marrow, showing full reconstitution of GFP+/Ly6G+/RAGE-/- neutrophils (>90% GFP positive cells). f. RT-PCR of RAGE mRNA in neutrophils (Neut.) and bone marrow (BM) isolated from wild-type and RAGE-/- mice. g. Western blot analysis of RAGE expression in lung lysates from wild-type and RAGE-/- mice. h. Killing of AT3 and LLC cells by neutrophils purified from tumor-bearing wild-type and RAGE-/- mice. n = 6. i. Killing of AT3 and LLC tumor cells by neutrophils purified from tumor-bearing wild-type or RAGE-/- bone marrow-transplanted (BMT) C57BL/6 mice. n = 7-12. j. Primary tumor growth of AT3 cells following orthotopic injection into wild-type or RAGE-/- mice. n = 5. k. Primary tumor growth of AT3 cells following orthotopic injection into mice transplanted with either wild-type or RAGE-/- bone marrow cells. n = 5. l. Primary tumor growth of orthotopically injected AT3 tumors expressing tet-inducible sRAGE in wild-type mice in the absence (Cont.) or presence of doxycycline (sRAGE) in the drinking water. The ratio of AUCsRAGE/AUCControl = 2.17. n = 5. m. MTT assay (OD 540nm) for in vitro proliferation of tet-inducible sRAGE expressing AT3 cells in the absence or presence of doxycycline. n = 6. *p <0.05, **p < 0.001.
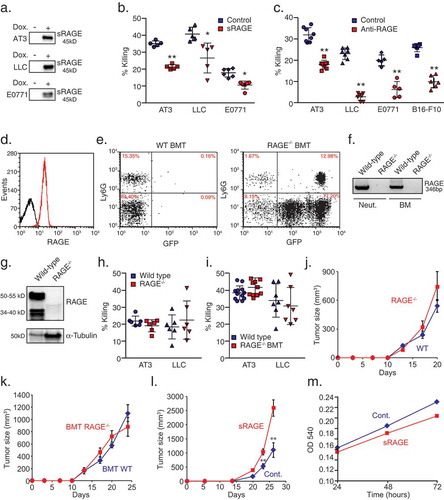
Since neutrophils express RAGE (), we analyzed the ability of RAGE-/- neutrophils to kill tumor cells. To this end, we isolated RAGE-/- neutrophils from either RAGE-/- tumor-bearing mice or from tumor-bearing wild-type mice transplanted with RAGE-/- bone marrow (BMT, Fig. E). The loss of RAGE in RAGE-/- mice was verified by RT-PCR () and Western blot analysis (). Unexpectedly, we found that neutrophils isolated from either RAGE-/- or RAGE-/- BMT tumor-bearing mice showed similar cytotoxicity toward tumor cells as wild-type neutrophils (-), suggesting that neutrophil RAGE is dispensable for recognizing tumor cells. We further found that primary tumor growth of AT3 was similar in RAGE-/- and wild-type mice (). The same observation was seen when AT3 tumor cells were injected into wild-type mice that have been lethally irradiated and reconstituted with bone marrow from wild-type or RAGE-/- mice (). However, when orthotopically injected into the mammary fat pad of wild-type mice, sRAGE-expressing AT3 tumors grew significantly faster compared with control tumors () despite the slower proliferation of sRAGE-expressing cells in culture (). These observations suggest that the enhanced tumor growth of sRAGE-expressing AT3 cells in vivo is not a result of tumor cell autonomous features, but is more likely the consequence of the interaction between tumor cells and the microenvironment.
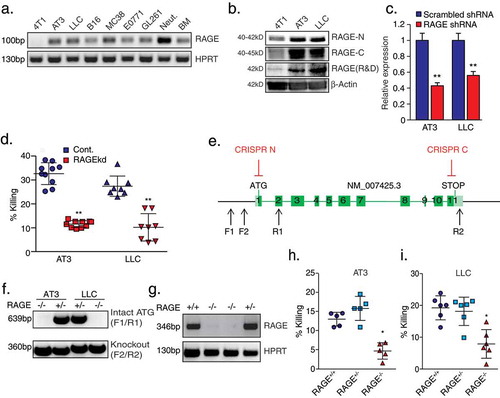
In light of these observations, we hypothesized that tumor cell RAGE, rather than neutrophil RAGE, may be important for neutrophil recognition of tumor cells. Hence, we performed PCR analysis for RAGE expression in several tumor cell lines and used neutrophils and whole bone marrow as positive controls. Indeed, RAGE mRNA was found to be highly expressed in neutrophils and whole bone marrow as well as in most tumor cell lines (). Western blot analysis confirmed high RAGE protein expression levels in AT3 and LLC cells, with a significantly lower expression in 4T1 cells (). To study the role of tumor cell RAGE in neutrophil cytotoxicity, we used RAGE-specific shRNAs to generate RAGE knockdown cells (RAGEkd) (). RAGEkd AT3 and LLC cells showed 50–60% reduction in their sensitivity to neutrophil cytotoxicity, suggesting that tumor cell RAGE is indeed involved in tumor cell recognition (). To conclusively determine the role tumor cell RAGE plays in neutrophil cytotoxicity, we used CRISPR technology () to generate RAGE knockout cells (RAGE-/-, -). We observed that RAGE-/- cells, like RAGEkd cells, show a 45–55% reduction in their susceptibility to neutrophil cytotoxicity (-).
Figure 2. Tumor-cell RAGE is required for neutrophil cytotoxicity.
a. RT-PCR analysis of RAGE isoform 1 expression (exons 8–9) in various mouse tumor cell lines, neutrophils (Neut.) and bone marrow cells (BM). b. Western blot analysis for RAGE expression in 4T1, AT3, and LLC cells using antibodies to N-terminal RAGE (clone A-9, Santa Cruz, RAGE-N), C-terminal RAGE (ab3611, Abcam, RAGE-C) or total RAGE (R&D, AF1179). Antibodies to β-actin were used as loading control. c. qPCR analysis of RAGE expression in AT3 and LLC cells transduced with shRNA to RAGE. d. Killing of AT3 and LLC cells transduced with pLKO-scrambled or pLKO-RAGE shRNA by neutrophils. n = 8–10. e. Illustration of CRISPR targeting of RAGE (CRISPR N/C) and the two primer sets used for genomic analysis (F1/R1, F2/R2). f. Genomic PCR analyses of AT3 and LLC CRISPR clones using the primer sets F1/R1 and F2/R2. g. RT-PCR of RAGE mRNA in control AT3 cells and three CRISPR clones using primers for exons 3–5. h-i. Neutrophil killing of control (RAGE+/+), RAGE+/- and RAGE-/- AT3 (h) and LLC cells (i). n = 5–6. * p <0.05, ** p <0.001.
Carcinogenesis has been shown to be retarded in RAGE KO mice,Citation26–Citation29 which may be explained by the transmission of survival signals through ERK, p38, JNK and NFκB by RAGE.Citation25 Accordingly, RAGE-/- AT3 cells showed a significant delayed onset in tumor growth compared with RAGE+/+ AT3 cells (Suppl. Figure 1a). Also, when injected intravenously, the metastatic seeding capacity of RAGE-/- AT3 cells in the lung was dramatically reduced compared with RAGE+/+ cells (Suppl. Figure 1b). Despite the different metastatic capacities of the RAGE-deficient and RAGE-proficient tumor cells, we decided to test the effect of cytotoxic lung neutrophils on lung seeding of these cells. To this end, NOD-SCID mice were orthotopically injected with 4T1 breast cancer cells, that elicit a robust lung infiltration of cytotoxic neutrophils.Citation9 We then analyzed the extent of metastatic seeding of GFP-labeled RAGE+/+ or RAGE-/- AT3 cells (injected into the tail vein) in control and neutrophil-depleted mice. Elimination of neutrophils increased the seeding of RAGE+/+ AT3 cells by ~4-fold (Suppl. Figure 1c), demonstrating the anti-metastatic capacity of neutrophils in this context. However, neutrophil depletion had no effect on the lung seeding of RAGE-/- AT3 cells (Suppl. Figure 1c), indicating the insensitivity of these cells to neutrophil cytotoxicity in vivo.
To identify the neutrophil counterpart of tumor cell RAGE, we generated cells with a tet-inducible expression of the soluble form of RAGE fused to Fc of human IgG (sRAGE-Fc) (). The Fc has a mutation that prevents its binding to Fc receptors,Citation30 and in such will not induce antibody-dependent cytotoxicity. Importantly, we found that sRAGE-Fc was highly efficient in blocking neutrophil cytotoxicity (). We further found that sRAGE-Fc binds strongly to the tumor cells (), while only weakly to neutrophils (). Co-immunoprecipitation using sRAGE-Fc and tumor cell extracts demonstrated that sRAGE-Fc efficiently binds endogenous RAGE (). This observation suggests that the blocking effect of sRAGE on neutrophil cytotoxicity might be due to the blocking of RAGE in a fashion similar to the use of RAGE blocking antibodies.
Figure 3. Soluble RAGE-Fc binds strongly to tumor cells and forms homophilic RAGE–RAGE interaction.
a. Western blot analysis of tet-inducible sRAGE-Fc expression (Dox.) in the supernatant of AT3 and LLC cells. b. Killing of tet-inducible sRAGE-Fc-expressing AT3 and LLC tumor cells by neutrophils with or without doxycycline (Dox.) induction. n = 5–9. c. Flow cytometry analysis of sRAGE-Fc binding to AT3 and LLC cells. The black histogram represents the 2nd antibody only. d. Flow cytometry analysis of sRAGE-Fc binding to neutrophils (Red histogram). The black histogram represents the 2nd antibody only. e. Co-immunoprecipitation of endogenous RAGE with sRAGE-Fc. Lysates of control and sRAGE-Fc overexpressing AT3 cells were incubated with Protein A-beads, and the co-immunoprecipitated proteins analyzed by Western blotting. Antibody to Fc detects the higher MW sRAGE-Fc band, while anti-RAGE detects both sRAGE-Fc (75–95 kD) and endogenous Rage (34–55 kD). Antibody to α-Tubulin was used for loading control, and can only be detected in Pre-IP samples. Pre-IP presents 1/50 of the input IP sample. The samples were run under reducing conditions. f. Summary of mass spectrometry analysis of neutrophil proteins interacting with AT3-derived sRAGE-Fc. g. RT-PCR of S100A8, S100A9 and TBP in neutrophils and bone marrow. h. Left lane is Pierce blue staining of neutrophil extract run on SDS-PAGE gel. The middle and right lanes are Western blotting for S100A8 and S100A9 expression, respectively, in the same neutrophil extract. i. Co-immunoprecipitated neutrophil proteins were analyzed by Western blotting using antibodies to S100A8, S100A9 or Fc to detect sRAGE-Fc. The three first lanes represent Pre-IP samples that were loaded 1/50 of the input IP sample. Neut. = Neutrophils; Cont. = Control AT3 cells; sRAGE-Fc = AT3 cells expressing sRAGE-Fc. The samples were run under reducing conditions. ** p <0 .001.
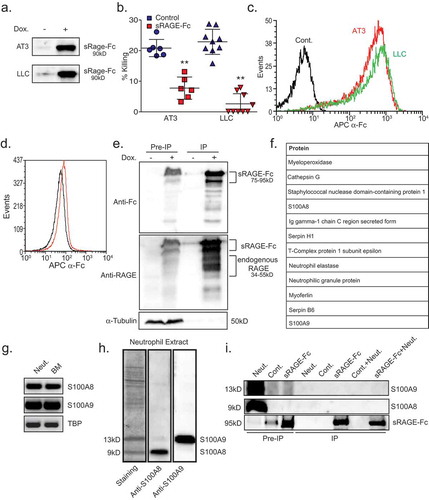
To identify the neutrophil component that binds tumor cell RAGE, we used sRAGE-Fc to pull down neutrophil proteins interacting with RAGE. Mass spectrometry analysis of neutrophil proteins interacting with tumor cell RAGE identified several candidates ( and Suppl. Table 1) of which S100 proteins (A8 and A9) and Cathepsin G were among the most prominent ones. S100A8 and S100A9, which are highly expressed in neutrophils,Citation31 and - has previously been reported to interact with carboxylated N-glycans on RAGE.Citation32 This made S100A8 and S100A9 highly attractive candidates for mediating the interaction between neutrophils and tumor cell RAGE. Accordingly, we tested whether these proteins co-immunoprecipitate (IP) with tumor RAGE. Despite the high amounts of S100A8 and S100A9 detected in pre-IP neutrophil samples, no S100A8/A9 was found to bind tumor-derived sRAGE-Fc (), suggesting that these molecules are not the ligands for tumor RAGE in this setting.
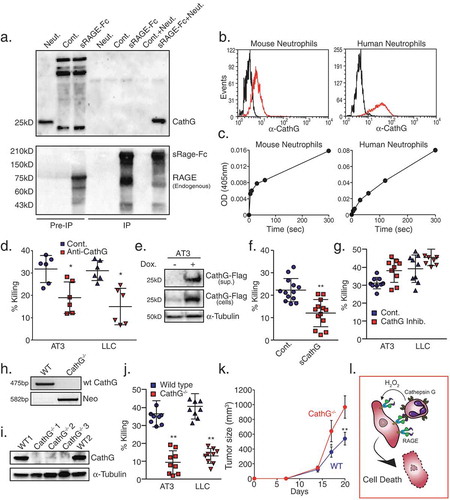
Unlike S100A8 and S100A9, Cathepsin G readily co-precipitated with sRAGE-Fc (), confirming the mass spectrometry data (). Importantly, Cathepsin G was found to be expressed, and enzymatically active, on the surface of both mouse and human neutrophils (-). Not only the normal high-density neutrophils express enzymatically active Cathepsin G on their surface, but also the low-density neutrophils isolated from tumor-bearing mice (Suppl. Figure 2a-b). We then tested whether interfering with Cathepsin G has any consequences on neutrophil cytotoxicity. Indeed, neutralizing antibodies to Cathepsin G inhibited 30–45% the killing of AT3 and LLC cells by neutrophils (), suggesting that Cathepsin G is involved in tumor cell recognition. Corroborating this observation, AT3 cells overexpressing a secreted form of Cathepsin G () designed to compete with neutrophil-derived Cathepsin G, showed a significant reduction in their susceptibility to neutrophil cytotoxicity (). In contrast, Cathepsin G inhibitor did not interfere with the killing (), suggesting that the Cathepsin G protein itself, rather than its enzymatic activity, is essential for recognizing tumor cells. Importantly, Cathepsin G knockout (CathG-/-) neutrophils (-) showed 75–80% reduced cytotoxicity towards AT3 and LLC cells (), emphasizing the crucial role of Cathepsin G. Finally, we found that AT3 tumors grew significantly faster in mice that have been reconstituted with CathG-/- bone marrow cells than those reconstituted with wild-type bone marrow cells (). Taken together, our observations suggest that tumor cell RAGE and neutrophil Cathepsin G are required for neutrophil-tumor cell interaction and the consequent neutrophil-mediated elimination of tumor cells ().
Figure 4. Neutrophil Cathepsin G recognizes tumor cells by interacting with tumor RAGE.
a. Co-immunoprecipitation of neutrophil proteins with AT3-derived sRAGE-Fc. Co-immunoprecipitated neutrophil proteins were analyzed by Western blotting using antibodies to Cathepsin G (Upper panel) or RAGE (Lower panel) to detect sRAGE-Fc (upper band) and endogenous RAGE (lower band). The three first lanes represent Pre-IP samples that were loaded 1/50 of the input IP sample. Neut. = Neutrophils; Cont. = Control AT3 cells; sRAGE-Fc = AT3 cells expressing sRAGE-Fc. The samples were run under non-reducing conditions. b. Flow cytometry of surface Cathepsin G expression on mouse and human neutrophils (red histograms). Black histograms represent the 2nd antibody only. c. Surface Cathepsin G activity measured at 405nm after adding the Cathepsin G substrate MeOSuc-Ala-Ala-Pro-Met-pNA (200 μM) to 1 × 10⁵ neutrophils. d. Killing of AT3 and LLC cells by neutrophils in the presence of control or anti-Cathepsin G antibodies (1 μg/ml). n = 6. e. Western blot analysis of Cathepsin G-Flag expression in supernatant (“sup.”) and in AT3 cells that overexpress tet-inducible Cathepsin G-Flag. f. Killing of Cathepsin G-Flag-overexpressing AT3 tumor cells by neutrophils with or without doxycycline (Dox.) induction. n = 13. g. Killing of AT3 and LLC tumor cells by neutrophils in the absence or presence of 10 μM Cathepsin G inhibitor. n = 9. h. Genotyping of white blood cells isolated from mice transplanted with either wild-type (WT) or Cathepsin G-/- (CathG-/-) bone marrow cells using primers for Cathepsin G and Neomycin (Neo). i. Western blot analysis of white blood cells from mice reconstituted with either wild-type or Cathepsin G−/- bone marrow cells. j. Killing of AT3 and LLC tumor cells by wild-type or Cathepsin G-/- neutrophils. n = 9. k. Growth of AT3 tumors in mice transplanted with either wild-type or Cathepsin G-/- bone marrow cells. n = 5. The ratio of AUCCathG-/-/AUCWT = 1.63. l. Proposed model for neutrophil cytotoxicity towards RAGE-expressing tumor cells. Tumor cells attract neutrophils, which express Cathepsin G on their cell surface. The neutrophil Cathepsin G recognizes the tumor cells by interacting with their RAGE. Following neutrophil recognition of tumor cells, the tumor cells die by the well-characterized H2O2-dependent cell death mechanism exerted by the neutrophils. * p <0.05, ** p <0.001.
Discussion
The ability of neutrophils to kill tumor cells has been known for decades,Citation9,Citation14,Citation17,Citation19,Citation20 however the molecular mechanisms that mediate their recognition of tumor cells remain unknown. We hypothesized that since tumor cells often express aberrant glycosylation patterns,Citation23 neutrophils might identify these structures and target the cells for elimination. We assumed that a prime neutrophil-expressed candidate receptor for identifying such aberrant glycosylations could be the receptor for advanced glycation end products (RAGE). Indeed, our data show that neutrophil cytotoxicity towards various tumor cells is dramatically reduced using decoy soluble RAGE or RAGE-specific blocking antibodies implicating RAGE in the killing process. To our surprise, we found that RAGE-/- and RAGE+/+ neutrophils killed tumor cells with similar efficiency excluding a critical role for neutrophil-expressed RAGE. This observation together with the fact that most tumor cells express high levels of RAGE, led us to hypothesize that it may be tumor cell RAGE, rather than neutrophil RAGE, which facilitates neutrophil recognition of tumor cells. Indeed, perturbation of RAGE expression in tumor cells resulted in 40–50% reduction in their susceptibility to neutrophil cytotoxicity, implicating tumor cell expressed RAGE in this process. These findings are interesting in light of the fact that RAGE expression is frequently upregulated in cancer where it promotes tumor growth, tumor cell migration and metastasis.Citation25,Citation29,Citation33–Citation35 RAGE is known to transmit survival signals through activation of ERK, p38, JNK and NFκB signaling pathways.Citation25 RAGE itself is a target of NFκB, thereby generating a feed-forward regulatory loop resulting in elevated RAGE expression.Citation25,Citation34 Moreover, RAGE provides the cues required for oncogenic transformation of normal and pre-malignant tissues in response to certain stress conditions such as hypoxia, hyperglycemia, inflammation and oxidative stress.Citation36 Thus, RAGE might be considered to be an early tumor marker. The role of RAGE in cancer is further exemplified by the fact that induced and spontaneous carcinogenesis is retarded in RAGE-/- miceCitation26–Citation28 and RAGE-/- tumor cells have impaired metastatic potential.Citation26,Citation33,Citation37,Citation38 Also we observed that RAGE-/- tumor cells show delayed tumor growth and impaired metastatic seeding capacity in the lungs. In contrast to RAGE-proficient cells whose seeding in the lung is prevented by neutrophils, the lung seeding of RAGE-deficient cells is unaffected by neutrophils. Thus, the defective tumor growth of RAGE-/- cells is cell-autonomous, likely due to lack of RAGE-mediated signals required for their propagation. However, the expression of RAGE renders potentially metastatic tumor cells susceptible to neutrophil cytotoxicity. This highlights a mode of immune editing where neutrophils can eliminate aggressive RAGE expression tumor cells while sparing the less aggressive tumor cells expressing reduced levels of RAGE.
Looking for the neutrophil component that interacts with tumor cell RAGE, we used soluble RAGE to pull down RAGE-interacting neutrophil proteins. Of the interacting proteins identified by mass spectrometry, we found that Cathepsin G, but not S100A8, S100A9 or neutrophil elastase, readily associates with tumor cell RAGE. Using neutralizing antibodies to Cathepsin G and Cathepsin G-/- neutrophils, we demonstrated a critical role for Cathepsin G in facilitating neutrophil cytotoxicity toward tumor cells. Moreover, Cathepsin G overexpression in tumor cells, where it functions as a soluble decoy molecule, limits neutrophil cytotoxicity. Notably, Cathepsin G is abundantly expressed on neutrophils, making it available for detecting tumor RAGE. Cathepsin G was previously shown to be expressed on the neutrophil surface,Citation22 as well as within neutrophil granulesCitation21 where it plays important roles in anti-microbial immunity.Citation39 We observed that Cathepsin G expressed on neutrophils show intact enzymatic activity. However, inhibiting its activity did not interfere with neutrophil cytotoxicity, suggesting that it is the Cathepsin G itself rather than its enzymatic activity that is important for neutrophil recognition of tumor cells. By analogy, Cathepsin G was recently shown to be involved in arterial leukocyte adhesionCitation40 where Cathepsin G-mediated adhesion depends on the protein itself and not its enzymatic activity. Altogether, these data attribute a new function to Cathepsin G being a recognition molecule on the neutrophil surface that senses RAGE on tumor cells.
In summary, this study reveals a critical role for RAGE in mediating neutrophil cytotoxicity towards tumor cells. Importantly, we found that although RAGE is expressed on both neutrophils and tumor cells, it is tumor cell RAGE, rather than neutrophil RAGE, that is critical for neutrophil cytotoxicity. We further show that Cathepsin G expressed on the neutrophil surface interacts with tumor cell RAGE and is required for neutrophil cytotoxicity. Notably, neutrophil cytotoxicity towards tumor cells is not completely abolished when the RAGE-Cathepsin G interaction is perturbed suggesting that other, yet unidentified components, are also involved in mediating the interaction between neutrophils and tumor cells.
Materials and methods
Five to six-week-old C57BL/6 mice were purchased from Harlan (Israel). NOD-SCID mice were obtained from Envigo. RAGE-/- mice on a C57BL/6 backgroundCitation41,Citation42 were kindly provided by Prof. Thomas Fleming, Heidelberg, Germany. Genotyping of RAGE−/- was done on cDNA samples prepared from mRNA isolated from normal high-density neutrophils and bone marrow cells using the following primer pair: Forward (exon 3, nt 204–227) 5ʹ-AAC ACA GGA AGA ACT GAA GCT TGG-3ʹ and Reverse (exon 5, nt 549–526) 5ʹ- CTT TGC CAT CGG GAA TCA GAA GTT-3ʹ giving rise to a 346 bp PCR product. Leukocytes from the RAGE−/- mice showed high GFP expression on flow cytometry. Bone marrow transplantation was done by intravenous injection of bone marrow cells together with splenocytes from wild-type or RAGE-/- mice into wild-type C57BL/6 mice that were irradiated the day before with a 2 × 550 Rad dosage given in a 4-h interval. Neomycin (Sigma, 0.5 mg/ml) was given to the drinking water for 4 weeks, and after an additional 4 weeks, blood tests were done by flow cytometry and RT-PCR to verify the RAGE-/- phenotype, showing full reconstitution (-). Bone marrow cells and splenocytes from Cathepsin G-/- mice on a C57BL/6 backgroundCitation43 were used for bone marrow transplantation to obtain Cathepsin G-/- neutrophils. The Cathepsin G−/- genotype was verified by PCR using the following primer pairs: Cathepsin G wt: 5ʹ-AGC AAC TCA TCA CAG TGC TCA GAG-3ʹ/5ʹ-GAT CTG AGT CTG GCT GTT GTA G-3ʹ (475 bp); Cathepsin G KO: 5ʹ-GAT GGA TTG CAC GCA GGT TCT C-3ʹ/5ʹ-CAC CAT GAT ATT CGG CAA GCA GGC-3ʹ (582 bp) (). In vivo tumor growth was done by injecting 0.5 × 10⁵ AT3 tumor cells in 50 μl PBS into the mammary fat pad. For induction of tet-inducible sRAGE, doxycycline (Bio Basic Canada Inc., 0.5 mg/ml) was added to the drinking water together with 0.2% sucrose. Control mice received 0.2% sucrose in the drinking water. Primary tumor growth was measured with a digital caliper and tumor volume calculated by the formula 0.52*width2*length. All experiments involving animals were approved by the Hebrew University’s Institutional Animal Care and Use Committee (IACUC).
Neutrophil isolation
Mouse neutrophils were purified from 8 to 12-week-old BALB/c mice that have been injected orthotopically with 1 × 10⁶ 4T1 cells 3 weeks before or 8–12-week-old C57BL/6 mice that have been injected orthotopically with 5 × 10⁵ AT3 3 weeks before. Neutrophil purification was done as previously described.Citation44
Cell culture
4T1 breast cancer cells, Lewis lung carcinoma cells (LLC) and B16-F10 melanoma cells were purchased from ATCC and cultured in DMEM containing 7.5% heat-inactivated FCS (Sigma). AT3 PYMT breast cancer cells were kindly provided by Prof. Scott Abrams, Roswell Park Cancer Institute (Buffalo, NY) and cultured in DMEM containing 7.5% heat-inactivated FCS. E0771 breast cancer cells were obtained from ATCC and grown in RPMI containing 7.5% heat-inactivated FCS. The cell cultures were tested to be mycoplasma-free using the EZ-PCR™ Mycoplasma Test Kit (Biological Industries, Israel).
The tumor cells were transduced with either a lentiviral vector (pLVX-Luc) or retroviral vector (MigR1-Luc) to stably express firefly luciferase. For soluble receptor expression, cells were infected with viral particles prepared from tet-inducible pLV_TRE_RFP vector (kindly provided by Prof. Eli Keshet, The Hebrew University of Jerusalem) expressing the respective genes, and mRFP-positive cells were sorted using BD FACSARIA III cell sorter. Soluble receptor expression was induced by adding 1 μg/ml doxycycline (Sigma) to the cells the day before the assay. RAGE knockdown cells were prepared by lentiviral transduction with RAGE-specific shRNAs from Sigma (TRCN0000071743-71747) followed by puromycin selection (2 μg/ml for 5 d). RAGE knockout of tumor cells was done by using the CRISPR technology. The tumor cells were transiently transfected with two pX330 plasmids (2 μg each) that, respectively, target the ATG site (GGA AGG AAG CAC CAT GCC AG, nt 32–51 of RAGE isoform 1, NM_007425.3) and a site slightly upstream to the stop codon (GAA GCG GAG ATG CCA GAG AA, nt 1215–1234 of RAGE isoform 1) () using Lipofectamine 3000 transfection reagent (Life Technologies, Inc.) according to the manufacturer’s instructions. The cells were co-transfected with 100 ng FUW puro-GFP plasmid kindly provided by Dr. Yossi Buganim (The Hebrew University of Jerusalem), and 2d post-transfection GFP+ cells were sorted using BD FACSARIA III cell sorter, and the GFP+ sorted cells were seeded in limiting dilutions to achieve single cell colonies. The genotype of the CRISPR clones was analyzed by PCR using two primer pairs (-). One primer pair encompassed the ATG site: Forward (upstream to ATG): 5-AAC AGA GCA GAC TGA ACC ATG TTG-3ʹ and reverse in exon 2 (nt 151–131): 5ʹ-AGC ACA AGT GGC TCT CCA ATC-3ʹ to give a 639 bp PCR product in intact RAGE gene. The other primer set analyzed the presence of RAGE gene deletion with one primer upstream of ATG (5ʹ- AGT GCC CAG AGG CTG CCA GTG-3ʹ) and the other downstream of the stop codon (5ʹ-CAC ACC GTG TCA AAT GTT TAC TCA GC-3ʹ, nt 1387–1362 of RAGE isoform 1) to give an estimated PCR product of 357 bp upon RAGE gene deletion.
RT-PCR and qPCR
Total RNA was isolated with TRI-Reagent (Sigma) according to the manufacturer’s instructions. RNA was reverse transcribed into cDNA using the AB high capacity cDNA kit (Applied Biosystems). For PCR, 20 ng of converted cDNA was used for each reaction using GoTaq Green Master Mix (Promega, M7122) and 1 μM of forward/reverse primer set (see below). For real-time qPCR, 20 ng of converted cDNA was used for each reaction, using Kapa Sybr-Green Master Mix (Kapa Biosystems, KK-KK4602) and 300 nM of forward/reverse primer set (see below) and run in a CFX384 BioRad Real-Time PCR apparatus. Calculations were done according to the ΔΔCt method. HPRT and TBP were used as reference genes.
RT-PCR primer pairs
HPRT (NM_013556.2): F’ 5ʹ-GTT CTT TGC TGA CCT GCT GGA T-3ʹ, R’ 5ʹ-AAC TTT TAT GTC CCC CGT TGA CT-3ʹ; Rage common exon 3–5 (NM_007425.3): F’ 5ʹ-AAC ACA GGA AGA ACT GAA GCT TGG-3ʹ, R 5-CTT TGC CAT CGG GAA TCA GAA GTT-3ʹ; Rage isoform 1 exon 8/9: F’ 5ʹ-ACG AGG ATG AGG GCA CCT ATA G-3ʹ R’ 5ʹ-TCA TCG CCG GTT TCT GTG A-3ʹ; S100A8 (NM_013650.2) F’ 5ʹ-GAG TGT CCT CAG TTT GTG CAG AAT ATA-3ʹ R’ 5ʹ-TCG CAA GGA ACT CCT CGA A-3ʹ S100A9 (NM_001281852.1) F’ 5ʹ-ATA ACC ACC ATC ATC GAC ACC TT-3ʹ, R’ 5ʹ-GTC ATT TAT GAG GGC TTC ATT TCT C-3ʹ; TBP (NM_013684.3) F’ 5ʹ-CCG TGA ATC TTG GCT GTA AAC TT-3ʹ, R’ 5ʹ-CAG TTG TCC GTG GCT CTC TTA TT-3ʹ.
Plasmid preparations
sRAGE was prepared by amplifying the extracellular RAGE part from neutrophil cDNA using Phusion Flash High-Fidelity PCR master mix and the primer pair: 5ʹ- ACT TCC GGA ATT CAC TAG TGC CGC CAC CAT GCC AGC GGG GAC AGC AGC TAG-3ʹ (EcoRI/SpeI sites, Kozac sequence, nt 45–67 of RAGE transcript variant 1, NM_007425.3) and 5ʹ- CAG TAC GAC CGG TAT GCA TCA TAT GCC CAG ACT CAC CCA CAG AGC CTT CAG C-3ʹ (AgeI/NsiI/NdeI sites and nt 1049–1023 of RAGE transcript variant 1). The EcoRI/AgeI cut PCR fragment was inserted into the EcoRI/AgeI site of a pLV_TRE_mRFP vector to which an AgeI site has been introduced.
The mutant Fc fragment of human IgG1 that do not bind Fc receptors, and in such will not encourage antibody-dependent cell-mediated cytotoxicity,Citation30 was prepared by amplifying the Fc fragment of the CSI-Ig (Fc mut)-IRES-puro plasmid kindly provided by Prof. Ofer Mandelboim (The Hebrew University of Jerusalem) using Phusion Flash High-Fidelity PCR master mix and the primer pair: 5ʹ-CAG TAC GAC CGG TGA ACC CAA GAG CTG CGA CAA G-3ʹ (contains an AgeI site) and 5ʹ- AAG GCT ACT AGC TAG CTC ATC ACT TGC CAG GGG ACA G-3ʹ (contains a NheI site). The mutant Fc fragment was cut with AgeI and NheI and inserted into the AgeI/NheI site of the pLV_TRE_mRFP-sRAGE vector.
Cathepsin G-Flagx3 was prepared by amplifying Cathepsin G from bone marrow cDNA using Phusion Flash High-Fidelity PCR master mix (ThermoFisher Scientific) and the primer pair: 5ʹ-ACT TCC GGA ATT CGC CGC CAC CAT GCA GCC TCT CCT GCT CCT GTT GACC-3ʹ (EcoRI site, nt 139–165 of Cathepsin G, NM_007800.2) and 5ʹ-AAG GCT ACT AGC TAG CAC CGG TGG TCT GTG CCT GAG ACA GGG-3ʹ (NheI and AgeI sites, nt 921–902 of Cathepsin G). The EcoRI/NheI-cut PCR product was mixed with the phosphorylated annealed primer pair for NheI-Flagx3-NotI: 5-CTA GCG ACT ACA AGG ACC ATG ACG GTG ATT ACA AGG ATC ATG ACA TCG ACT ACA AGG ATG ACG ATG ACA AGT GAGC-3ʹ and 5ʹ-GGC CGC TCA CTT GTC ATC GTC ATC CTT GTA GTC GAT GTC ATG ATC CTT GTA ATC ACC GTC ATG GTC CTT GTA GTCG-3ʹ, and inserted into the EcoRI/NotI sites of pLV_TRE_RFP.
CRISPR vectors: The primer pairs 5ʹ-CAC CGG AAG GAA GCA CCA TGC CAG-3ʹ/5-AAA CCT GGC ATG GTG CTT CCT TCC-3ʹ and 5ʹ-CAC CGA AGC GGA GAT GCC AGA GAA-3ʹ/5ʹ-AAA CTT CTC TGG CAT CTC CGC TTC-3ʹ were allowed to anneal followed by PNK (NEB) phosphorylation and insertion into the BbsI site of the pX330 vector. All plasmids were sequenced at the Center for Genomic Technologies at the Givat Ram Campus, The Hebrew University of Jerusalem.
Lentiviral infections
2.5x10⁶ 293T cells seeded the day before in 10 ml DMEM+10% heat-inactivated FCS were transfected with 20 μg of the respective lentiviral vectors, 15 μg of pCMV-ΔR8.91 gag-pol and 5 μg VSV-G (pMD2.G) using the calcium phosphate DNA precipitation method. For MigR1-luc retroviral vector pCL-Eco was used as gag-pol instead of ΔR8.91. At the following day, the medium was changed and viral supernatant collected after 24–48 h and 0.45 μm filtrated. The tumor cells were incubated in the filtrated viral supernatant in the presence of 8 μg/ml polybrene (Sigma) for 24 h. After 5–7 d, mRFP+ cells were sorted using BD FACSARIA III cell sorter. Pooled sorted cells were used for the experiments.
Antibodies
The following primary antibodies were used for Western blot analysis: Rabbit anti-Cathepsin G (Abcam, ab197354); rabbit anti-Neutrophil Elastase (Abcam, ab68672); mouse anti-RAGE N-terminus, clone A-9 (Santa Cruz, sc-365154); rabbit anti-RAGE C-terminus (Abcam, ab3611), goat-anti-S100A8 (R&D systems, AF3059); goat-anti-S100A9 (R&D systems, AF2065); mouse anti-α-Tubulin, clone DM1A (Sigma) and Biotin-SP-AffiniPure Goat anti-human Fcγ fragment (Jackson ImmunoResearch Laboratories Inc., 109–065-098). HRP-conjugated secondary antibodies against the respective species and HRP-conjugated streptavidin were purchased from Jackson ImmunoResearch Laboratories Inc. The following neutralization antibodies were used: rabbit anti-Cathepsin G (Biorbyt, orb10253) and goat-anti-RAGE (R&D systems, AF1179). These neutralization antibodies were also used for flow cytometry, followed by incubation with 2nd antibody Alexa Fluor 488-Anti-Rabbit IgG (Life Technologies, A11034) or 2nd antibody Alexa Fluor 647-Anti-Goat IgG (Life Technologies, A21447), respectively. APC-conjugated AffiniPure F(ab)2-Fragment Donkey anti-Human Fcγ fragment (Jackson ImmunoResearch Laboratories Inc., 709–136098) was used to detect Fc-fusion proteins on flow cytometry.
Flow cytometry
Isolated neutrophil was incubated with Fc blocking reagent (MACS Miltenyi Biotec, 130–092-575) in PBS containing 0.5% BSA, 2 mM EDTA and 0.02% NaN3, and then with the respective antibodies mentioned above. Binding of sRAGE-Fc-fusion protein to cells was done by incubating single cell tumor cell suspension or neutrophils with either control supernatant or sRAGE-Fc-containing supernatant followed by incubation with APC-conjugated AffiniPure F(ab)2-Fragment Donkey anti-Human Fcγ fragment (Jackson ImmunoResearch Laboratories Inc., 709–136098). The samples were analyzed on MACSQuant (Miltenyi Biotec) or BD LSR-Fortessa cell analyzer (BD Biosciences).
Cell proliferation assay
5x10³ tumor cells were seeded in 200 μl DMEM containing 10% FCS in transparent flat-bottomed 96-well plates (Corning). Cell proliferation was measured each day for three consecutive days using the MTT (Thiazolyl Blue Tetrazolium Bromide, Sigma) cell proliferation assay. Thirty minutes before the end of incubation, 10 μl of a 5 mg/ml MTT stock solution in PBS was added to each well. Thereafter, the medium was removed, and 100 μl of DMSO added to dissolve the purple formazan precipitate. Absorbance was measured at 540 nm in a Tecan F200 microplate reader.
Neutrophil cytotoxicity assay
Luciferase-containing mouse tumor cells (10,000 cells per 96-flat-bottomed white well, Corning) were plated in 100 μl OptiMEM containing 2% heat-inactivated FCS 18-20 hrs before adding neutrophils. At the following day, purified mouse normal high-density neutrophils (100,000 cells per well) were added in 50 μl OptiMEM containing 2% heat-inactivated FCS to the plated tumor cells and co-cultured overnight. Luciferase activity was measured using a Tecan F200 microplate reader as described.Citation44 D-Luciferin free acid was purchased from AnaSpec Inc. (82250) and ATP from Sigma. The percentage of tumor cell killing was calculated by the following formula: (1-LucNeut/LucCont)*100, where LucNeut is the luciferase activity in tumor cells following neutrophil interaction and LucCont the luciferase activity in control tumor cells.
For blocking experiments, neutralizing antibodies were either pre-incubated with neutrophils for 30 min prior to their addition to the tumor cells or pre-incubated with the tumor cells 30 min before neutrophil addition. Various concentrations of the antibodies were used (100 ng/ml to 1 μg/ml). For the induction of soluble receptors, the tumor cells were incubated in the presence of 1 μg/ml doxycycline (Sigma). The Cathepsin G inhibitor I was obtained from APExBIO (Cat. No A8174).
Western blot analysis
5x10⁵ tumor cells were seeded in six-well wells in 2 ml medium overnight, and then subjected to total cell lysis by adding 200 μl of a Laemmli x1.5 sample buffer to the cells followed by a 20 min-incubation at 95°C. The supernatant of cells was mixed with Laemmli x4.5 sample buffer followed by a 10 min-incubation at 95°C. The PVDF membranes were incubated with the respective antibodies mentioned above and enhanced luminescence reaction was performed by incubating the washed PVDF membranes in 1.25 mM luminol, 200 μM paracumaric acid and 3 mM H2O2 in 50 mM Tris HCl pH 8.5 for 1.5 min followed by imaging using the BioRad ChemiDoc Imager.
Co-immunoprecipitation
Control or sRAGE-Fc expressing tumor cells were lysed in 50 mM Tris HCl pH 8.0, 300 mM NaCl, 1 mM MgCl2, 10 mM KCl, 0.5% NP-40, 10% Glycerol containing EDTA-free protein inhibitor cocktail (Sigma), and incubated with protein A-Sepharose beads (Sigma) for 2 h. The beads were washed 4 times in the lysis buffer, before incubation with neutrophil lysate for 2 h and then washed four more times with the lysis buffer before analysis of co-immunoprecipitated proteins. MS/MS mass spectrometry of the samples was performed at the Smoler Protein Research Center at the Technion University, Haifa. Proteome Discoverer version 1.4 was used for peptide identifications. All data sets were searched with Mascot and SEQUEST (with probability score calculation). Peptides detected in sRAGE-Fc-protein A beads incubated with neutrophils, but not in the same beads without neutrophils, are presented in and Suppl. Table 1.
Colorimetric cathepsin g activity assay
105 purified human and mouse neutrophils were seeded in 100 μl Hank’s balanced salt solution, and the OD at 405 nm measured before adding the substrate. Thereafter, a time-course study was done in the presence of 200 μM Cathepsin G substrate (MeOSuc-Ala-Ala-Pro-Met-pNA, Biovision, Cat no 2206–5) at 405 nm using the Tecan F200 microplate reader.
Lung seeding assay
Eight-week-old female NOD-SCID mice were orthotopically (mammary fat pad) injected with 1 × 10⁶ 4T1 tumor cells in 50 μl PBS. Seven days later, the mice were randomly divided into two groups either treated daily (for three consecutive days) with 50 μg/mouse of neutrophil-depleting Ly6G antibodies (RB6-8C5, Bio X Cell, in 200 μl saline) or with vehicle. Four hours after the last injection, GFP-labeled 5 × 10⁵ parental AT3 cells or RAGE−/-AT3 cells were injected intravenously, and the number of GFP-positive cells in the lung was counted 48 h later.
Statistical analysis
For studies comparing differences between two groups, we used unpaired Student’s t-tests. Differences were considered significant when p <0.05. Data are presented as average ± SEM of 3–5 experiments unless otherwise stated.
Author Contribution
Conception and design: RVS, ZG. Development of methodology: RVS. Acquisition of data RVS, TFL, TZ, LP. Analysis and interpretation of data: RVS, ZG. Writing, review, and/or revision of the manuscript: RVS, ZG. Study supervision: CTP, ZG.
Disclosure of Potential Conflicts of Interest
The authors have declared that no conflict of interest exists.
Supplemental Material
Download Zip (780 KB)Acknowledgments
ZG is supported by grants from the I-CORE Program of The Israel Science Foundation (Grant No. 41/11), Israel Science Foundation (Grant No. 756/15), Israel Cancer Association, the Rosetrees Trust, the Lejwa Foundation, the Israel Cancer Research Foundation (RCDA) and the CONCERN foundation. We are grateful to Dr. Dan Lehman and Dr. Eleonora Medvedev for technical assistance operating the FACSARIE III Cell Sorter.
Supplementary material
Supplemental data for this article can be accessed on the publisher’s website.
Additional information
Funding
References
- Silvestre-Roig C, Hidalgo A, Soehnlein O. Neutrophil heterogeneity: implications for homeostasis and pathogenesis. Blood. 2016;127:2173–2181. doi:10.1182/blood-2016-01-688887.
- Mantovani A, Cassatella MA, Costantini C, Jaillon S. Neutrophils in the activation and regulation of innate and adaptive immunity. Nat Rev Immunol. 2011;11:519–531. doi:10.1038/nri3024.
- Sionov RV, Fridlender ZG, Granot Z. The multifaceted roles neutrophils play in the tumor microenvironment. Cancer Microenviron. 2015;8:125–158. doi:10.1007/s12307-014-0147-5.
- Coffelt SB, Wellenstein MD, de Visser KE. Neutrophils in cancer: neutral no more. Nat Rev Cancer. 2016;16:431–446. doi:10.1038/nrc.2016.52.
- Granot Z, Fridlender ZG. Plasticity beyond cancer cells and the “immunosuppressive switch”. Cancer Res. 2015;75:4441–4445. doi:10.1158/0008-5472.CAN-15-1502.
- Wculek SK, Malanchi I. Neutrophils support lung colonization of metastasis-initiating breast cancer cells. Nature. 2015;528:413–417. doi:10.1038/nature16140.
- Sagiv JY, Michaeli J, Assi S, Mishalian I, Kisos H, Levy L, Damti P, Lumbroso D, Polyansky L, Sionov RV, et al. Phenotypic diversity and plasticity in circulating neutrophil subpopulations in cancer. Cell Rep. 2015;10:562–573. doi:10.1016/j.celrep.2014.12.039.
- Granot Z, Jablonska J. Distinct functions of neutrophil in cancer and its regulation. Mediators Inflamm. 2015;2015:701067. doi:10.1155/2015/125380.
- Granot Z, Henke E, Comen EA, King TA, Norton L, Benezra R. Tumor entrained neutrophils inhibit seeding in the premetastatic lung. Cancer Cell. 2011;20:300–314. doi:10.1016/j.ccr.2011.08.012.
- Finisguerra V, Di Conza G, Di Matteo M, Serneels J, Costa S, Thompson AA, Wauters E, Walmsley S, Prenen H, Granot Z, et al. MET is required for the recruitment of anti-tumoural neutrophils. Nature. 2015;522:349–353. doi:10.1038/nature14407.
- Gershkovitz M, Caspi Y, Fainsod-Levi T, Katz B, Michaeli J, Khawaled S, Lev S, Polyansky L, Shaul ME, Sionov RV, et al. TRPM2 mediates neutrophil killing of disseminated tumor cells. Cancer Res. 2018;78:2680–2690. doi:10.1158/0008-5472.CAN-17-3614.
- Singhal S, Bhojnagarwala PS, O’Brien S, Moon EK, Garfall AL, Rao AS, Quatromoni JG, Stephen TL, Litzky L, Deshpande C, et al. Origin and role of a subset of tumor-associated neutrophils with antigen-presenting cell features in early-stage human lung cancer. Cancer Cell. 2016;30:120–135. doi:10.1016/j.ccell.2016.06.001.
- Albanesi M, Mancardi DA, Jonsson F, Iannascoli B, Fiette L, Di Santo JP, Lowell CA, Bruhns P. Neutrophils mediate antibody-induced antitumor effects in mice. Blood. 2013;122:3160–3164. doi:10.1182/blood-2013-04-497446.
- Lopez-Lago MA, Posner S, Thodima VJ, Molina AM, Motzer RJ, Chaganti RS. Neutrophil chemokines secreted by tumor cells mount a lung antimetastatic response during renal cell carcinoma progression. Oncogene. 2013;32:1752–1760. doi:10.1038/onc.2012.201.
- Cools-Lartigue J, Spicer J, McDonald B, Gowing S, Chow S, Giannias B, Bourdeau F, Kubes P, Ferri L. Neutrophil extracellular traps sequester circulating tumor cells and promote metastasis. The Journal of Clinical Investigation. 2013;123(8):3446–3458. doi:10.1172/JCI67484.
- Huh SJ, Liang S, Sharma A, Dong C, Robertson GP. Transiently entrapped circulating tumor cells interact with neutrophils to facilitate lung metastasis development. Cancer Res. 2010;70:6071–6082. doi:10.1158/0008-5472.CAN-09-4442.
- Souto JC, Vila L, Bru A. Polymorphonuclear neutrophils and cancer: intense and sustained neutrophilia as a treatment against solid tumors. Med Res Rev. 2011;31:311–363. doi:10.1002/med.20185.
- Yan J, Kloecker G, Fleming C, Bousamra M 2nd, Hansen R, Hu X, Ding C, Cai Y, Xiang D, Donninger H, et al. Human polymorphonuclear neutrophils specifically recognize and kill cancerous cells. Oncoimmunology. 2014;3:e950163. doi:10.4161/15384101.2014.950163.
- Clark RA, Klebanoff SJ. Neutrophil-mediated tumor cell cytotoxicity: role of the peroxidase system. J Exp Med. 1975;141:1442–1447. doi:10.1084/jem.141.6.1442.
- Lichtenstein A, Kahle J. Anti-tumor effect of inflammatory neutrophils: characteristics of in vivo generation and in vitro tumor cell lysis. Int J Cancer. 1985;35:121–127.
- Rørvig S, Østergaard O, Heegaard NH, Borregaard N. Proteome profiling of human neutrophil granule subsets, secretory vesicles, and cell membrane: correlation with transcriptome profiling of neutrophil precursors. J Leukoc Biol. 2013;94:711–721. doi:10.1189/jlb.1212619.
- Owen CA, Campbell MA, Sannes PL, Boukedes SS, Campbell EJ. Cell surface-bound elastase and cathepsin G on human neutrophils: a novel, non-oxidative mechanism by which neutrophils focus and preserve catalytic activity of serine proteinases. J Cell Biol. 1995;131:775–789. doi:10.1083/jcb.131.3.775.
- Pinho SS, Reis CA. Glycosylation in cancer: mechanisms and clinical implications. Nat Rev Cancer. 2015;15:540–555. doi:10.1038/nrc3982.
- Hudson BI, Lippman ME. Targeting RAGE signaling in inflammatory disease. Annu Rev Med. 2018;69:349–364. doi:10.1146/annurev-med-041316-085215.
- Riehl A, Nemeth J, Angel P, Hess J. The receptor RAGE: bridging inflammation and cancer. Cell Commun Signal. 2009;7:12. doi:10.1186/1478-811X-7-12.
- Gebhardt C, Riehl A, Durchdewald M, Nemeth J, Furstenberger G, Muller-Decker K, Enk A, Arnold B, Bierhaus A, Nawroth PP, et al. RAGE signaling sustains inflammation and promotes tumor development. J Exp Med. 2008;205:275–285. doi:10.1084/jem.20070679.
- Turovskaya O, Foell D, Sinha P, Vogl T, Newlin R, Nayak J, Nguyen M, Olsson A, Nawroth PP, Bierhaus A, et al. RAGE, carboxylated glycans and S100A8/A9 play essential roles in colitis-associated carcinogenesis. Carcinogenesis. 2008;29:2035–2043. doi:10.1093/carcin/bgn188.
- Kang R, Hou W, Zhang Q, Chen R, Lee YJ, Bartlett DL, Lotze MT, Tang D, Zeh HJ. RAGE is essential for oncogenic KRAS-mediated hypoxic signaling in pancreatic cancer. Cell Death Dis. 2014;5:e1480. doi:10.1038/cddis.2014.445.
- Nasser MW, Wani NA, Ahirwar DK, Powell CA, Ravi J, Elbaz M, Zhao H, Padilla L, Zhang X, Shilo K, et al. RAGE mediates S100A7-induced breast cancer growth and metastasis by modulating the tumor microenvironment. Cancer Res. 2015;75:974–985. doi:10.1158/0008-5472.CAN-14-2161.
- Stanietsky N, Simic H, Arapovic J, Toporik A, Levy O, Novik A, Levine Z, Beiman M, Dassa L, Achdout H, et al. The interaction of TIGIT with PVR and PVRL2 inhibits human NK cell cytotoxicity. Proc Natl Acad Sci U S A. 2009;106:17858–17863. doi:10.1073/pnas.0903474106.
- Edgeworth J, Gorman M, Bennett R, Freemont P, Hogg N. Identification of p8,14 as a highly abundant heterodimeric calcium binding protein complex of myeloid cells. J Biol Chem. 1991;266:7706–7713.
- Ibrahim ZA, Armour CL, Phipps S, Sukkar MB. RAGE and TLRs: relatives, friends or neighbours? Mol Immunol. 2013;56:739–744. doi:10.1016/j.molimm.2013.07.008.
- Kwak T, Drews-Elger K, Ergonul A, Miller PC, Braley A, Hwang GH, Zhao D, Besser A, Yamamoto Y, Yamamoto H, et al. Targeting of RAGE-ligand signaling impairs breast cancer cell invasion and metastasis. Oncogene. 2017;36:1559–1572. doi:10.1038/onc.2016.324.
- Shahab U, Ahmad MK, Mahdi AA, Waseem M, Arif B, Moinuddin M, Ahmad S. The receptor for advanced glycation end products: a fuel to pancreatic cancer. Seminars in Cancer Biology. 2018;49:37–43. doi:10.1016/j.semcancer.2017.07.010.
- Malik P, Chaudhry N, Mittal R, Mukherjee TK. Role of receptor for advanced glycation end products in the complication and progression of various types of cancers. Biochim Biophys Acta. 2015;1850:1898–1904. doi:10.1016/j.bbagen.2015.05.020.
- Palanissami G, Paul SFD. RAGE and its ligands: molecular interplay between glycation, inflammation, and hallmarks of cancer-a review. Horm Cancer. 2018;9:295–325. doi:10.1007/s12672-018-0342-9.
- Fischer KR, Durrans A, Lee S, Sheng J, Li F, Wong ST, Choi H, El Rayes T, Ryu S, Troeger J, et al. Epithelial-to-mesenchymal transition is not required for lung metastasis but contributes to chemoresistance. Nature. 2015;527:472–476. doi:10.1038/nature15748.
- Yu YX, Pan WC, Cheng YF. Silencing of advanced glycosylation and glycosylation and product-specific receptor (RAGE) inhibits the metastasis and growth of non-small cell lung cancer. Am J Transl Res. 2017;9:2760–2774.
- Korkmaz B, Horwitz MS, Jenne DE, Gauthier F. Neutrophil elastase, proteinase 3, and cathepsin G as therapeutic targets in human diseases. Pharmacol Rev. 2010;62:726–759. doi:10.1124/pr.110.002733.
- Ortega-Gomez A, Salvermoser M, Rossaint J, Pick R, Brauner J, Lemnitzer P, Tilgner J, de Jong RJ, Megens RTA, Jamasbi J, et al. Cathepsin G controls arterial but not venular myeloid cell recruitment. Circulation. 2016;134:1176–1188. doi:10.1161/CIRCULATIONAHA.116.024790.
- Constien R, Forde A, Liliensiek B, Grone HJ, Nawroth P, Hammerling G, Arnold B. Characterization of a novel EGFP reporter mouse to monitor Cre recombination as demonstrated by a Tie2 Cre mouse line. Genesis. 2001;30:36–44.
- Bierhaus A, Haslbeck KM, Humpert PM, Liliensiek B, Dehmer T, Morcos M, Sayed AAR, Andrassy M, Schiekofer S, Schneider JG, et al. Loss of pain perception in diabetes is dependent on a receptor of the immunoglobulin superfamily. J Clin Invest. 2004;114:1741–1751. doi:10.1172/JCI18058.
- Woloszynek JC, Hu Y, Pham CT. Cathepsin G-regulated release of formyl peptide receptor agonists modulate neutrophil effector functions. J Biol Chem. 2012;287:34101–34109. doi:10.1074/jbc.M112.394452.
- Sionov RV, Assi S, Gershkovitz M, Sagiv JY, Polyansky L, Mishalian I, Fridlender ZG, Granot Z. Isolation and characterization of neutrophils with anti-tumor properties. J Vis Exp. 2015;e52933. doi: 10.3791/52933.