
 ?Mathematical formulae have been encoded as MathML and are displayed in this HTML version using MathJax in order to improve their display. Uncheck the box to turn MathJax off. This feature requires Javascript. Click on a formula to zoom.
ABSTRACT
The dynamics of immunoaging and the onset of immunoparesis in healthy individuals and cancer patients has been controversially discussed. Moreover, the role of chemotherapy on T cell regeneration needs further elucidation in light of novel immunotherapies that have become standard of care for many elderly cancer patients. We used next-generation immunosequencing to study T cell receptor (TCR) repertoire metrics on 346 blood samples from healthy individuals and cancer patients producing a dataset with around 8.8 million TCR reads. This analysis showed that decline of T cell diversity and increase in T cell clonality is a continuous process beginning in healthy individuals over 40 years of age. Untreated patients with both hematological and solid tumors showed blood TCR repertoires with significantly lower diversity and higher clonality as compared to healthy individuals across all decades. Loss in T cell diversity was essentially driven by a loss in richness in aging healthy individuals, while in cancer patients a loss in repertoire evenness was an additional contributing factor. Interestingly, chemotherapy did not impair the regeneration of blood TCR repertoire diversity to pre-treatment age-specific levels. Surprisingly, even patients over the age of 70 years receiving highly T cell toxic therapies reestablished their pre-treatment T cell diversity suggesting rebound thymic activity rather than recovery of T cell counts by peripheral expansion only. Taken together, these data suggest that human TCR repertoire metrics gradually deteriorate in the aging individual, but age-specific TCR metrics are restored after T cell depleting therapy even in elderly cancer patients.
Introduction
A decrease in immune function over time is thought to explain increasing rates of infection, autoimmunity and cancer with age .Citation1 T cells are traditionally connected with this concept, since the thymus that generates the naïve T cell repertoire from bone marrow derived hematopoietic stem cells undergoes a visible decline from child- to adulthood .Citation2 This thymic involution is associated with a disorganization of the thymic tissue architecture, a decrease of the thymic stroma and its replacement by adipose tissue.Citation3,Citation4 Due to this visible, age-dependent decline, thymus-dependent T cell recovery has been assumed to be severely limited in adults. However, age-associated T cell immunoparesis is not only restricted to thymic involution since it also involves aging of hematopoietic stem cells, lymphoid progenitors and mature lymphocytes in secondary lymphoid organs.Citation5
T cell reconstitution is a critical feature of the recovery of the adaptive immune response and has two main components: thymic output of new T cells and peripheral homeostatic expansion of preexisting T cells. To explore immune repertoire metrics over time, extrapolations from animal models are not useful since – despite many immunological principles being shared across species – the size of the T cell system and the lifespan of typical animal models are fundamentally different from the human system.Citation6 Studies on immunoaging and immune reconstitution in humans gave inconsistent results partly due to the use of methods that should be interpreted with caution, such as T cell receptor excision circle (TREC) measurements.Citation7–Citation9 In 2014, a next-generation sequencing (NGS) study by Britanova et al. has analyzed an extensive set of 39 healthy individuals setting the benchmark for studies on age-dependent TCR repertoire immunodynamics. As opposed to previous studies using less precise technologies, this group found a linear decrease of T cell diversity over time with significant reduction already apparent at age 40.Citation10
Unlike in the healthy population, it is still a matter of debate if cancer patients are able to restore a functional TCR repertoire after cytotoxic and notably often T cell toxic therapy. In this comprehensive analysis of 346 TCR repertoires we found clear evidence for premature immunoaging in cancer patients independent of their treatment. To our surprise, however, we found that even elderly patients undergoing T cell toxic therapies largely reconstituted their age-specific TCR repertoire arguing strongly in favor of the hypothesis that thymic output may be reactivated driven by treatment induced lymphopenia.
Methods
Study approval
Informed consent was obtained from all patients and healthy donors (HD) for the use of their peripheral blood (PB) as approved by the ethics commission Hamburg (Ethikkommission der Ärztekammer Hamburg, Germany, project number PV4767). The study has been performed in accordance with the declaration of Helsinki of 1975.
Patients and samples
We included a cohort of 218 cancer patients, 94 of which with hematological cancers (hemC), 124 with solid cancers (solC) and 95 healthy donors (HD) as a reference cohort. In all investigated age groups (≤30, 31 to 40, 41 to 50, 51 to 60, 61 to 70 and ≥70) we included a minimum of 3 individuals. The analyses presented in and include two different subcohorts: (i) matched patients according to age and tumor type who were untreated or received chemotherapy (labeled as „samples from different age-matched patients“). (ii) patients who had paired samples taken prior to and after chemotherapy (labeled as „paired samples from pre-post chemotherapy“). Patients with blood involvement by their disease were excluded from the analysis. Information on patient and sample characteristics are summarized in Supplementary Table 1.
Multiplex PCR of T cell receptor beta (TRB) repertoire for Illumina targeted next-generation sequencing (NGS)
The rearranged TRB receptor sequence containing the entire V, D and J gene segments was amplified using a mixed primer TRB-A/B pool and a touch-down PCR protocol from peripheral blood (PB) genomic DNA .Citation11 In two consecutive PCR reactions, amplicons were tagged with Illumina adapters and indices as previously described.Citation12–Citation16 PCRs were performed using Phusion HS II (Thermo Fisher Scientific Inc., Germany). Amplicons were purified after agarose gel electrophoresis using the NucleoSpin® Gel and PCR Clean-up kit (Macherey-Nagel, Germany). Before being subjected to NGS, the concentration and quality of the amplicons/libraries was determined using Qubit (QIAGEN, Germany) and Agilent 2100 Bioanalyzer (Agilent technologies, Germany), respectively.
Illumina next-generation sequencing (NGS)
NGS and de-multiplexing was performed on an Illumina MiSeq sequencer (600–cycle, single indexed, paired-end run). Analysis of the TRB locus was computed using the MiXCR analysis tool V2.12 and V3.0.5.Citation15,Citation17 Each unique complementarity-determining region 3 (CDR3) nucleotide sequence was defined as one clone and all clones of one sample/timepoint were defined as one TCR repertoire. Only productive sequences with a read count ≥ 2 were included in the analysis.
Calculation of repertoire metrics
For this work, a number of indices reflecting broad repertoire metrics were used:
The Shannon index (H) is a commonly used measure of diversity,Citation18 which can be calculated as follows:
where S is the number of species/clones (richness) and p is the proportion of each clone within the repertoire. p = n/N, n = read count of each individual clone and N = the sum of all reads in the repertoire.
Since the Shannon index is a diversity measure that weighs small and large clones relatively evenly, we plotted diversity curves with alpha-modulated sensitivity for the relatively rare clones (alpha-parameterized diversity.Citation19 As α increases, high frequency clones are weighed more. We generated diversity profile curves for α = 0 to α = 5, in steps of 0.2 using the R script kindly provided by Dr. V. Greiff of University of Oslo, Institute of Clinical Medicine.
Evenness is calculated from H and Hmax (evenness = ) with Hmax being the maximal possible value of H, if every clone in the repertoire was present at the same frequency.
The clonality index is the reciprocal value of evenness (clonality = 1 – evenness). It assumes a value between 1 and 0, with 1 being a repertoire consisting of only one clone and 0 being a repertoire of maximal evenness.
Generation probability calculation
We investigated the generation probability of the T cell clones in our paired patient samples before and after chemotherapy treatment using the IGoR algorithm.Citation20 All values are depicted on a square root scale for plotting purposes. T cell clones with low generation probability are presumed to be peripherally expanded by antigen pressure, whereas T cell clones exhibiting a high generation probability accumulate by random V(D)J recombination. Therefore, a T cell repertoire, which has seen antigens over a lifetime is expected to have a lower mean generation probability compared to a newly formed T cell repertoire (e.g. after lymphodepleting chemotherapy).
Data analysis
Analyses were carried out and data plotting was performed using R (version 3.4.4)Citation21 and the package tcRCitation22 as well as GraphPad Prism 7 (San Diego, CA). A P value of <0.05 was considered statistically significant.
Data availability
The datasets generated for this study can be found in the European Nucleotide Archive (ENA). ID: PRJEB33490
Results
Broad immune metrics in healthy individuals vs. cancer patients
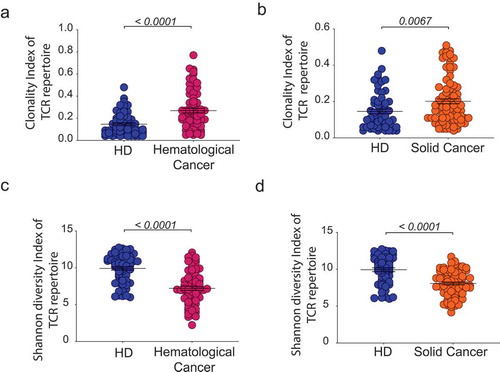
A cohort of 85 untreated patients with hematological cancers (hemC) and 108 patients with solid tumors (solC) was subjected to peripheral blood T cell repertoire profiling by NGS and their T cell spaces were compared to 95 healthy individuals (HD). To account for differences in the immune repertoire due to age differences, we compared subcohorts of patients (hemC and solC, respectively) to age-matched subcohorts of HDs. Untreated patients with hematological (but non-T-cell) cancers showed significantly higher clonality and lower blood T cell diversity (p < .0001) compared to HDs (). This was expected since these patients had infiltration of primary and/or secondary lymphoid organs potentially impairing emigration of hematopoietic precursors to the thymus and/or peripheral T cell expansion. Yet, also untreated patients with solid malignancies showed significantly more clonal (p = .0067) and less diverse (p < .0001) repertoires compared to their respective age-matched subgroup of HDs (). Taken together, HDs showed more diverse and more evenly distributed peripheral blood TCR repertoires as compared to patients with hematological or solid cancers.
Figure 1. Comparison of T cell repertoire metrics between patients with cancer and healthy individuals.
Clonality index with mean ±SEM of PB TCR repertoire of patients with hemC (n = 70) compared to age-matched HDs (n = 68) (a) and patients with solC (n = 89) compared to age-matched HDs (n = 58) (b). Shannon diversity index with mean ±SEM of PB TCR repertoire of patients with hemC (n = 70) compared to age-matched HDs (n = 68) (c) and patients with solC (n = 89) compared to age-matched HDs (n = 58) (d). Statistical test: unpaired two-sided t-test.
Age-dependent immune metrics in healthy individuals and cancer patients
Patients and HDs were binned in to age groups spanning ten years ranging from below 30 to over 70 years of age. As rough estimates of age-dependent repertoire metrics, T cell clonality and diversity were calculated ( and ). In patients with cancer, the increase in repertoire clonality started at earlier age groups as compared to HDs (). Mean clonal space distributions showed that in elderly HDs up to an age of 60 years, small clones still make up approximately 15% of the T cell space while the repertoire fraction of small T cell clones is neglectable in cancer patients over 30 years of age (). In line with previously published data, Citation10 healthy donors showed a clear contraction of their T cell repertoires with increasing age as indicated by the decreased diversity, beginning approximately beyond age 40 (correlation coefficient R2 = 0.27, p < .0001, ). For patients with solid or hematological malignancies a similar age-dependent decline of T cell repertoire diversity was observed, however, at much steeper slope (correlation coefficient solid cancer R2 = 0.08, p = .003, hematological cancer R2 = 0.13, p < .0001, ). We dissected the single parameters of diversity (richness and evenness) to better understand how they account for the decline in diversity over age (). The decreased diversity in healthy aging appeared to be most explained by a loss of richness since the repertoires stayed relatively even over time (). In the aging cancer patient, however, both losses in richness and evenness contributed to the loss of T cell diversity ().
Figure 2. Age-dependent TCR repertoire clonality in healthy individuals and patients with cancer.
Clonality index with mean ±SD of PB TCR repertoire of HD, solC and hemC patients, plotted according to age group (a). Mean clonal space distribution of PB TCR repertoire in HD, solC patients and hemC patients per age group (b). Clone sizes are defined as hyperexpanded (0.01 < x ≤ 1), large (0.001 < x ≤ 0.01), medium (1E-04 < x ≤ 0.001), small (1E-05 < x ≤ 1E-04). Number of individuals per age group: HD/solC/hemC, ≤30: 17/5/9, 31–40: 14/8/3, 41–50: 15/14/8, 51–60: 16/28/15, 61–70: 16/23/24, ≥70: 17/29/37. Statistical test: unpaired, two-sided t-test between two subgroups, Pearson correlation between age and clonality index.
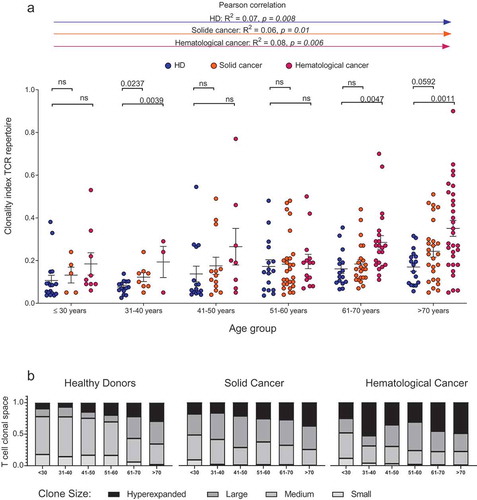
Figure 3. Age-dependent TCR repertoire diversity in healthy individuals and patients with cancer.
Shannon diversity index with mean ±SD of PB TCR repertoire of HD, solC and hemC patients, plotted according to age group (a). Mean ±SEM diversity curves of PB TCR repertoire in HD, solC patients and hemC patients per age group (b). Grey boxes indicate alpha = 1 resembles Shannon Index, alpha = 2 resembles Simpson´s Index. Number of individuals per age group: HD/solC/hemC, ≤30: 17/5/9, 31–40: 14/8/3, 41–50: 15/14/8, 51–60: 16/28/15, 61–70: 16/23/24, ≥70: 17/29/37. Statistical test: unpaired, two-sided t-test between two subgroups, Pearson correlation between age and Shannon index.
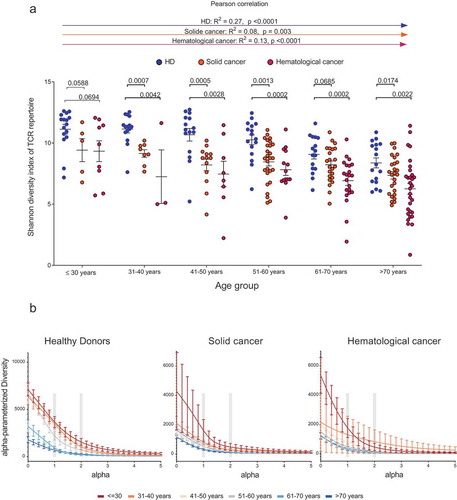
Figure 4. Correlation between age and TCR repertoire evenness/richness.
Pearson correlation between age [years] and T cell repertoire evenness in HD (a), hemC (c) and solC (e) patients. Pearson correlation between age [years] and T cell repertoire richness in HD (b), hemC (d) and solC (f). Black line indicates regression model.
![Figure 4. Correlation between age and TCR repertoire evenness/richness.Pearson correlation between age [years] and T cell repertoire evenness in HD (a), hemC (c) and solC (e) patients. Pearson correlation between age [years] and T cell repertoire richness in HD (b), hemC (d) and solC (f). Black line indicates regression model.](/cms/asset/ae130e60-763a-4c50-8159-10dbc2923383/koni_a_1644110_f0004_oc.jpg)
Reconstitution of age-specific T cell repertoire metrics after chemotherapy
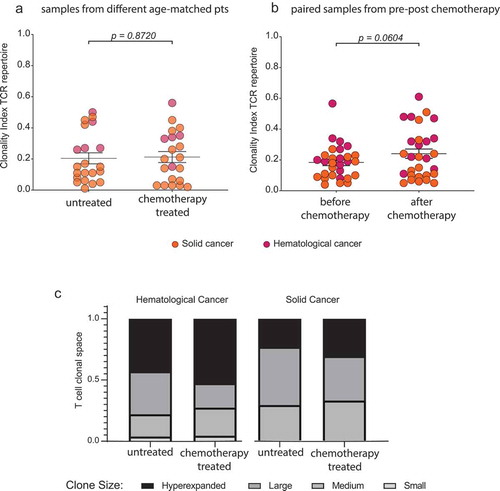
Next, we investigated T cell regenerative potential after chemotherapy in patients with cancer and a median age of 60 years. In these patients, disease- and age-specific T cell repertoire differences were already discernible before treatment initiation. We investigated a cohort of cancer patients (predominantly with solid tumors) after various types of chemotherapy and compared them with a control cohort of disease- and age-matched untreated cancer patients ( and ). Interestingly, there were no significant differences between treated and untreated patients in terms of T cell repertoire diversity or clonality ( and ). In addition, we wished to assess repertoire changes through chemotherapy in individual patients (paired subcohort) over time. This analysis – carried out in patients with chronic lymphocytic leukemia (CLL) receiving fludarabine- or bendamustine-based therapy and in brain tumor patients receiving temozolomide-based therapy – suggested that the T cell repertoire largely recovered to the age-specific pre-treatment diversity/clonality, even in elderly patients undergoing T cell toxic treatment ( and ). Only in the fludarabine-treated cohort of haematological patients with CLL a trend towards higher clonality after treatment was recognizable (), but diversity measures remained stable (). Taking together both cohorts, no drastic changes in diversity () or clonality () were apparent after chemotherapy.
Figure 5. Effect of chemotherapy on T cell diversity in cancer patients.
Shannon diversity index with mean ±SEM of PB TCR repertoire of untreated and chemotherapy treated age-matched solC (n = 5) and hemC (n = 16) patient samples (a) and of paired solC (n = 12) and hemC (n = 17) patient samples before and after chemotherapy (b). Mean ±SEM diversity curves of PB TCR repertoire of untreated and chemotherapy treated samples from hemC patients (n = 16 + 17) (c) and solC patients (n = 5 + 12) (d). Statistical test: unpaired, two-sided t-test.]
![Figure 5. Effect of chemotherapy on T cell diversity in cancer patients.Shannon diversity index with mean ±SEM of PB TCR repertoire of untreated and chemotherapy treated age-matched solC (n = 5) and hemC (n = 16) patient samples (a) and of paired solC (n = 12) and hemC (n = 17) patient samples before and after chemotherapy (b). Mean ±SEM diversity curves of PB TCR repertoire of untreated and chemotherapy treated samples from hemC patients (n = 16 + 17) (c) and solC patients (n = 5 + 12) (d). Statistical test: unpaired, two-sided t-test.]](/cms/asset/821706cd-498e-48b0-a9d7-ce425d34c325/koni_a_1644110_f0005_oc.jpg)
Figure 6. Effect of chemotherapy on T cell clonality in cancer patients.
Clonality index with mean ±SD of PB TCR repertoire of untreated and chemotherapy treated age-matched solC (n=5) and hemC (n=16) patient samples (a) and of paired solC (n=12) and hemC (n=17) patient samples before and after chemotherapy (b). Mean clonal space distribution of PB TCR repertoire of untreated and chemotherapy treated samples from solC patients (n=5+12) and hemC patients (n=16+17) (c). Clone sizes are defined as hyperexpanded (0.01 < x ≤ 1), large (0.001 < x ≤ 0.01), medium (1E-04 < x ≤ 0.001), small (1E-05 < x ≤ 1E-04). Statistical test: unpaired, two-sided t-test.
Rebound thymic activity rather than peripheral T cell expansion leads to reconstitution of the T cell repertoire after chemotherapy
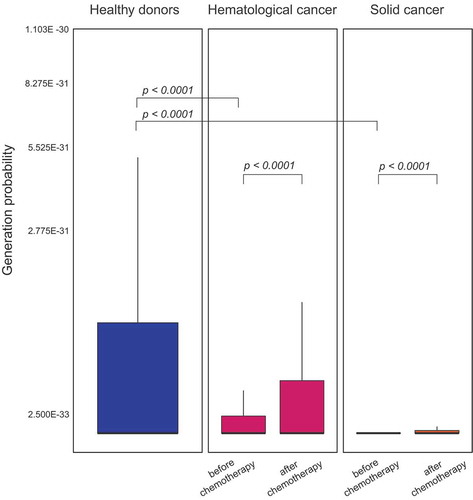
Repertoire overlap analysis in the two cohorts (glioblastoma, CLL) with paired pre- and post-treatment blood samples showed almost no clonal overlap whereas control TCR repertoires of HDs recorded over several months to years presented a clear clonal overlap even after years of re-sampling (). This corroborated our assumption that full reconstitution of TCR repertoire diversity and evenness after highly hematotoxic therapies was due to rebound thymic activity rather than peripheral T cell expansion. To confirm this further, we subjected these repertoires to an algorithm, which calculates the generation probability for each recombined receptor sequence found in the productive repertoire. Since TCR repertoires shaped over time by clonal peripheral expansion contain higher numbers of clones with lower generation probabilities (selected by specific antigens), we hypothesized that rebound thymic output after chemotherapy may lead to repertoires shifted towards clones with higher generation probabilities. Generally, we observed lower generation probabilities in T cells of untreated cancer patients as compared to healthy subjects, pointing to more peripheral expansion of clones in the cancer patients. Moreover, in line with our hypothesis, we observed a clear shift (hemC: p = 1.3E −15, solC: p < 2.2E −16) towards an increased median generation probability over the treatment interval in the cancer patient cohorts (). This data suggested that hematotoxic chemotherapies eradicate T cell clones in the periphery followed by repertoire reconstitution through rebound thymic output.
Figure 7. T cell repertoire overlap in healthy individuals and patients with cancer pre and post chemotherapy.
TCR repertoire overlap matrix based on CDR3 amino acid sequence of long-term follow-up samples of HD (n = 4) (indicated by year dates) and of paired solC patient (n = 17) and hemC patient (n = 12) samples before and after chemotherapy, respectively. CDR3 – complementarity determining region 3
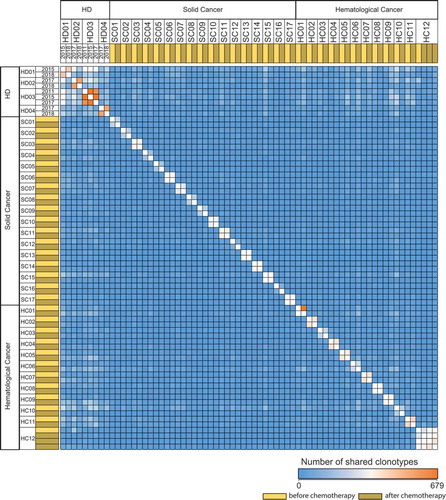
Figure 8. Generation probability of TCR repertoires.
Boxplot of generation probability of long-term follow-up TCR repertoire of HD (n = 4) and paired samples of patients with hemC (n = 12) and patients with solC (n = 17) before and after chemotherapy, respectively. Statistical test: Wilcoxon test.
Discussion
Age-, disease- and treatment-associated impairment of T cell immunity in cancer patients is clinically relevant as it determines susceptibility to infection (especially viral reactivations and opportunistic infections) as well as anti-tumor immune control. It may also be a relevant factor that influences response to immune-activating antibodies that have become one of the mainstays of systemic cancer treatment over the past years. NGS immunosequencing is an advanced technology for T cell repertoire metrics analysis with the potential to precisely assess repertoire changes in immunoaging, cancer-associated immunosuppression or post-treatment immune reconstitution. It allows simultaneous identification of tens of thousands to millions of T cell receptor (TCR) rearrangements from a single tissue sample. In this way, this technology makes it possible to characterize large repertoires in depth and at high throughput, to monitor repertoires over time and to integrate all information to derive quantitative and reliable repertoire metrics such as clonality and diversity indices or clonal space distribution.
Here, we report the first study applying this approach to an unprecedented number of peripheral blood samples derived from chemotherapy-treated and -untreated patients with solid and hematological malignancies as well as healthy control subjects. The NGS data deposited with this manuscript may serve as the so far most extensive publically accessible database on T cell immune repertoires and may be exploited by the scientific community for further analyzes. Bioinformatic analyzes presented in this manuscript may be condensed to three essential findings: i) the T cell space qualitatively deteriorates with age as evidenced by loss of diversity and increasing clonality, ii) the age-dependent impairment in T cell metrics is more pronounced in patients with cancer than in healthy subjects and iii) age-specific repertoire metrics can be fully restored after lymphotoxic treatment even in elderly patients with cancer. These findings open up interesting new perspectives on immunoaging, carcinogenesis and immune reconstitution in cancer patients as well as they may influence the way we think about treatment algorithms of immunological and cytotoxic cancer treatment. One essential aspect of this (which is in contrast to previously published workCitation23,Citation24) is our NGS data suggest there is a significant contribution by the thymus to immune reconstitution after T cell toxic chemotherapy in adults, even in the age group above 70 years. The full recovery of T cell diversity after treatment in this age group was rather unexpected and – while acknowledging that this data does not allow to draw any conclusions about immunological memory – it suggests that we may not have to fear drastic and uncompensated diversity losses through chemotherapy that would endanger the success of subsequent administered immune-stimulating antibodies in the elderly population.
Moreover, we were surprised to see clear-cut signs of premature immunoaging in treatment-naïve cancer patients. Of note, the considerably impaired diversity and clonality indices in cancer patients were not a confounding result of infiltration of lymphatic organs with subsequent displacement of lymphopoiesis since also patients with solid tumors without infiltration of lymphatic organs showed the same impairment. Clonality is not the counterpart of diversity in that increases in clonality do not necessarily reduce the overall diversity of the repertoire. Therefore, while increased blood T cell clonality in patients with cancer may simply reflect ongoing anti-tumor immune responses, the significantly lower age-adjusted diversity in these T cell repertoires may also point to pre-existing T cell repertoire defects that could be seen not only as a consequence, but also as a potential basis favoring carcinogenesis.
As TCR sequencing becomes more and more available to the scientific community and a growing number of research questions in the field of autoimmunity, vaccination and infection are addressed, our data may add a new level of evidence for age-specific biases in TCR repertoires. Studies on T cell repertoires need to be aware of these biases described in our study and therefore need to rigorously work with age-matched cohorts.
Taken together, our work gives valuable insight into immunoaging in health and disease and provides a reference NGS dataset of TCR repertoires across all age groups that may serve the scientific community for future studies.
Correction Statement
This article has been republished with minor changes. These changes do not impact the academic content of the article.
Supplemental Material
Download MS Word (38.2 KB)Acknowledgments
We thank Barbara Goesch for expert technical assistance and Janina Schlüter for processing of blood samples. We like to acknowledge Prof. Zeller for the allocation of healthy donor genomic DNA samples used in this study. Finally, we are grateful to all healthy donors and patients for their valuable blood donation.
Disclosure statement
Author LF is employed by ENPICOM B.V. All other authors declare no competing interests.
Supplementary material
Supplemental data for this article can be accessed on the publisher’s website.
Additional information
Funding
References
- Montecino-Rodriguez E, Berent-Maoz B, Dorshkind K. Causes, consequences, and reversal of immune system aging. J Clin Invest. 2013; 123(3):958–965. Epub 2013/03/05. doi:10.1172/JCI64096. PubMed PMID: 23454758; PMCID: PMC3582124.
- Simon AK, Hollander GA, McMichael A. Evolution of the immune system in humans from infancy to old age. Proc Biol Sci. 2015; 282(1821):20143085. Epub 2015/ 12/25. doi:10.1098/rspb.2014.3085. PubMed PMID: 26702035; PMCID: PMC4707740.
- Famili F, Wiekmeijer AS, Staal FJ. The development of T cells from stem cells in mice and humans. Future Sci OA. 2017; 3(3):Fso186. Epub 2017/09/09. doi:10.4155/fsoa-2016-0095. PubMed PMID: 28883990; PMCID: PMC5583695.
- Yanes RE, Gustafson CE, Weyand CM, Goronzy JJ. Lymphocyte generation and population homeostasis throughout life. Semin Hematol. 2017; 54(1):33–38. Epub 2017/01/17. doi:10.1053/j.seminhematol.2016.10.003. PubMed PMID: 28088985; PMCID: PMC5260809.
- Linton PJ, Dorshkind K. Age-related changes in lymphocyte development and function. Nat Immunol. 2004; 5(2):133–139. Epub 2004/01/30. doi:10.1038/ni1033. PubMed PMID: 14749784.
- Den Braber I, Mugwagwa T, Vrisekoop N, Westera L, Mogling R, de Boer AB, Willems N, Schrijver EH, Spierenburg G, Gaiser K, et al. Maintenance of peripheral naive T cells is sustained by thymus output in mice but not humans. Immunity. 2012; 36(2):288–297. Epub 2012/03/01. doi:10.1016/j.immuni.2012.02.006. PubMed PMID: 22365666.
- Mitchell WA, Lang PO, Aspinall R. Tracing thymic output in older individuals. Clin Exp Immunol PubMed PMID: WOS:000280990300012. 2010;161(3):497–503. doi:10.1111/j.1365-2249.2010.04209.x.
- Douek DC, Vescio RA, Betts MR, Brenchley JM, Hill BJ, Zhang L, Berenson JR, Collins RH, Koup RA. Assessment of thymic output in adults after haematopoietic stem-cell transplantation and prediction of T-cell reconstitution. Lancet. 2000; 355(9218):1875–1881. Epub 2000/ 06/24. doi:10.1016/S0140-6736(00)02293-5. PubMed PMID: 10866444.
- Williams KM, Hakim FT, Gress RE. T cell immune reconstitution following lymphodepletion. Semin Immunol. 2007; 19(5):318–330. Epub 2007/11/21. doi:10.1016/j.smim.2007.10.004. PubMed PMID: 18023361; PMCID: PMC2180244.
- Britanova OV, Putintseva EV, Shugay M, Merzlyak EM, Turchaninova MA, Staroverov DB, Bolotin DA, Lukyanov S, Bogdanova EA, Mamedov IZ, et al. Age-related decrease in TCR repertoire diversity measured with deep and normalized sequence profiling. J Immunol. 2014; 192(6):2689–2698. Epub 2014/ 02/11. doi:10.4049/jimmunol.1302064. PubMed PMID: 24510963.
- van Dongen JJ, Langerak AW, Bruggemann M, Evans PA, Hummel M, Lavender FL, Delabesse E, Davi F, Schuuring E, Garcia-Sanz R, et al. Design and standardization of PCR primers and protocols for detection of clonal immunoglobulin and T-cell receptor gene recombinations in suspect lymphoproliferations: report of the BIOMED-2 Concerted Action BMH4-CT98-3936. Leukemia PubMed PMID: 14671650. 2003;17(12):2257–2317. doi:10.1038/sj.leu.2403202.
- Akyuz N, Brandt A, Stein A, Schliffke S, Mahrle T, Quidde J, Goekkurt E, Loges S, Haalck T, Ford CT, et al. T-cell diversification reflects antigen selection in the blood of patients on immune checkpoint inhibition and may be exploited as liquid biopsy biomarker. Int J Cancer. 2017; 140(11):2535–2544. Epub 2016/12/08. doi:10.1002/ijc.30549. PubMed PMID: 27925177.
- Mährle T, Akyüz N, Fuchs P, Bonzanni N, Simnica D, Germing U, Asemissen AM, Jann J-C, Nolte F, Hofmann W-K, et al. Deep sequencing of bone marrow microenvironments of patients with del(5q) myelodysplastic syndrome reveals imprints of antigenic selection as well as generation of novel T cell clusters as response pattern to lenalidomide2019. Haematologica. 2019 Jul;104(7):1355–1364.
- Mohme M, Schliffke S, Maire CL, Runger A, Glau L, Mende KC, Matschke J, Gehbauer C, Akyuz N, Zapf S, et al. Immunophenotyping of newly diagnosed and recurrent glioblastoma defines distinct immune exhaustion profiles in peripheral and tumor-infiltrating lymphocytes. Clin Cancer Res. 2018;24(17):4187–4200. Epub 2018/02/16. doi:10.1158/1078-0432.CCR-17-2617. PubMed PMID: 29444930.
- Schliffke S, Akyuz N, Ford CT, Mahrle T, Thenhausen T, Krohn-Grimberghe A, Knop S, Bokemeyer C, Binder M. Clinical response to ibrutinib is accompanied by normalization of the T-cell environment in CLL-related autoimmune cytopenia. Leukemia. 2016;30(11):2232–2234. Epub 2016/11/03. doi:10.1038/leu.2016.157. PubMed PMID: 27220665.
- Schliffke S, Carambia A, Akyüz N, Thiele B, Herkel J, Binder M. T-cell repertoire profiling by next-generation sequencing reveals tissue migration dynamics of TRBV13-family clonotypes in a common experimental autoimmune encephalomyelitis mouse model. J Neuroimmunol. 2019;332:49–56. doi:10.1016/j.jneuroim.2019.03.014.
- Bolotin DA, Poslavsky S, Mitrophanov I, Shugay M, Mamedov IZ, Putintseva EV, Chudakov DM. MiXCR: software for comprehensive adaptive immunity profiling. Nat Methods. 2015; 12(5):380–381. Epub 2015/ 04/30. doi:10.1038/nmeth.3364. PubMed PMID: 25924071.
- Shannon CE. A Mathematical Theory of Communication. Bell Syst Tech J PubMed PMID: WOS:A1948UH03900001. 1948;27(3):379–423. doi:10.1002/j.1538-7305.1948.tb01338.x.
- Greiff V, Bhat P, Cook SC, Menzel U, Kang W, Reddy ST. A bioinformatic framework for immune repertoire diversity profiling enables detection of immunological status. Genome Med. 2015 May 28;7(1):49. doi:10.1186/s13073-015-0169-8. PubMed PMID: 26140055; PubMed Central PMCID: PMC4489130.
- Marcou Q, Mora T, Walczak AM. High-throughput immune repertoire analysis with IGoR. Nat Commun. 2018; 9(1):561. Epub 2018/02/10. doi:10.1038/s41467-018-02832-w. PubMed PMID: 29422654; PMCID: PMC5805751.
- Team RC. R: A Language and Environment for Statistical Computing Vienna, Austria: R Foundation for Statistical Computing; 2018. Available from: https://www.R-project.org.
- Nazarov VI, Pogorelyy MV, Komech EA, Zvyagin IV, Bolotin DA, Shugay M, Chudakov DM, Lebedev YB, Mamedov IZ. tcR: an R package for T cell receptor repertoire advanced data analysis. BMC Bioinf. 2015;16:175. Epub 2015/ 05/29. doi:10.1186/s12859-015-0613-1. PubMed PMID: 26017500; PMCID: PMC4445501.
- Hakim FT, Memon SA, Cepeda R, Jones EC, Chow CK, Kasten-Sportes C, Odom J, Vance BA, Christensen BL, Mackall CL, et al. Age-dependent incidence, time course, and consequences of thymic renewal in adults. J Clin Invest. 2005; 115(4):930–939. Epub 2005/03/19. doi:10.1172/jci22492. PubMed PMID: 15776111; PMCID: PMC1064981.
- Hara M, McAdams HP, Vredenburgh JJ, Herndon JE, Patz EF. Thymic hyperplasia after high-dose chemotherapy and autologous stem cell transplantation: incidence and significance in patients with breast cancer. Am J Roentgenol. 1999;173(5):1341–1344. doi:10.2214/ajr.173.5.10541115.