
ABSTRACT
Mouse cancers lacking the expression of annexin A1 (ANXA1) fail to respond to immunogenic chemotherapies. This has been initially explained by the requirement of extracellular ANXA1 (which is released from dying cancer cells) to engage formyl peptide receptor-1 (FPR1) on dendritic cells (DC) for the establishment of corpse/DC synapses. Here, we show that ANXA1-deficent cancer cells exhibit a defect in the exposure of calreticulin (CALR), which is an important “eat-me” signal, facilitating the phagocytic uptake of dead-cell antigens by DC. Of note, intratumoral injection of recombinant CALR protein was able to restore the therapeutic response of ANXA1-deficient cancers to anthracycline-based chemotherapy. Carcinomas developing in patients tend to downregulate ANXA1 expression as compared to their normal tissues of origin. ANXA1-low breast, colorectal, lung and kidney cancers are scarcely infiltrated by DC and cytotoxic T lymphocytes, supporting the idea that ANXA1 deficiency facilitates immune escape. We propose that such ANXA1-low cancers might be particularly suitable to local immunotherapy with CALR protein.
Introduction
Several prominent anticancer agents including anthracyclines, cyclophosphamide, oxaliplatin and taxanes mediate their long-term effects via the induction of an anticancer immune response.Citation1–Citation4 These agents possess the capacity to kill neoplastic cells through immunogenic cell death (ICD), converting the tumor cells into a therapeutic vaccine.Citation5,Citation6 ICD is characterized by a series of hallmarks including the release of adenosine triphosphate (ATP),Citation7,Citation8 annexin A1 (ANXA1)Citation9 and high mobility group B1 protein (HMGB1) into the extracellular space,Citation10 to attract dendritic cell (DC) precursors into the tumor bed (secondary to the interaction of ATP with the purinergic receptors P2Y2),Citation11 to establish dead cell-DC synapses (secondary to the interaction of ANXA1 with formyl peptide receptor-1, FPR1);Citation9 and DC maturation (secondary to the interaction of HMGB1 with toll-like receptor-4, TLR4).Citation10 In addition, cancer cells must expose the protein calreticulin (CALR) on their surface,Citation12,Citation13 a process that results from the translocation of CALR protein in the endoplasmic reticulum to the plasma membrane.Citation14 CALR then serves as a potent “eat-me” signal facilitating the uptake of portions of the stressed and dying cancer cell.Citation15 Furthermore, tumor cells must engage a type-1 interferon (IFN) response to release chemokines facilitating the recruitment of cytotoxic T lymphocytes (CTLs) into the tumor bed.Citation16–Citation18 Such T cells then can be educated by DCs that cross-present tumor-associated tumor antigen for launching a cytotoxic attack against residual cancer cells. This is the complex cascade that must occur in an unperturbed fashion to connect chemotherapy to antineoplastic immune responses.
Defects in the aforementioned cascade compromise the efficacy of anticancer chemotherapies. For example, breast cancer patients bearing a loss-of-function allele of FPR1 show reduced therapeutic responses to anthracycline-based adjuvant chemotherapy.Citation9,Citation19 Similarly, deficient CALR expression has a negative prognostic impact on acute myeloid leukemia,Citation20 endometrial cancer,Citation21 non-small cell lung cancer (NSCLC),Citation22 and ovarian cancer,Citation23 while overexpression of CD47, a “don’t eat” signal that opposes CALR, also is associated with poor prognosis in multiple cancer types.Citation24
Here, we examined the contribution of ANXA1 expression to cancer, investigating its expression in human tumors as well as its potential impact on the local anticancer immune response. We reveal the unexpected finding that ANXA1 is required for CALR exposure and that intratumoral injection of CALR protein can reestablish the deficient chemotherapeutic response of ANXA1-deficient cancers.
Results and discussion
Reduced ANXA1 expression in human carcinomas
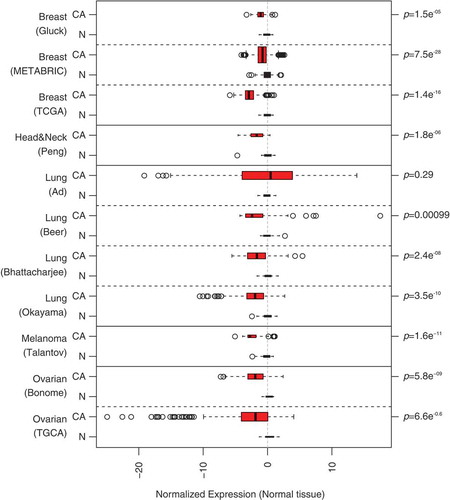
When comparing mRNA expression levels (determined by microarray or RNAseq) for different cancers and their normal controls (tissues from the same organ), it appears that the mRNA coding for ANXA1 is diminished in several cancers, including breast cancer (3 different datasets), head & neck cancer (1 dataset), lung cancer (3 out of 4 datasets), melanoma (1 dataset) and ovarian cancer (2 datasets). These results () suggest that ANXA1 mRNA downregulation is systematically associated with carcinoma development, confirming prior studies reporting reduced ANXA1 protein expression, for instance in mammary cancer.Citation24–Citation26 Driven by these results, we decided to explore whether the removal of ANXA1 from cancer cells would affect the therapeutic response.
Figure 1. Differential expression of annexin A1 (ANXA1) in different public transciptome datasets. CA, cancer tissue, N, normal tissue. p values are based on one-sided t-test.
Deficient CALR exposure on Anxa1-deficient cancer cells
To investigate whether ANXA1 would affect the therapeutic response to anthracyclines, wild type MCA205 fibrosarcomas and TC-1 NSCLC cells were compared to Anxa1−/- cells, generated by CRISP/Cas9 or Zinc Finger Nuclease technology,Citation9 as well as to additional controls, namely Fpr1−/- cells (knowing that ANXA1 can act on FPR1) and mitochondrial methionyl-tRNA formyltransferase (Mtfmt−/-) cells (knowing that Mtfm1 is an enzyme that catalyzes formylation reactions in mitochondriaCitation27 and an alternative ligand of FPR1). These cells were exposed to mitoxantrone (MTX) or doxorubicin (DOXO), and the frequency of dying and dead cells was measured by staining with Annexin V-FITC (AnnV, a dye that binds to phosphatidylserine exposed on the surface of apoptotic cells) and 4′,6-diamidino-2-phenylindole (DAPI, a dye that only enters necrotic cells with a permeable plasma membrane), revealing no impact of the different genotypes on the cell death response (; Supplemental Figure 1). WT, Anxa1−/-, Fpr1−/- and Mtfmt−/- cells were also indistinguishable in their response to anthracyclines with respect to several hallmarks of ICD, namely, ATP secretion into the culture medium (; Supplemental Figure 2A), release of HMGB1 (; Supplemental Figure 2B) and induction of a type 1 IFN gene expression signature (; Supplemental Figure 2C). In sharp contrast, Anxa1−/- cells (but not Fpr1−/- nor Mtfmt−/- cells) exhibited a selective defect in CALR exposure. This CALR exposure defect was detected both for Anxa1−/- MCA205 fibrosarcomas () and for Anxa1−/- TC-1 NSCLC cells (). Of note, Anxa1−/- cells normally expressed CALR protein, as determined by immunoblotting (), meaning that ANXA1 is required for CALR exposure on the cell surface, not its expression within the cell.
Local CALR injection restores chemotherapeutic responses of ANXA1-deficient cancers
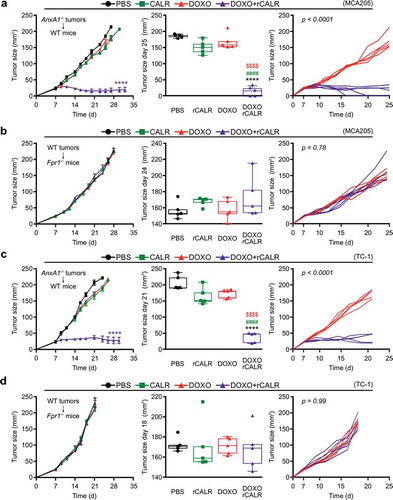
Anxa1−/- MCA205 tumors fail to reduce their growth in response to ICD inducers such as DOXO () or MTX (Supplemental Figure 3A).Citation9 However, if combined with local injection of recombinant CALR protein (rCALR), ICD inducers became highly efficient in controlling the growth of such cancers (and actually yielded several complete responses, and Supplemental Figure 3A). In contrast, CALR alone had no anticancer effect ( and Supplemental ). Of note, WT tumors implanted in Fpr1−/- hosts failed to respond to local chemotherapy, even if combined with rCALR injections ( and Supplemental ). These results could be fully recapitulated with TC-1 NSCLC tumors. rCALR injection caused a spectacular increase in the chemotherapeutic response to DOXO and MTX if Anxa1−/- TC-1 cancers were treated ( and Supplemental ), yet failed to yield responses if WT TC-1 cells grew in Fpr1−/- hosts ( and Supplemental ). These results indicate that the failure of CALR exposure, caused by the Anxa1 knockout in cancer cells, is the likely cause of chemotherapy resistance, since the substitution of rCALR protein (which binds to the surface of cancer cells)Citation12 can reestablish the treatment response.
Figure 2. Wild type (WT), Annexin A1 (AnxA1−/-), Formyl peptide receptor 1 (Fpr1−/-) and mitochondrial methionyl-tRNA formyltransferase (Mtfmt−/-) deficient murine MCA205 fibrosarcome (a) and non small cell lung cancer TC-1 (b) cells were left untreated (Co) or treated with mitoxantrone (MTX) or doxorubicin (DOXO), at the indicated doses, for 18 h, followed by the cytofluorometric assessment of cell death parameters upon co-staining with fluorescein isothiocyanate (FITC-AnnexinV) and the vital dye 4ʹ,6-diamidino-2-phenylindole (DAPI).
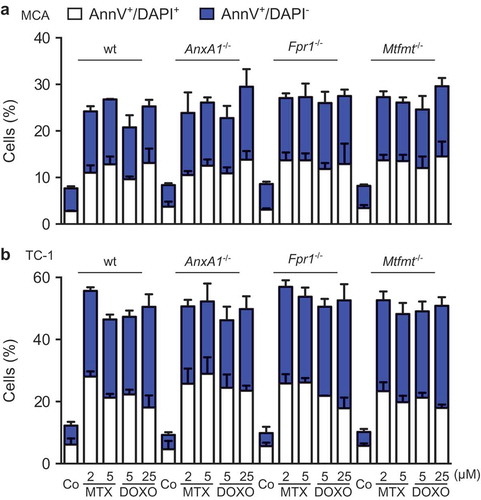
Figure 3. (a) Wild type (WT), Annexin A1 (AnxA1−/-), Formyl peptide receptor 1 (Fpr1−/-) and mitochondrial methionyl-tRNA formyltransferase (Mtfmt−/-) deficient murine MCA205 fibrosarcoma cells were left untreated (Co) or treated with 2 μM mitoxantrone (MTX), 25 or 20 µM doxorubicin (DOXO) for 18 and 24 h, respectively, followed by the assessment of extracellular ATP by means of a luciferase-based assay. (b) WT, AnxA1−/-, Fpr1−/-, and Mtfmt−/- murine MCA205 cells were treated with 2 μM MTX or 20 µM DOXO for 24 and 48 h or left untreated (Co) and then subjected to the assessment of extracellular high mobility group box 1 (HMGB1) by ELISA. Data are represented as mean ± SD. Results from one representative experiment out of three independent ones yielding similar results are reported. (c) Heatmap representing the levels of the interferon (IFN) stimulated-genes in WT and Anxa1−/- MCA cells treated with DOXO. *p < 0.05, **p < 0.01, ***p < 0.001, ****p < 0.0001 as compared to PBS-treated cells of the same type. #p < 0.05, ##p < 0.01, ###p < 0.001, ####p < 0.0001 as compared to WT cells.
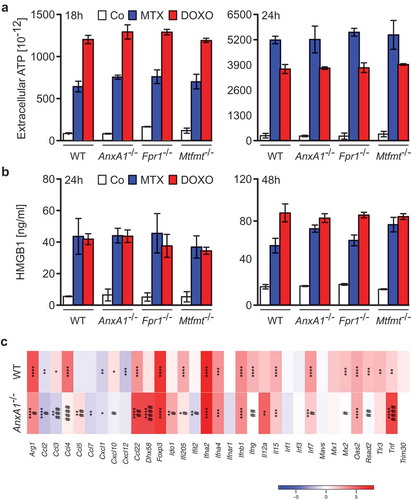
Figure 4. Wild type (wt), Annexin A1 (AnxA1−/-), Formyl peptide receptor 1 (Fpr1−/-) and mitochondrial methionyl-tRNA formyltransferase (Mtfmt−/-) deficient murine MCA205 fibrosarcoma (a,c) or TC-1 non small cell lung carcinoma (b,d) cells were treated with phosphate-buffered saline (PBS), 2 μM mitoxantrone (MTX), 25 or 20 µM doxorubicin (DOXO) for 18 and 24 h, respectively. Cells were subsequently assessed by cytofluorometric immunodetection of calreticulin (CALR) exposure. Results from one representative experiment out of three independent ones yielding similar results are reported in (b,d). Data are represented as mean ± SD. Representative cytofluorometric profiles for one sample out of three independent ones belonging to at least 3 independent experiments are reported in (a,c). **** p < 0.0001 (unpaired Student’s t test), as compared to PBS-treated cells. #### p < 0.0001 (unpaired Student’s t test), as compared to CALR exposure in WT cells. Immunobloting (e) and quantification ((f), mean ± SEM, n = 2) for CALR in MCA205 and TC-1 WT or AnxA1−/- cells. * p < 0.05, ** p < 0.01 (unpaired Student’s t test), as compared to WT cells. PI, Propidium iodide.
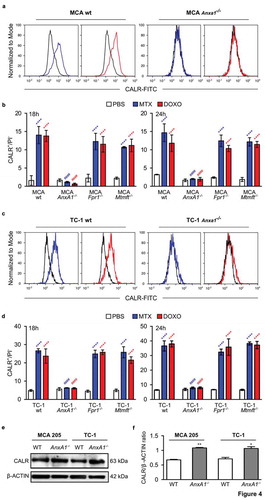
Figure 5. (a,c) Wild type (WT) immunocompetent C57BL/6 mice were inoculated subcutaneously (s.c.) with Annexin A1 deficient (AnxA1−/-) murine MCA205 fibrosarcoma (a) or TC-1 non small cell lung cancer cells (c), respectively. (b,d) Formyl peptide receptor 1 knock out (Fpr1−/-) mice were inoculated s.c. with WT murine MCA205 fibrosarcoma (b) or TC-1 cells (d), respectively. Tumor size was routinely assessed. When tumor became palpable, mice received intratumorally (i.t.) either recombinant calreticulin (rCALR) or doxorubicin (DOXO), alone or in combination or an equivalent volume of phosphate-buffered saline (PBS). From left to right: (1) average (±SEM) tumor growth curves from one representative experiment of two; (2) tumor size distribution at day 25 (MCA205 Anxa1−/-, (a)), day 24 (MCA205 WT, (b)), day 21 (TC-1 Anxa1−/-, (c)) or day 18 (TC-1 WT, (d)) of data shown in (1); (3) individual growth curves from mice injected with DOXO alone or combined with rCALR. ****p < 0.0001, as compared to PBS-treated tumors; $$$$p < 0.0001, as compared to DOXO-treated tumors; #p < 0.0001, as compared to rCALR-treated tumors.
Correlation of ANXA1 expression and immune infiltrate in human cancers
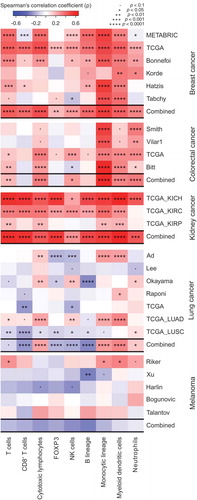
In a final step, we investigated whether the expression level of ANXA1 would be associated with the density of the cancer immune infiltrate in patients. For this, we correlated the ANXA1 mRNA levels with other mRNAs specific for certain immune subsets, using an established bioinformatics approach.Citation28 Of note, across several datasets, a highly significant positive correlation between ANXA1 expression and the local presence of monocytic cells and myeloid DCs could be detected. This applies to several carcinomas (with strong effects for multiple breast, colorectal and kidney cancer datasets, and less constant, though statistically significant correlations, for lung cancer) but not melanoma (). This observation may reflect the capacity of ANXA1 to stimulate the recruitment of myeloid cells including DC precursors into the tumor bed,Citation9 as well as its impact on CALR exposure, knowing that CALR is a strong pro-phagocytic signal for macrophages and DCs.Citation12 In addition, we could detect a significant correlation between CTLs and ANXA1 expression across different carcinoma (but not melanoma) datasets. Generally, the correlation between ANXA1 and immune effectors was stronger for breast, colorectal and kidney cancer, which are known to be under solid immunosurveillance.Citation29 However, such a positive correlation (for monocytic cells, myeloid DCs and CTLs) was also found for lung cancer with the particularity that, in this tumor type, ANXA1 negatively correlated with the expression of forehead box P3 (FOXP3), the transcription factor that is pathognomonic for regulatory T cells (Tregs). This inter-tumor type heterogeneity may reflect organ-specific differences in the “structure” of the immune infiltrate.Citation30,Citation31
Figure 6. Spearman’s correlation coefficients between immune infiltrate estimates (MCP-counter method) and Annexin A1 (ANXA1) mRNA levels from different public datasets, of breast, colorectal, kidney and lung cancer, and melanoma. For each cancer, a combined p value has been calculated as described in Materials and Methods.
Concluding remarks
Here, we provide evidences that deficient ANXA1 expression affects the capacity of cancer cells to expose CALR in response to ICD inducers including the anthracyclines MTX and DOXO. These findings echo a prior report showing that the ANXA1 defect abolishes CALR exposure in cells treated with the ICD inducer wogonin (5,7-dihydroxy-8-methoxyflavone).Citation32 The mechanism accounting for the CALR exposure defect of ANXA1-knockout cells remains to be determined, though it might be linked to the implication of ANXA1 in non-conventional protein secretion,Citation33 or its impact on intracellular trafficking.Citation34 Irrespective of these mechanistic uncertainties, it appears plausible that defective CALR exposure causes a defect in the anticancer immune response that is usually induced by chemotherapeutics able to induce ICD. Indeed, injection of rCALR protein into the tumor fully restores the deficient response of Anxa1−/- cancers to ICD inducers, as shown here. These results are reminiscent of prior studies, revealing that local rCALR injection could restore deficient anticancer immune response for tumor lacking either CALR itself or essential elements of the CALR exposure machinery including eukaryotic translation initiation factor 2 alpha kinase 3 (EIF2AK3), eukaryotic translation initiation factor 2A (EIF2A) and protein disulfide isomerase family A member 3 (PDIA3).Citation12,Citation14,Citation35 Of note, a large panel of different human cancers downregulate ANXA1 expression as they develop, and low ANXA1 levels then correlate with poor infiltration of the tumor by monocytic cells, myeloid DCs and CTLs. This strongly suggests that ANXA1 downregulation facilitates the escape of cancers from immune control, not only in mouse models but also in humans. It will be interesting to explore the possibility to use rCALR as an immunoadjuvant for the treatment of patients harboring ANXA1-deficient cancers.
Materials and methods
Data
For differential expression in public data, we collected 11 public datasets (for which cancer and normal tissue are available) for breast (TCGA consortium),Citation36,Citation37 head & neck,Citation38 lung,Citation39–Citation42 and ovarian carcinoma (TCGA consortium),Citation43 and for melanoma.Citation44 In each data set, we applied a one-sided t-test (H0: ANXA1 is not underexpressed in tumor).
Immune infiltration
For correlation of ANXA1 with immune infiltrates, we collected several public transcriptome datasets (microarrays and RNAseq). R-package “MCPcounter”Citation28 was used to estimate immune cell infiltrates from microarray data. For applying MCPcounter method to RNAseq data, we used “voom” normalization.Citation45 For correlation analyses, the Spearman’s correlation coefficient and test were employed. We used Fisher’s method on one-tail correlation p values in order to calculate “combined” p values (for the “combined” correlation coefficient, we have chosen the one that has the smallest one-tail p value).
Chemical, cell lines, tumor cell clones and culture conditions
Unless otherwise indicated, media and supplements for cell culture were purchased from Gibco-Invitrogen (Carlsbad, CA, USA) while plasticware was from Corning B.V. Life Sciences (Amsterdam, The Netherlands). Doxorubicin hydrochloride (DOXO) and mitoxantrone dihydrochloride (MTX) were from Sigma Aldrich (St. Louis, MO, USA). Production of recombinant calrecticulin (rCARL) has been described previously.Citation46 All cells were maintained in standard culture conditions (at 37ºC, under 5% CO2). Murine fibrosarcoma MCA205 cells (class I MHC haplotype H-2b, syngenic for C57BL/6 mice) and non small cell lung carcinoma (NSCLC) TC-1 cells (class I MHC haplotype H-2b, syngenic for C57BL/6 mice) were cultured in RPMI 1640 medium supplemented with 10% (v/v) fetal bovine serum, 2 mM L-glutamine, 100 IU mL-1 penicillin G sodium salt, 100 µg mL-1 streptomycin sulfate, 1 mM sodium pyruvate, 1 mM non-essential amino acids and 1 mM HEPES buffer. AnxA1−/-, Fpr1−/- and Mtfmt−/- cell lines were generated by means of the CompoZr® Zinc Finger Nuclease Technology (CKOZFN26764, CKOZFND31536, CKOZFN35935; from Sigma-Aldrich, as reported in Vacchelli et al.)Citation9 or CRISP/Cas9 and were cultured in the same condition as parental cell line.
Quantification of cell death by flow cytometer
Cell death was assessed by means of the FITC-Annexin V detection kit I (BD Biosciences, San José, CA, US) following the manufacture’s procedures. In brief, 1 × 10⁵ cells were collected, washed in phosphate-buffered saline (PBS), pelleted and resuspended in 50 µL staining buffer containing FITC-conjugated AnnexinV antibody. Samples were then incubated in the dark for 15 min before adding 400 µl staining buffer supplemented with 0.1% DAPI (Life Technologies Inc., Carlsbad, CA, USA). Acquisitions were performed on a MACSQuant10 cytometer (Miltenyi Biotec), and data were statistically evaluated using FlowJo V10.2 software (Tree Star, Inc., Ashland, OR, USA).
Determination of extracellular ATP concentrations
Extracellular ATP levels were measured by the luciferin-based ENLITEN ® ATP Assay kit (Promega, Charbonnieres, France) as indicated by the manufacturer’s instructions. ATP-driven chemoluminescence was recorded on a Fluostar multiwell plate luminometer (BMG Labtech, Offenburg, Germany).
Detection of HMGB1 release
2.5 x 10⁵ WT, Anxa1−/-, Fpr1−/- or Mtfmt−/- murine MCA205 fibrosarcoma or TC-1 NSCLC cells were plated in 6-well plates, let adhere overnight and then treatment was added onto the cells. Supernatants were collected at 24 or 48 h, dying tumor cells were removed by centrifugation (800 g, 5 min) and supernatants were stored at −80°C or immediately analyzed for HMGB1 abundance. Quantification of HMGB1 in the supernatants was assessed by enzyme-linked immunosorbent assay (ELISA) kit (HMBG1 ELISA kit II, Gentaur Europe, Kampenhout, Belgium), according to the manufacturer’s instructions.
Rt-PCR
Total RNA extraction and genomic DNA removal were performed with the RNeasy Mini Kit (Qiagen, Hilden, Germany) following the manufacturer’s instructions. Total RNA (1 μg from each sample) was then reverse transcribed into cDNA with the SuperScript III Reverse Transcriptase, RNasin Plus RNase Inhibitor (Life Technologies, Saint Aubin, France) in the presence of random primers (Promega, Charbonnieres, France) and the Deoxynucleoside Triphosphate Set, PCR grade (Roche Diagnostics, Meylan, France). Expression of interferon (IFN)-related genes and chemokine genes was analyzed with TaqMan Gene Expression Assays using Universal Master Mix II on a StepOnePlus Real-Time PCR System (Life Technologies, France). qRT-PCR data were invariably normalized to the expression levels of the housekeeping gene Peptidylprolyl Isomerase A (Ppia).
Statistical analyses for qRT-PCR
p values are computed by using statistical linear models. For the comparisons between treatments (*), we consider that ΔPpiaCT is linearly dependent upon treatment, with PBS as basal level, for each cell lines and each genotype (the formula used in R is ΔPpiaCT ~ (cell_line * genotype)/treatment). For the comparisons between genotypes (#), we consider that ΔPpiaCT is linearly dependent upon treatment and genotype, with PBS and WT as basal level, for each cell lines (the formula used in R is ΔPpiaCT ~ cell_line/(genotype * treatment)). This (#) annotation can be interpreted as an effect of genotype that is added to the effect of treatment.
Flow cytometric analysis of CALR on the cell surface
CRT exposure was assessed by flow cytometry, as previously described.Citation8,Citation47,Citation48 In brief, cells growing on standard supports were collected, washed twice with PBS and fixed in 0.25% paraformaldehyde (w/v in PBS) for 5 min at room temperature (RT). After two additional washes in cold PBS, cells were incubated with an anti-CALR antibody (ab2907, Abcam, Cambridge, UK) diluted in cold blocking buffer (2% FBS, v/v in PBS) for 30 min on ice, washed and incubated for additional 30 min with an AlexaFluor-488 conjugated goat-anti-rabbit (Invitrogen, Carlsbad, CA, USA) in blocking buffer. Finally, cells were washed in cold PBS, incubated with 1 μg/ml propidium iodide (PI) for 5 min and then immediately subjected to flow cytometry MACSQuant10 cytometer (Miltenyi Biotec). Isotype-matched IgG antibodies (Cell Signaling Technology, Danvers, MA, USA) were used as a control, and the fluorescent intensity of stained cells was gated on PI-negative cells. Data were further processed with the FlowJo V10.2 software (Tree Star, Inc., Ashland, OR, USA) to assess the percentage of CALR+ PI− cells.
Mouse strains and housing
Mice were breaded and maintained in specific pathogen–free conditions at the Centre d’Expérimentations Fonctionnelles (CEF) du Centre de Recherches des Cordeliers (Paris, France) in a temperature-controlled environment with 12 h light, 12 h dark cycles and received food and water ad libitum. All animal experiments were in compliance with the EU Directive 63/2010 and the protocol 5089–2016041914249886 was approved by the Ethical Committee of the CRC (CEEA no 5, registered at the French Ministry of Research). Six- to 7-week-old female wild-type C57Bl/6 mice were obtained from Envigo (France). All mouse experiments were randomized and blinded, and sample sizes were calculated to detect a statistically significant effect.
Mice tumor chemotherapy model
Three hundred thousand WT or AnxA1−/- MCA205 or TC-1 cells were inoculated subcutaneously (near the thigh) into WT or Fpr1−/- C57BL/6 (H-2b) mice, and tumor surface (longest dimension × perpendicular dimension) was routinely monitored using a common caliper. When the tumor surface reached 25–35 mm2, mice received either 2.9 mg/kg intratumorally (i.t.) DOXO in 50 μl of PBS or 5.17 mg/Kg intraperitoneally (i.p.) MTX in 100 μl of PBS or an equivalent volume of PBS either alone or in combination with 15 µg/mice i.t. rCALR. Animals bearing neoplastic lesions that exceeded 20–25% of their body mass were euthanatized. All experiments contained 5 to 10 mice per group and were run at least 2 times, yielding similar results.
Statistical analysis of in vivo experiments
Longitudinal analysis of tumor growth data was performed by linear mixed-effect modeling on log pre-processed tumor sizes. Wald test was used to compute p values by testing jointly that both tumor growth slopes and intercepts (on a log scale) were the same between treatment groups of interest (https://kroemerlab.shinyapps.io/TumGrowth/).Citation49 At a single time point, the effect of treatment was estimated by linear modeling. p values were adjusted according to the Holm method from all pairwise comparisons of interest. For graphing, tumor growth data are represented on the untransformed original scale in three forms: (1) explicit curves from all measurements of each mouse; (2) group-averaged tumor size alongside its SEM computed at each time point; (3) overlay of single data points and the classical box-and-whiskers plot at a selected sampling point. For mice euthanized before the selected sampling point, the last measure was retained.
Immunoblotting
For immunoblotting, protein extracts, obtained by cellular lysis in radioimmunoprecipitation assay (RIPA) buffer, were run on 4–12% Bis-Tris acrylamide gels (Invitrogen, Carlsbad, CA, USA) and electrotransferred to 0.2 μM polyvinylidene fluoride (PVDF) membranes (Bio-Rad, Hercules, CA, USA). Non-specific binding sites were saturated by incubating membranes for 1 h in 0.05% Tween 20 (v/v in Tris-buffered saline, TBS) supplemented with 5% non-fat powdered milk (w/v in TBS), followed by an overnight incubation with primary antibodies specific for CALR (ab2907, Abcam, Cambridge, UK). Equal loading was monitored by probing membranes with an anti-actin antibody (ab49900, Abcam, Cambridge, UK). Membranes were developed with suitable horseradish peroxidase conjugates (Southern Biotechnologies, Birmingham, AL, USA), followed by chemiluminescence-based detection with the SuperSignal West Pico® reagent (Thermo Scientific-Pierce, Rockford, IL, USA) and the ImageQuant LAS 4000 software-assisted imager (GE Healthcare, Piscataway, NJ, USA). Quantification was performed by densitometry by means of Image J software.
Authors contribution
E.E.B. and E.V., performed the experiments; G.S. performed the bioinformatic analysis and the statistical analysis; E.V. and G.K. conceived the study; E.E.B, L.Z, E.V. and G.K wrote the paper.
Conflicts of interest
The authors declare no conflict of interest.
Supplemental Material
Download Zip (540.9 KB)Supplemental Material
Download MS Word (14 KB)Acknowledgments
The authors are grateful for excellent technical assistance of the CRC Core Facilities (CEF; Centre de Recherche des Cordeliers, Paris, France). The results shown here are in part based upon data generated by the TCGA Research Network: https://www.cancer.gov/tcga. GK is supported by the Ligue contre le Cancer (équipe labellisée); Agence National de la Recherche (ANR) – Projets blancs; ANR under the frame of E-Rare-2, the ERA-Net for Research on Rare Diseases; Association pour la recherche sur le cancer (ARC); Cancéropôle Ile-de-France; Chancelerie des universités de Paris (Legs Poix), Fondation pour la Recherche Médicale (FRM); a donation by Elior; European Research Area Network on Cardiovascular Diseases (ERA-CVD, MINOTAUR); Gustave Roussy Odyssea, the European Union Horizon 2020 Project Oncobiome; Fondation Carrefour; High-end Foreign Expert Program in China (GDW20171100085 and GDW20181100051), Institut National du Cancer (INCa); Inserm (HTE); Institut Universitaire de France; LeDucq Foundation; the LabEx Immuno-Oncology; the RHU Torino Lumière; the Seerave Foundation; the SIRIC Stratified Oncology Cell DNA Repair and Tumor Immune Elimination (SOCRATE); and the SIRIC Cancer Research and Personalized Medicine (CARPEM).
Supplementary material
Supplemental data for this article can be accessed on the publisher’s website
References
- Senovilla L, Vitale I, Martins I, Tailler M, Pailleret C, Michaud M, Galluzzi L, Adjemian S, Kepp O, Niso-Santano M, et al. An immunosurveillance mechanism controls cancer cell ploidy. Science. 2012;337(6102):1678–1684. doi:10.1126/science.1224922.
- Galluzzi L, Buqué A, Kepp O, Zitvogel L, Kroemer G. Immunological effects of conventional chemotherapy and targeted anticancer agents. Cancer Cell. 2015;28(6):690–714. doi:10.1016/j.ccell.2015.10.012.
- Pfirschke C, Engblom C, Rickelt S, Cortez-Retamozo V, Garris C, Pucci F, Yamazaki T, Poirier-Colame V, Newton A, Redouane Y, et al. Immunogenic chemotherapy sensitizes tumors to checkpoint blockade therapy. Immunity. 2016;44(2):343–354. doi:10.1016/j.immuni.2015.11.024.
- Bezu L, Sauvat A, Humeau J, Gomes-da-Silva LC, Iribarren K, Forveille S, Garcia P, Zhao L, Liu P, Zitvogel L, et al. eIF2α phosphorylation is pathognomonic for immunogenic cell death. Cell Death Differ. 2018;25(8):1375–1393. doi:10.1038/s41418-017-0044-9.
- Krysko DV, Garg AD, Kaczmarek A, Krysko O, Agostinis P, Vandenabeele P. Immunogenic cell death and DAMPs in cancer therapy. Nat Rev Cancer. 2012;12(12):860–875. doi:10.1038/nrc3380.
- Galluzzi L, Buqué A, Kepp O, Zitvogel L, Kroemer G. Immunogenic cell death in cancer and infectious disease. Nat Rev Immunol. 2017;17(2):97–111. doi:10.1038/nri.2016.107.
- Ghiringhelli F, Apetoh L, Tesniere A, Aymeric L, Ma Y, Ortiz C, Vermaelen K, Panaretakis T, Mignot G, Ullrich E, et al. Activation of the NLRP3 inflammasome in dendritic cells induces IL-1beta-dependent adaptive immunity against tumors. Nat Med. 2009;15(10):1170–1178. doi:10.1038/nm.2028.
- Michaud M, Martins I, Sukkurwala AQ, Adjemian S, Ma Y, Pellegatti P, Shen S, Kepp O, Scoazec M, Mignot G, et al. Autophagy-dependent anticancer immune responses induced by chemotherapeutic agents in mice. Science. 2011;334(6062):1573–1577. doi:10.1126/science.1208347.
- Vacchelli E, Ma Y, Baracco EE, Sistigu A, Enot DP, Pietrocola F, Yang H, Adjemian S, Chaba K, Semeraro M, et al. Chemotherapy-induced antitumor immunity requires formyl peptide receptor 1. Science. 2015;350(6263):972–978. doi:10.1126/science.aad0779.
- Apetoh L, Ghiringhelli F, Tesniere A, Obeid M, Ortiz C, Criollo A, Mignot G, Maiuri MC, Ullrich E, Saulnier P, et al. Toll-like receptor 4-dependent contribution of the immune system to anticancer chemotherapy and radiotherapy. Nat Med. 2007;13(9):1050–1059. doi:10.1038/nm1622.
- Ma Y, Adjemian S, Mattarollo SR, Yamazaki T, Aymeric L, Yang H, Portela Catani JP, Hannani D, Duret H, Steegh K, et al. Anticancer chemotherapy-induced intratumoral recruitment and differentiation of antigen-presenting cells. Immunity. 2013;38(4):729–741. doi:10.1016/j.immuni.2013.03.003.
- Obeid M, Tesniere A, Ghiringhelli F, Fimia GM, Apetoh L, Perfettini J-L, Castedo M, Mignot G, Panaretakis T, Casares N, et al. Calreticulin exposure dictates the immunogenicity of cancer cell death. Nat Med. 2007;13(1):54–61. doi:10.1038/nm1523.
- Tesniere A, Schlemmer F, Boige V, Kepp O, Martins I, Ghiringhelli F, Aymeric L, Michaud M, Apetoh L, Barault L, et al. Immunogenic death of colon cancer cells treated with oxaliplatin. Oncogene. 2010;29(4):482–491. doi:10.1038/onc.2009.356.
- Panaretakis T, Kepp O, Brockmeier U, Tesniere A, Bjorklund A-C, Chapman DC, Durchschlag M, Joza N, Pierron G, van Endert P, et al. Mechanisms of pre-apoptotic calreticulin exposure in immunogenic cell death. Embo J. 2009;28(5):578–590. doi:10.1038/emboj.2009.1.
- Feng M, Marjon KD, Zhu F, Weissman-Tsukamoto R, Levett A, Sullivan K, Kao KS, Markovic M, Bump PA, Jackson HM, et al. Programmed cell removal by calreticulin in tissue homeostasis and cancer. Nat Commun. 2018;9(1):3194. doi:10.1038/s41467-018-05211-7.
- Sistigu A, Yamazaki T, Vacchelli E, Chaba K, Enot DP, Adam J, Vitale I, Goubar A, Baracco EE, Remédios C, et al. Cancer cell-autonomous contribution of type I interferon signaling to the efficacy of chemotherapy. Nat Med. 2014;20(11):1301–1309. doi:10.1038/nm.3708.
- Vacchelli E, Sistigu A, Yamazaki T, Vitale I, Zitvogel L, Kroemer G. Autocrine signaling of type 1 interferons in successful anticancer chemotherapy. Oncoimmunology. 2015;4(8):e988042. doi:10.4161/2162402X.2014.988042.
- Zitvogel L, Galluzzi L, Kepp O, Smyth MJ, Kroemer G. Type I interferons in anticancer immunity. Nat Rev Immunol. 2015;15(7):405–414. doi:10.1038/nri3845.
- Vacchelli E, Enot DP, Pietrocola F, Zitvogel L, Kroemer G. Impact of pattern recognition receptors on the prognosis of breast cancer patients undergoing adjuvant chemotherapy. Cancer Res. 2016;76(11):3122–3126. doi:10.1158/0008-5472.CAN-16-0294.
- Fucikova J, Truxova I, Hensler M, Becht E, Kasikova L, Moserova I, Vosahlikova S, Klouckova J, Church SE, Cremer I, et al. Calreticulin exposure by malignant blasts correlates with robust anticancer immunity and improved clinical outcome in AML patients. Blood. 2016;128(26):3113–3124. doi:10.1182/blood-2016-08-731737.
- Xu Q, Chen C, Chen G, Chen W, Zhou D, Xie Y. Significance of calreticulin as a prognostic factor in endometrial cancer. Oncol Lett. 2018;15(6):8999–9008. doi:10.3892/ol.2018.8495.
- Fucikova J, Becht E, Iribarren K, Goc J, Remark R, Damotte D, Alifano M, Devi P, Biton J, Germain C, et al. Calreticulin expression in human non-small cell lung cancers correlates with increased accumulation of antitumor immune cells and favorable prognosis. Cancer Res. 2016;76(7):1746–1756. doi:10.1158/0008-5472.CAN-15-1142.
- Aubin F, Zultak M, Blanc D, Terrasse F, Quencez E, Agache P. Reaction to UV-induced erythema in young patients with basal cell carcinoma. Photodermatol. 1989;6:118–123.
- Shen D, Chang HR, Chen Z, He J, Lonsberry V, Elshimali Y, Chia D, Seligson D, Goodglick L, Nelson SF, et al. Loss of annexin A1 expression in human breast cancer detected by multiple high-throughput analyses. Biochem Biophys Res Commun. 2005;326(1):218–227. doi:10.1016/j.bbrc.2004.10.214.
- Cao Y, Li Y, Edelweiss M, Arun B, Rosen D, Resetkova E, Wu Y, Liu J, Sahin A, Albarracin CT. Loss of annexin A1 expression in breast cancer progression. Appl Immunohistochem Mol Morphol. 2008;16(6):530–534. doi:10.1097/PAI.0b013e31817432c3.
- Yom CK, Han W, Kim S-W, Kim HS, Shin H-C, Chang JN, Koo M, Noh D-Y, Moon B-I. Clinical significance of annexin A1 expression in breast cancer. J Breast Cancer. 2011;14(4):262–268. doi:10.4048/jbc.2011.14.4.262.
- Tucker EJ, Hershman SG, Köhrer C, Belcher-Timme CA, Patel J, Goldberger OA, Christodoulou J, Silberstein JM, McKenzie M, Ryan MT, et al. Mutations in MTFMT underlie a human disorder of formylation causing impaired mitochondrial translation. Cell Metab. 2011;14(3):428–434. doi:10.1016/j.cmet.2011.07.010.
- Becht E, Giraldo NA, Lacroix L, Buttard B, Elarouci N, Petitprez F, Selves J, Laurent-Puig P, Sautès-Fridman C, Fridman WH, et al. Estimating the population abundance of tissue-infiltrating immune and stromal cell populations using gene expression. Genome Biol. 2016;17(1):218. doi:10.1186/s13059-016-1070-5.
- Fridman WH, Zitvogel L, Sautès-Fridman C, Kroemer G. The immune contexture in cancer prognosis and treatment. Nat Rev Clin Oncol. 2017;14(12):717–734. doi:10.1038/nrclinonc.2017.101.
- Stoll G, Zitvogel L, Kroemer G. Differences in the composition of the immune infiltrate in breast cancer, colorectal carcinoma, melanoma and non-small cell lung cancer: A microarray-based meta-analysis. Oncoimmunology. 2016;5(2):e1067746. doi:10.1080/2162402X.2015.1067746.
- Stoll G, Pol J, Soumelis V, Zitvogel L, Kroemer G. Impact of chemotactic factors and receptors on the cancer immune infiltrate: a bioinformatics study revealing homogeneity and heterogeneity among patient cohorts. Oncoimmunology. 2018;7(10):e1484980. doi:10.1080/2162402X.2018.1484980.
- Yang Y, Li X-J, Chen Z, Zhu -X-X, Wang J, Zhang L, Qiang L, Ma Y-J, Li Z, Guo Q-L, et al. Wogonin induced calreticulin/annexin A1 exposure dictates the immunogenicity of cancer cells in a PERK/AKT dependent manner. PLoS One. 2012;7(12):e50811. doi:10.1371/journal.pone.0050811.
- Moss SE, Morgan RO. The annexins. Genome Biol. 2004;5(4):219. doi:10.1186/gb-2004-5-4-219.
- Purvis GSD, Collino M, Loiola RA, Baragetti A, Chiazza F, Brovelli M, Sheikh MH, Collotta D, Cento A, Mastrocola R, et al. Identification of AnnexinA1 as an Endogenous Regulator of RhoA, and Its Role in the Pathophysiology and Experimental Therapy of Type-2 Diabetes. Front Immunol. 2019;10:571. doi:10.3389/fimmu.2019.00571.
- Panaretakis T, Joza N, Modjtahedi N, Tesniere A, Vitale I, Durchschlag M, Fimia GM, Kepp O, Piacentini M, Froehlich K-U, et al. The co-translocation of ERp57 and calreticulin determines the immunogenicity of cell death. Cell Death Differ. 2008;15(9):1499–1509. doi:10.1038/cdd.2008.67.
- Curtis C, Shah SP, Chin S-F, Turashvili G, Rueda OM, Dunning MJ, Speed D, Lynch AG, Samarajiwa S, Yuan Y, et al. The genomic and transcriptomic architecture of 2,000 breast tumours reveals novel subgroups. Nature. 2012;486(7403):346–352. doi:10.1038/nature10983.
- Glück S, Ross JS, Royce M, McKenna EF, Perou CM, Avisar E, Wu L. TP53 genomics predict higher clinical and pathologic tumor response in operable early-stage breast cancer treated with docetaxel-capecitabine ± trastuzumab. Breast Cancer Res Treat. 2012;132(3):781–791. doi:10.1007/s10549-011-1412-7.
- Peng C-H, Liao C-T, Peng S-C, Chen Y-J, Cheng A-J, Juang J-L, Tsai C-Y, Chen T-C, Chuang Y-J, Tang C-Y, et al. A novel molecular signature identified by systems genetics approach predicts prognosis in oral squamous cell carcinoma. PLoS One. 2011;6(8):e23452. doi:10.1371/journal.pone.0023452.
- Okayama H, Kohno T, Ishii Y, Shimada Y, Shiraishi K, Iwakawa R, Furuta K, Tsuta K, Shibata T, Yamamoto S, et al. Identification of genes upregulated in ALK-positive and EGFR/KRAS/ALK-negative lung adenocarcinomas. Cancer Res. 2012;72(1):100–111. doi:10.1158/0008-5472.CAN-11-1403.
- Bhattacharjee A, Richards WG, Staunton J, Li C, Monti S, Vasa P, Ladd C, Beheshti J, Bueno R, Gillette M, et al. Classification of human lung carcinomas by mRNA expression profiling reveals distinct adenocarcinoma subclasses. Proc Natl Acad Sci USA. 2001;98(24):13790–13795. doi:10.1073/pnas.191502998.
- Beer DG, Kardia SLR, Huang -C-C, Giordano TJ, Levin AM, Misek DE, Lin L, Chen G, Gharib TG, Thomas DG, et al. Gene-expression profiles predict survival of patients with lung adenocarcinoma. Nat Med. 2002;8(8):816–824. doi:10.1038/nm733.
- Gene expression-based survival prediction in lung adenocarcinoma: a multi-site, blinded validation study. PubMed - NCBI. [accessed May 24, 2019]. https://www.ncbi.nlm.nih.gov/pubmed/?term=18641660
- Bonome T, Levine DA, Shih J, Randonovich M, Pise-Masison CA, Bogomolniy F, Ozbun L, Brady J, Barrett JC, Boyd J, et al. A gene signature predicting for survival in suboptimally debulked patients with ovarian cancer. Cancer Res. 2008;68(13):5478–5486. doi:10.1158/0008-5472.CAN-07-6595.
- Talantov D, Mazumder A, Yu JX, Briggs T, Jiang Y, Backus J, Atkins D, Wang Y. Novel genes associated with malignant melanoma but not benign melanocytic lesions. Clin Cancer Res. 2005;11(20):7234–7242. doi:10.1158/1078-0432.CCR-05-0683.
- Law CW, Chen Y, Shi W, Smyth GK. voom: precision weights unlock linear model analysis tools for RNA-seq read counts. Genome Biol. 2014;15(2):R29. doi:10.1186/gb-2014-15-2-r29.
- Culina S, Lauvau G, Gubler B, van Endert PM. Calreticulin promotes folding of functional human leukocyte antigen class I molecules in vitro. J Biol Chem. 2004;279(52):54210–54215. doi:10.1074/jbc.M410841200.
- Sukkurwala AQ, Martins I, Wang Y, Schlemmer F, Ruckenstuhl C, Durchschlag M, Michaud M, Senovilla L, Sistigu A, Ma Y, et al. Immunogenic calreticulin exposure occurs through a phylogenetically conserved stress pathway involving the chemokine CXCL8. Cell Death Differ. 2014;21(1):59–68. doi:10.1038/cdd.2013.73.
- Menger L, Vacchelli E, Adjemian S, Martins I, Ma Y, Shen S, Yamazaki T, Sukkurwala AQ, Michaud M, Mignot G, et al. Cardiac glycosides exert anticancer effects by inducing immunogenic cell death. Sci Transl Med. 2012;4(143):143ra99. doi:10.1126/scitranslmed.3003807.
- Enot DP, Vacchelli E, Jacquelot N, Zitvogel L, Kroemer G. TumGrowth: an open-access web tool for the statistical analysis of tumor growth curves. Oncoimmunology. 2018;7(9):e1462431. doi:10.1080/2162402X.2018.1462431.