
ABSTRACT
Docking protein-1 (DOK1) is a tumor suppressor frequently lost in malignant cells, however, it retains the ability to control activities of immune receptors in adjacent stroma cells of the tumor microenvironment. We therefore hypothesized that addressing DOK1 may be useful for cancer immunotherapy. DOK1 mRNA and DOK1 protein expression were downregulated in tumor cells of gastric cancer patients (n = 249). Conversely, its expression was up-regulated in cases positive for Epstein Barr Virus (EBV+) together with genes related to macrophage biology and targets of clinical immunotherapy such as programmed-cell-death-ligand-1 (PD-L1). Notably, high DOK1 positivity in stroma cells conferred poor prognosis in patients and correlated with high levels of inducible nitric oxide synthase in CD68+ tumor-associated macrophages. In macrophages derived from human monocytic leukemia cell lines, DOK1 (i) was inducible by agonists of the anti-diabetic transcription factor peroxisome proliferator-activated receptor-gamma (PPARγ), (ii) increased polarization towards an inflammatory phenotype, (iii) augmented nuclear factor-κB-dependent transcription of pro-inflammatory cytokines and (iv) reduced PD-L1 expression. These properties empowered DOK1+ macrophages to decrease the viability of human gastric cancer cells in contact-dependent co-cultures. DOK1 also reduced PD-L1 expression in human primary blood monocytes. Our data propose that the drugability of DOK1 may be exploited to reprogram myeloid cells and enforce the innate immune response against EBV+ human gastric cancer.
KEYWORDS:
Introduction
Gastric cancer is a major cause of mortality in China and worldwide.Citation1 Patients usually present at an advanced stage where effective treatment is limited to surgery, and intrinsic unresponsiveness and/or acquired resistance prevents success of chemo- and targeted therapeutics.Citation2 Tumor evasion strategies and an immunosuppressed host contribute to therapy failure. Current immunotherapies aim to tackle these obstacles by trying to boost and direct the “host” immune response against tumor cells in combination with classical treatments.Citation3
Genome-wide sequencing revealed genetic heterogeneity and founded a new consensus molecular subtype classification system of gastric cancer with both prognostic and predictive value.Citation4 At least four subtypes include genomically stable, chromosomal instable, microsatellite instable (MSI+) and Epstein Barr virus (EBV+) positive cases, where the latter have a strong implication of immune cells. This heterogeneity can in part explain why only small subgroups of patients respond to targeted therapies. For example, antibodies which inhibit epidermal growth factor signaling provide survival benefit only in Her2+ patients.Citation2 Antibodies blocking immune checkpoint receptors (programmed cell death 1, PD1; -ligand 1, PD-L1) have entered clinical practice for MSI+ cancers, independently of tissue origin, however, less than <15% of patients are eligible.Citation3 Thus, there is urgent clinical need for novel targets in non-MSI+ patients.
Addressing macrophages adds future tools to cancer immunotherapy.Citation5 Recruitment and differentiation of monocytes and/or polarization of tissue-resident, tumor-associated macrophages towards distinct effector phenotypes is shaped by multiple cues, e.g., chemokines or cytokines, released upon infection by pathogens, from inflammatory lesions or the tumor microenvironment. Recently, a general nomenclature was agreed on, where pro-inflammatory (M1) and anti-inflammatory (M2) macrophages shall represent opposite extremes of a high diversity of intermediate functional states.Citation6 In this context, pharmacological reprogramming of myeloid cells may represent an attractive approach to enforce the tumor-attacking cytotoxic profile of macrophages.
Proteins with docking, adapter or scaffold properties modify the responsiveness of gastrointestinal cancer cells to chemo- or targeted therapy in vitroCitation7 and in vivo.Citation8 Docking protein-1 (DOK1) belongs to a family of adapter proteins with seven members, where DOK1/2/3 form cooperative heterodimers mainly in hematopoietic cells, whereas DOK4-7 are predominant in non-hematopoietic cells like brain and muscle.Citation9 WeCitation10 and others described DOK1 as an interaction partner and co-chaperone of transcription factors, prominent in surveillance of cell fate decisions and immunity, including nuclear factor-kappa B (NFκB)Citation11 and peroxisome proliferator-activated receptor gamma (PPARγ).Citation12 DOK1 also binds to the intracellular domains of immune (e.g., toll-like receptors on macrophages) or signaling receptors and alters their activities, such as oncogenic RAS signaling.Citation9 The DOK1 gene is located on human chromosome 2p13.1 and frequently subjected to (epi)genetic alterations and silencing in human cancers.Citation13 DOK1/2/3 triple knock-out mice suffer from histiocytic sarcomas caused by aberrant proliferation of cells from the myeloid lineage, emphasizing the important role of DOK genes in innate immune cells including macrophages.Citation14
The expression of DOK1 can be up-regulated by ligands for nuclear “hormone” receptors, including PPARγ-agonists (e.g., rosiglitazone, rosi),Citation10 retinoic acidCitation15 and dexamethasone.Citation16 Since DOK1 is drugable and responsive to these clinically approved drugs, we hypothesized that DOK1 may be therapeutically exploited as an inhibitor of oncogenic (e.g., RAS) signaling in tumor cells and as an activator of immune receptors in macrophages, allowing dual targeting of aberrant signaling and defective effector functions in tumor and stroma (immune) cells, respectively. To test this, we studied the so far unknown role of DOK1 in macrophages associated with human gastric cancer cells.
Results
Stroma DOK1 is associated with poor prognosis in gastric cancer patients
To elucidate which members of the DOK gene family contribute to survival, bioinformatic analysis was conducted. Oncoprint® filesCitation17 were retrieved from cBioportal of Cancer Genomics based on the two TCGA data sets: [Gastric Adenocarcinoma, TCGA, Provisional (n = 478) and Nature (n = 295)]. Consistent with evidence from lung and colorectum, frequencies of genetic alterations were 25–30% in gastro-esophageal cancers (Table S1, S1a,b). Alterations in DOK1-3 genes (e.g., mutations, deletions, mRNA) expressed in hematopoietic cells, but not in DOK4-7 genes predominant in non-hematopoietic cells predicted poor prognosis in gastric cancer patients. (Table S2, S1c). We therefore focused on DOK1 as an exemplary member of the hematopoietic DOK1-3 subgroup.
To quantify DOK1 mRNA expression, matched frozen tumor (TU) and non-tumor (NT) gastric tissue samples from two independent patient cohorts from Germany (n = 26) and Hong Kong (n = 38) were subjected to RNA extraction. RT-qPCR analysis evinced down-regulation of DOK1 mRNA in 47 of 64 (73%) tumor samples (*p = .0003 TU vs. NT, Wilcoxon test) (). Similar results were obtained from the TCGA data sets above (S2a). DOK1 mRNA expression inversely correlated to its gene methylation status (*p < .0001, Spearman r = – 0.27) (S2b), however, had no impact on survival (S2c,d).
Figure 1. DOK1 expression in gastric cancer patients. (a), DOK1 mRNA. Frozen tissue from matched tumor (TU) vs. normal non-tumor (NT) samples from two independent gastric cancer patient cohorts from Germany (n = 26) and Hong Kong (n = 38) were subjected to RNA extraction. Ct-values of RT-qPCRs normalized to ACTB/B2M were calculated as -fold ± S.E. (*p = .0003 TU vs. NT, Wilcoxon test). (b-c), DOK1 protein. Immunohistochemistry (IHC) on tissue microarrays (TMAs) from US Biomax (ST483) with normal stomach (NT, n = 8) and tumor (TU, n = 40) specimens from gastric cancer patients using mouse monoclonal DOK1 antibody (#A3). (b), Combined scores for intensity and frequency of DOK1 staining are expressed as 0 = negative (0–25%), 1+ = weak positive (25–50%), 2+ = moderate positive (50–75%), 3+ = strong positive (75–100%). Data are absolute case numbers after dichotome grouping of stainings as negative (scores 0/1) vs. positive (scores 2/3) for tumor cells and negative (score 0) vs. positive (scores 1/2/3) for stroma cells, respectively (*p < .05 Fisher Exact test; n.c. = no case recorded). (c), DOK1 positivity was found in the normal gastric glandular epithelium (i) and present (ii, right) or absent (ii, left) in tumor cells of differentiated tumors (intestinal type). DOK1 was also stained in tumor-adjacent stroma cells (iii). Undifferentiated tumors (diffuse type) were positive (iv, right) or negative (iv, left). Representative images are shown. Original magnification 100x; Scale bar = 200 µm. Statistical analysis is detailed in Table S3. (d), DOK1 association with prognosis. Custom-made TMAs with tumor specimens from gastric cancer patients (n = 201) were stained by IHC using rabbit polyclonal DOK1 antibody (#8221). Staining scores were calculated as in (b-c) and correlated to prognosis by Kaplan Meier analysis (*p < .05 log rank test) for overall survival (OS) and tumor-specific survival (TSS) (not shown). Detailed statistics is presented in Tables S4-S5. DOK1 positivity in stroma, but not in tumor cells, predicted poor survival of gastric cancer patients.
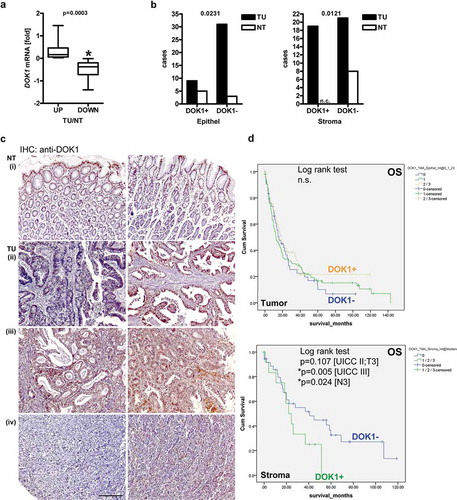
To detect DOK1 protein, immunohistochemistry (IHC) was conducted on commercial (NT n = 8 vs. TU n = 40) (,) tissue microarrays (TMAs). DOK1 was present as cytoplasmic and (peri)nuclear staining in normal gastric glands. DOK1 positivity was lost in a subset or all tumor cells.
Strong positivity was also observed in the non-malignant gastric lamina propria and in tumor-adjacent stroma tissue comprising immune cells (including lymphocytes, granulocytes, and macrophages), smooth muscle cells and fibroblasts, as identified by their specific morphologies.Citation18
Positivity scores were then correlated to clinical factors (Table S3). Overall, DOK1 protein was reduced in tumor cells (S3) compared with non-malignant epithelial cells of gastric glands (n = 48, *p = .0231 TU vs. NT, Fisher Exact test). According to Lauren histology, there was a trend for lower DOK1 expression in tumor cells of diffuse-type compared with intestinal-type gastric cancer (p = .1378). Moreover, DOK1 protein decreased in tumor cells with increasing tumor grade (G) (*p = .0352), size (T) (p = .0798) and spread to local lymph nodes (N) (*p = .0291). Conversely, DOK1 was up-regulated in tumor-adjacent stroma cells (S3) compared to the lamina propria of the non-malignant stomach (n = 48, TU vs. NT: *p = .0121; Lauren: p = .0565; G: p = .0721; T: *p = .0357; N: *p = .0433; Fisher Exact test).
To investigate the impact of DOK1 protein expression on survival, IHC was conducted on a larger series of gastric cancer patient specimens in custom-made (n = 201) TMAs together with the clinical follow-up informationCitation10 (). Positivity scores were then correlated to clinical factors (Table S4) and prognosis (Table S5). Kaplan Meier survival analysis was employed to link DOK1 protein expression to clinical outcomes. Absence of DOK1 (score 0) in tumor cells revealed a tendency for reduced overall survival (OS) (S4) and tumor-specific survival (TSS) (not shown) compared to positive cases (scores 1/2/3) (n = 201, n.s., log rank test). This data were in accordance with our findings in colorectal cancer patients,Citation10 and indicated that loss of DOK1 in glandular epithelial cells contributes to cancer progression. Separate analysis grouped by tumor size (T), nodal spread (N) and union internationale contre le cancer (UICC) stage confirmed these trends without reaching significance for tumor cells (p ≥ 0.143; log rank test).
Conversely and in line with the findings above, presence of DOK1 in tumor-adjacent stroma cells (S5) predicted poor prognosis in cases of advanced disease (UICC stage III *p = .005; UICC stage II/T3 p = .107, N3 *p = .024; log rank test), suggesting that non-epithelial cells in the microenvironment are responsible for unfavorable clinical performance.
DOK1 expression is associated with the EBV+” immune” subtype of gastric cancer
Intrigued by the negative prognostic impact of stromal DOK1, we studied its expression in the four consensus molecular subtypes of gastric cancer,Citation4 based on the TCGA data sets: [Gastric Adenocarcinoma, TCGA, Provisional (n = 478) and Nature (n = 295)]. DOK1 mRNA was low in cases with microsatellite instability (MSI+) and silencing of DNA mismatch repair protein (MLH1) (S6a), whereas DOK1 mRNA was high in patients positive for Epstein Barr virus (EBV+) (S6b-c), indicative of a differential expression and function of DOK1 in distinct subtypes. In accordance with this classification,Citation4 mRNAs of genes encoding toll-like receptors (S7a) and targets of clinical immunotherapy (e.g., PD1/PD-L1, CTLA4/CD86) (S7b) were elevated in EBV+ cases as well. In contrast, there was no association (not shown) with infection by Helicobacter pylori (HP+).
We then stratified our patient cohort according to its infection status (n = 201) (S8, Table S4). Consistent with the evidence that EBV silences DOK1 gene transcription by hypermethylation of its promoter,Citation19 DOK1 protein positivity was reduced in EBV+ tumor cells (n = 10, *p = .044, Fisher Exact test; *p = .013, Spearman correlation). Again, no association with HP+ tumors was recorded (not shown). Conversely, but in line with the molecular evidence obtained from mixed tumor/stroma samples in the TCGA databases, there was increased DOK1 protein expression in tumor-adjacent stroma cells of EBV+ patients (n = 10, *p < .05, Fisher Exact test on percentages). Hence, DOK1 seems to play a role within the tumor microenvironment of the EBV+ subtype independently of HP+ infection.
DOK1 gene alterations in inflammatory macrophages correlate with prognosis
Due to the pivotal role of immune cellsCitation5 in malignancies related to infection by EBV or HP, we asked whether genes involved in their biology contribute to prognosis. DOK1 gene alterations had an impact on survival only when combined with marker genes from macrophages and to a lesser extent with natural killer or FOXP3+ regulatory T-cells, but not with B-lymphocytes or granulocytes [Data set: Gastric Adenocarcinoma, TCGA, Provisional (n = 478)] (Table S6, S9).
To explore which macrophage-related genes contribute to survival, bioinformatics analysis was performed on toll-like receptors and intracellular danger/pathogen-associated molecular pattern receptors of inflammasomes. Consistent with the etiology of HP and EBV in pathogenesis of gastric cancer, toll-like receptors detecting bacteria or viruses were among the hits identified in this in silico screen: Those included the lipopolysaccharide (LPS) receptor TLR4 and the flagellin receptor TLR5 at the plasma membrane and the endosomal nucleic acid sensors TLR3/7. Specifically, alterations in genes related to polarization of macrophages towards the M1 (CD14/CD68/TLR4/NOS2) but not the M2 (CD14/CD68/CD16/CD206) phenotype predicted poor survival in patients (n = 478, *p < .05, log rank test) (, Table S7). In contrast, no significant correlations for intracellular receptors like NOD1/2 or RIG1 were recorded (Table S8). Likewise, alterations in genes encoding targets of clinical immunotherapy (e.g., PD1/PD-L1, CTLA4/CD86) did not impact on prognosis (Table S9).
Figure 2. Alterations in DOK1 and genes related to inflammatory macrophages predict poor prognosis in gastric cancer. (a), Kaplan Meier survival analysis. Files were retrieved from the cBioportal of Cancer Genomics data set: [Gastric Adenocarcinoma, TCGA, Provisional (n = 478 cases), abbrev. GC_Prov (Table S7)]. The correlation of DOK1 with M1 vs. M2 gene alterations to overall survival (OS) was calculated using log rank tests as depicted in the graph. (b), Predominance of TLR4 gene mutations in gastric cancer patients with reduced overall survival (OS) and disease-free (DFS)/progression-free (PFS) survival (n = 23 per group, *p < .05, Fisher Exact test) as evinced in (a). Data were from cBioportal: [GC_Prov] and [Gastric Adenocarcinoma, TCGA, Nature (n = 295 cases), abbrev. GC_Nat]. Legend: Blue line = unaltered cases with favorable prognosis; Red line = altered cases with gene alterations and poor prognosis. (c), DOK1 is part of a drugable gene interaction network in macrophages. Prediction of a 4-gene interaction network based on the data set: [GC_Prov]. DOK1, CD14, NOS2, and TLR4 represent nodes (black circles) which are targeted by clinically approved drugs (yellow diamonds) and other natural compounds or chemicals (white diamonds).
![Figure 2. Alterations in DOK1 and genes related to inflammatory macrophages predict poor prognosis in gastric cancer. (a), Kaplan Meier survival analysis. Files were retrieved from the cBioportal of Cancer Genomics data set: [Gastric Adenocarcinoma, TCGA, Provisional (n = 478 cases), abbrev. GC_Prov (Table S7)]. The correlation of DOK1 with M1 vs. M2 gene alterations to overall survival (OS) was calculated using log rank tests as depicted in the graph. (b), Predominance of TLR4 gene mutations in gastric cancer patients with reduced overall survival (OS) and disease-free (DFS)/progression-free (PFS) survival (n = 23 per group, *p < .05, Fisher Exact test) as evinced in (a). Data were from cBioportal: [GC_Prov] and [Gastric Adenocarcinoma, TCGA, Nature (n = 295 cases), abbrev. GC_Nat]. Legend: Blue line = unaltered cases with favorable prognosis; Red line = altered cases with gene alterations and poor prognosis. (c), DOK1 is part of a drugable gene interaction network in macrophages. Prediction of a 4-gene interaction network based on the data set: [GC_Prov]. DOK1, CD14, NOS2, and TLR4 represent nodes (black circles) which are targeted by clinically approved drugs (yellow diamonds) and other natural compounds or chemicals (white diamonds).](/cms/asset/ce7d2f86-f79d-400b-be75-16087131cdc6/koni_a_1649961_f0002_oc.jpg)
According to the COSMIC/GISTICCitation20 resources, Kaplan Meier curves were then fine-mapped for mutations identified in individual patients in the two TCGA sets [Gastric Adenocarcinoma, TCGA, Provisional (n = 478) and Nature (n = 295)]. TLR4 mutations clustered in those patients who suffered from an unfavorable prognosis as compared with those cases who did not harbor mutations in TLR4 and grouped into the cohort with a better clinical outcome (n = 23 per group, *p < .05, Fisher Exact test) (). Based on studies in esophageal cancer,Citation21 TLR4 mutations result in a loss-of-function protein with an impaired sensitivity to LPS-dependent NFκB activation. Other mutations identified comprised immunotherapy targets (PD1/PD-L1 e.a.), however, did not reach statistical significance, neither did mutations in other toll-like receptors.
Overall, DOK1 could be integrated into a gene interaction network in macrophages (). Prediction based on the data set [Gastric Adenocarcinoma, TCGA, Provisional (n = 478)] connected DOK1, CD14, NOS2 and TLR4 as nodes which, as proteins, are targeted by clinically approved drugs and other natural compounds or chemicals.Citation17
DOK1 expression is elevated in tumor-associated inflammatory macrophages
To critically test our in silico model, IHC was conducted on the same TMA as for DOK1 (NT n = 8; TU n = 48), now using CD68 as a marker for macrophages (). Strong CD68+ positivity was present in tumor-adjacent macrophages compared with single interspersed cells in the lamina propria of normal gastric glands (). In line with others,Citation22 tumor and additional stroma cells were stained as well. Notably, tissue infiltration by CD68+ macrophages increased during disease progression, as observed before for stromal DOK1 (n = 48, *p < .05, Fisher Exact test and Two-way ANOVA). This effect was also evident for tumor grade (G), size (T), nodal status (N) and UICC stage (S10, Table S10).
Figure 3. Correlation of DOK1 with CD68 and iNOS expression in gastric cancer. IHC on commercial TMA (US Biomax, ST483) with normal stomach (NT, n = 8) and tumor (TU, n = 40) specimens from gastric cancer patients using mouse monoclonal CD68 (AM33123SU-N) or rabbit polyclonal iNOS (PA3-030A) antibody, respectively. (a), Single CD68+ macrophages were interspersed between non-malignant gastric glands in the lamina propria (i) and with increasing frequency present (ii-vi) in tumor-adjacent stroma regions and within tumor cells (v-vi). Representative images are shown. Original magnification 200x; Scale bar = 100 µm. (b), Positivity scores for CD68 (as detailed in ) were correlated to clinical factors: tumor (TU), normal/non-tumor (NT). Data are absolute case numbers after dichotome grouping of staining as negative (scores 0/1) vs. positive (scores 2/3) (n = 48, *p < .05 TU vs. NT, Fisher Exact test; n.c. = no case recorded). Statistics is presented in Table S10. (c), Pairwise association of iNOS, CD68 and DOK1 positivity scores in immune infiltrates of tumor tissue. Data are absolute case numbers after dichotome grouping of stainings as negative (scores 0/1) vs. positive (scores 2/3) (TU only; n = 40, *p < .05, Fisher Exact test). Statistics for iNOS is presented in Table S11.
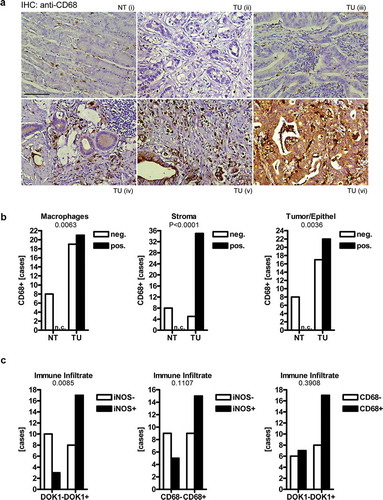
To further elucidate the phenotype of those tumor-associated macrophages, IHC was performed on the same patients, detecting inducible nitric oxide synthase (iNOS) as a marker for inflammation. The iNOS staining was prominent in immune cell infiltrates (including macrophages) and tumor cells,Citation23 but did not reach significance in respect to most clinical factors (S11, Table S11). However, a positive association was found for DOK1 and iNOS protein expression in immune cell infiltrates (including CD68+ macrophages) (n = 48, *p = .0085, Fisher Exact test) (, S12). Thus, DOK1 is present in inflammatory macrophages within the tumor-surrounding tissue microenvironment.
In sum, our findings propose that DOK1 is subjected to compartment-specific regulation and function, and together with macrophage-related gene alterations, such as in TLR4, governs gastric cancer patients’ prognosis.
DOK1 promotes NFκB signaling and polarization to inflammatory macrophages
To elucidate the immunoregulatory role of DOK1 in macrophages, loss- and gain-of-function experiments on polarization and effector functions were performed. Human monocytic leukemia cell lines (THP1, U937) served as a model system for macrophages.Citation24,Citation25 Toll-like receptors undergo endocytosis to endosomes upon ligand-binding resulting in either activation of transcription factors in the nucleus or degradation in lysosomes.Citation26 DOK proteins bind to the intracellular domains of the receptors and interfere with their trafficking routes.Citation9 To decide which mechanism is at work here, THP1 monocytes (Mo/s) were differentiated to adherent M0 macrophages with phorbol 12-myristate 13-acetate (PMA) for 48 h. M0 macrophages were transfected with control or DOK1 shRNA for 24 h before stimulation with LPS (100 ng/ml) for additional 48 h. Cells were then either fixed and permeabilized for detection of total TLR4 or analyzed alive to quantify TLR4 at the cell surface (S13). Flow cytometry evinced no changes in the amounts of total or surface TLR4 (n.s., Two-way ANOVA, n = 3). Hence, DOK1 may impinge on the transcription machinery in the nucleus down-stream of receptor-mediated endocytosis.
We then asked whether DOK1 governs NFκB signaling downstream of TLR4. M0 macrophages were transfected with shRNAs for 48 h before stimulation with LPS (100 ng/ml) for 0–60 min to trigger rapid phosphorylation-dependent activation and degradation of components of the NFκB signaling cascade (). Western blot analyses from total cell lysates revealed that DOK1 knock-down enhanced phosphorylation and total amount of inhibitor-kappa B-alpha (IκBα). This held true for basal (t = 0 min) and stimulus-dependent (t = 5–10 min) conditions (*p < .05 shDOK1 vs. shCON, Two-way ANOVA, n = 3). Thus, DOK1 increases IκBα degradation, which indicates activation of the NFκB-pathway.
Figure 4. DOK1 increases NFκB signaling and gene expression. (a), DOK1 promotes NFκB signaling. THP1 M0 macrophages were transfected with DOK1 shRNA or control shRNA plasmids for 48 h. Thereafter, cells were incubated with or without LPS for the times indicated (min) before extraction of total cell lysates. Representative gels (right) and quantitative analyses (left) are presented. Optical density values from bands in gels from Western blots were normalized to HSP90 and presented as -fold ± S.E. (*p < .05 shDOK1 vs. shCON, Two-way ANOVA, n = 3). (b), DOK1 increases NFκB-dependent promoter activity. HEK293T (pos. control) cells were transfected as in (a) for 6 h together with a luciferase reporter gene construct detecting NFκB-driven transcriptional responses. Thereafter, cells were incubated with or without PMA (pos. control), Poly I:C, flagellin and LPS, for additional 48 h. Luciferase activity was normalized to protein content and expressed as -fold ± S.E. (*p < .05 shDOK1 vs. shCON, Two-way ANOVA, n = 3 per stimulant).
The activatory p65 subunit of NFκB was rapidly phosphorylated in control cells (t = 5–10 min), but remained unresponsive to stimulation after DOK1 knock-down, despite elevated basal levels (t = 0 min). Hence, DOK1 seems to activate NFκB in macrophages.
To elucidate transcriptional events, HEK293T (as pos. control) cells were transiently transfected with shRNAs for 6 h together with a luciferase reporter construct detecting NFκB-driven promoter activity (). Thereafter, cells were incubated with PMA (pos. control) or ligands for TLR3 (Poly I:C), TLR5 (flagellin) or TLR4 (LPS) for 48 h, followed by quantification of luciferase activity in total cell lysates (*p < .05 shDOK1 vs. shCON, Two-way ANOVA, n = 3 per stimulant). Again, DOK1 knock-down diminished NFκB-dependent reporter gene expression independently of the stimulus applied. In sum, DOK1 augmented NFκB-signaling in a receptor-dependent and -independent manner.
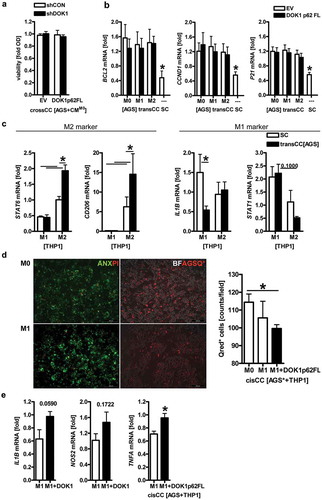
We then examined whether DOK1 induces endogenous NFκB-target gene expression in polarized macrophages.Citation6,Citation24 To this end, THP1 M0 macrophages were transfected with empty vector (EV) or DOK1 p62 full-length (FL) expression plasmid followed by in vitro polarization to the M2 phenotype by IL4/IL13 and to the M1 phenotype by LPS/IFNγ for 48 h. RT-qPCR analyses () confirmed increased expression of mRNAs encoding cognate macrophages markers, such as STAT6/TGFB for M2 vs. STAT1/NOS2 for M1 phenotypes (*p < .05 M2 vs. M1, Kruskal Wallis test, n = 3). Similar results were obtained from U937 cells (not shown). Overexpression of DOK1 reduced CD206/CD163 mRNAs in M1 and M2 macrophages (*p < .05 DOK1 vs. EV, Two-way ANOVA, n = 3) and exerted a trend to increase TNFA/IL1B mRNAs in M1 macrophages (p < .1 DOK1 vs. EV, Two-way ANOVA, n = 3) (). Conclusively, these findings pointed at a role for DOK1 in polarization of macrophages towards the inflammatory M1-like phenotype.
Figure 5. DOK1 promotes polarization to inflammatory macrophages. DOK1 down-regulates M2, but increases M1 marker gene expression. THP1 M0 macrophages were transfected with empty vector (EV) or DOK1 p62 FL expression plasmids, followed by polarization to M1 by LPS/IFNγ and to M2 by IL4/IL13 for a total of 48 h before RNA-extraction. Ct-values of RT-qPCRs normalized to B2M were calculated as -fold ± S.E. (*p < .05 vs. EV, Two-way ANOVA, n = 3 per gene). (a) DOK1-independent and (b) DOK1-dependent mRNAs.
DOK1 in inflammatory macrophages reduces viability of gastric cancer cells
To explore the anti-tumor effects of DOK1 in macrophages, co-cultures with human gastric cancer cell lines (AGS, MKN45) were established. We first investigated whether DOK1 alters the viability of gastric cancer cells in “cross” cultures (crossCC) (): THP1 M0 macrophages were transfected with shRNA or expression plasmids for 72 h before collection of conditioned medium. The latter was transferred to a > 90% confluent 2D monolayer of AGS cells, and viability was measured by colorimetric MTT assay after additional 2 days. However, no changes were observed (n.s., Two-way ANOVA, n = 3). Similar results were obtained from MKN45 cells (not shown).
Figure 6. DOK1 in macrophages reduces viability of gastric cancer cells. (a–c), Soluble factors derived from macrophages are insufficient to alter gastric cancer cell viability. (a), “Cross”-cultures (crossCC): THP1 M0 macrophages were transfected with shRNA or expression plasmids for 72 h before collection of conditioned medium. The latter was transferred to subconfluent monolayers of AGS (or MKN45) cells, and viability was measured by colorimetric MTT assay after 2 days. Optical density values were calculated as -fold ± S.E. compared with day 0 (n.s., Two-way ANOVA, n = 3). (b-c), Trans co-cultures (transCC): THP1 M0 macrophages were transfected with EV or DOK1 p62 FL for 6 h before polarization to M1 or M2 for additional 48 h. Macrophages in 3D trans-well inserts were then co-cultivated separated from adherent AGS monolayers for additional 48 h. Naïve AGS in single culture (SC) served as control. Ct-values of RT-qPCRs normalized to B2M were calculated as -fold ± S.E. (*p < .05 transCC vs. SC, Two-way ANOVA or Kruskal Wallis test, n = 3). (b) AGS and (c) macrophage mRNAs after coculture. (d), DOK1 in macrophages reduces viability of human gastric cancer cells in a contact-dependent manner. Cis co-cultures (cisCC): THP1 M0 macrophages were transfected as in b-c, left unpolarized or were polarized to M1 for a total of 48 h before exposure to red 655 nm QTracker-labelled AGS* cells for additional 48 h. Data from live cell imaging are mean numbers of remaining red-labeled AGS* cells per field ± S.E. (*p < .05 DOK1 vs. EV, Kruskal Wallis test, n = 10 fields per sample, n = 5 independent experiments). Color code: red = AGS* or propidiumiodide (abbrev. PI; necrotic cells); green = annexin (abbrev. ANX; apoptotic cells); white/grey = brightfield (abbrev. BF). Original magnification 100x; Scale bars = 200 µm. (e), DOK1 in M1 macrophages increases inflammatory gene expression. RNA was extracted from mixed cell samples upon cisCC in panel (d). Ct-values of RT-qPCRs normalized to B2M were calculated as -fold ± S.E. (*p < .05 DOK1 vs. EV, Mann Whitney test, n = 3).
Next, macrophages and gastric cancer cells were subjected to 3D co-cultures. THP1 M0 macrophages were transfected with EV or DOK1 p62 FL followed by polarization to M1 by LPS/IFNγ and to M2 by IL4/IL13 for a total of 48 h. Macrophages in trans-well inserts were subsequently co-cultivated (in trans) with subconfluent monolayers of AGS cells for additional 48 h. RNA was extracted separately from both compartments and analyzed by RT-qPCR. Expression of mRNAs encoding anti-apoptotic Bcl-family genes (e.g., BCL2) and cell cycle regulators (e.g., CCND1, P21 CIP1/WAF1) was increased in AGS cells after co-culture (transCC) with macrophages compared with naïve AGS cells in single culture (SC) without prior exposure to macrophages (). In contrast, mRNAs of pro-apoptotic Bcl-family genes (e.g., BAK1, BAD, BAX) remained unaffected (not shown). These data indicated that soluble factors secreted by macrophages in a contact-independent manner are insufficient to inhibit growth or lower the viability of gastric cancer cells.
Moreover, STAT6 and CD206 (*p < .05 transCC vs. SC, Two-way ANOVA, n = 3) were augmented in M2 macrophages upon co-culture with AGS cells, whereas IL1B (*p < .05) was reduced in M1 macrophages (). DOK1 had no effect on all genes examined under these conditions (not shown). In sum, gastric cancer cells seem to establish an immunosuppressive micromilieu favoring M2 vs. inflammatory, potentially tumor-attacking M1 macrophages.
To finally evaluate if cell-cell contact is required for a cytotoxic response of macrophages against cancer cells, THP1 M0 macrophages were transfected with EV or DOK1 p62 FL and polarized to M1 for 48 h, followed by an 48-h overlay (in cis) with suspended AGS cells which had been pre-labelled with QTracker 655 nm (). Live cell imaging of direct co-cultures (cisCC) using green autofluorescence (488 nm) for macrophages and red fluorescence (655 nm) for labeled cancer cells, recorded less viable AGS cells in presence of DOK1 (*p < .05 vs. EV, Kruskal Wallis test, n = 5). Parallel staining of co-cultures by annexin and propidiumiodide confirmed an increase of apoptotic and necrotic cells in this setting, respectively. In mixed samples of co-cultured THP1/AGS cells, mRNA expression of TNFA (*p < .05 vs. EV, Mann Whitney test, n = 3) was augmented, IL1B (p = .059) and NOS2 (p = .172) displayed a trend (). Thus, DOK1 seems to promote cytotoxic effector functions of inflammatory (M1-type) macrophages against human gastric cancer cells in a contact-dependent manner.
DOK1 in inflammatory macrophages down-regulates PD-L1
In quest of the underlying molecular players, we identified the immune checkpoint receptor ligand PD-L1 as one exemplary target for DOK1 in macrophages. IFNγCitation27 and LPSCitation28 are potent inducers of PD-L1 expression, which, together with PD-1, is a negative regulator of macrophage function such as phagocytosis.Citation29 Western blot analyses from THP1 and U937 cells evinced that PD-L1 protein was increased upon polarization by LPS/IFNγ in M1 but not by IL4/IL13 in M2 macrophages (). We then transfected M0 THP1 macrophages with EV or DOK1 p62 FL followed by polarization and trans-well co-culture (transCC) with AGS cells as above. RT-PCR analyses confirmed an increase of PDL1 mRNA in M1 but not in M2 macrophages. Of note, DOK1 diminished PDL1 mRNA expression in M1 macrophages (). On the tumor cell side, PDL1 mRNA was elevated in co-cultured (transCC) AGS cells compared with naïve, single cultured (SC) AGS cells (). PD-L1 protein also remained high in mixed samples of THP1/AGS cells upon cell contact-dependent co-culture (cisCC) (). Likewise, the cyclin-dependent kinase inhibitor and senescence marker P21 CIP1/WAF1 was up-regulated, alluding at a cell cycle arrest event under these conditions. Taken together, DOK1 may contribute to a more inflammatory (M1-like) phenotype by down-regulation of the negative immune checkpoint receptor PD-L1 in macrophages.
Figure 7. DOK1 down-regulates PD-L1 in macrophages. (a), M1 macrophages express PD-L1 protein. THP1 monocytes (Mo/s) were differentiated to adherent M0 macrophages for 48 h and polarized to M1 or M2 for additional 48 h. Representative results (right) and quantitative analyses (left) are presented. Data from Western blots were normalized to HSP90 and calculated as -fold ± S.E. (*p < .05 vs. M1, Kruskal Wallis test, n = 3). (b), DOK1 down-regulates PDL1 mRNA in M1 macrophages. THP1 M0 macrophages were transfected with EV or DOK1 p62 FL for 6 h before polarization to M1 or M2, followed by transCC with AGS as described. Ct-values of RT-qPCRs normalized to B2M were calculated as -fold ± S.E. (*p < .05 vs. M1 and DOK1, Two-way ANOVA, n = 3). (c), Up-regulation of PDL1 mRNA in gastric cancer cells after co-culture with macrophages. AGS cells from SC or transCC with macrophages in (b) were subjected to RNA extraction. Ct-values of RT-qPCRs normalized to B2M were calculated as -fold ± S.E. (*p < .05 transCC vs. SC, Kruskal Wallis test, n = 3). (d), Up-regulation of PD-L1 protein and P21 CIP1/WAF1 in co-cultures of gastric cancer and macrophages. Cells from SC or mixed AGS/THP1 samples from cisCC were subjected to protein extraction. Data from Western blots are presented as -fold ± S.E. (*p < .05 cisCC vs. SC, Kruskal Wallis test, n = 3).
DOK1 is a drugable adapter protein in macrophages via PPARγ
To elaborate whether DOK1 may be exploited as a drugable target, we resorted to the fact that DOK1 can be up-regulated by PPARγ-agonists.Citation10,Citation12 To test if this holds true for macrophages, human monocytic (THP1, U937) and T-cell (Jurkat) leukemia cell lines were grown in suspension (Mo/s), adherent normal epithelial (GES1) and gastric cancer (AGS, MKN45) cell lines until subconfluency, before addition of 1 or 10 µM rosiglitazone (rosi) for 24 to 48 h. RT-qPCR () and Western blot () analyses revealed that basal expression of the DOK1 p62 FL isoform was low in leukemia cells, whereas the smaller DOK1 p37-44 variants were readily detectable.Citation8,Citation10 Mining of the CCLECitation30 database (n = 1020) confirmed the copy number alterations found in patients before and down-regulation of DOK1 mRNA in a series of human gastric cancer compared to hematopoietic cell lines (S14, Table S12).
Figure 8. DOK1 is a drugable adapter protein in macrophages via PPARγ. (a–b), PPARγ-agonist up-regulates DOK1 mRNA/protein expression. Cell lines were incubated with increasing concentrations of rosiglitazone (rosi) or vehicle (DMSO) for the indicated times. Legend: 1 = 0 µM, 2 = 1 µM, 3 = 10 µM (24 h); 4 = 0 µM, 5 = 1 µM, 6 = 10 µM (48 h) rosi. (a), Ct-values of RT-qPCRs normalized to ACTB/GAPDH/B2M were calculated as -fold ± S.E. (*p < .05 vs. vehicle, Kruskal Wallis test, n = 3 per cell line). (b), Representative gels (right) and quantitative analyses (left). Data from Western blots normalized to β-actin were calculated as -fold ± S.E. (*p < .05 vs. vehicle, Kruskal Wallis test, n = 3 per cell line). (c), PPARγ-agonist up-regulates GRZB mRNA in macrophages. THP1 M0 cells were polarized to M1 or M2 for 48 h in presence or absence of rosi (10 µM), followed by transCC with AGS cells as described. Ct-values of RT-qPCRs normalized to B2M were calculated as -fold ± S.E. (*p < .05 vs. vehicle, Two-way ANOVA, n = 3 per gene). (d), PPARγ-agonist increases inflammatory gene expression in contact-dependent co-cultures (cisCC) with macrophages. THP1 M0 cells were transfected and polarized to M1 in presence or absence of rosi (10 µM), followed by cisCC with AGS cells for additional 48 h. Ct-values of RT-qPCRs normalized to B2M were calculated as -fold ± S.E. (*p < .05 vs. vehicle or EV, Two-way ANOVA, n = 3 per gene). (e), PPARγ-agonist reduces the viability of gastric cancer cells in contact-dependent co-cultures (cisCC) with macrophages. THP1 M0 cells were transfected and polarized to M1 in presence or absence of rosi (10 µM), followed by exposure to red 655 nm QTracker-labelled AGS* cells as detailed in . Data are mean AGS* cell numbers ± S.E. (*p < .05 vs. vehicle, Kruskal Wallis test, n = 5). (f), Scheme of DOK1 signaling in macrophages. PPARγ-agonist (rosi) up-regulates DOK1 in macrophages, which in turn inhibits PD-L1 and thereby enhances M1-like functions (e.g., inflammation, cytotoxicity, phagocytosis) against tumor cells. This approach may synergize with clinically-in-use immunotherapy (e.g., by PD1 blocking antibodies, abbrev. IT Ab) against PD-L1+ tumor cells (such as in EBV+ gastric cancer). Detailed description is provided in S16.
Consistent with previous findings in gastrointestinal cancer cells,Citation8,Citation10 PPARγ-agonist (rosi) increased DOK1 mRNA and protein by 4–8 fold (*p < .05 vs. vehicle, Kruskal Wallis test, n = 3 per cell line) in monocytes, but not in Jurkat cells. Similar results were obtained with pioglitazone and nitrated linoleic acid, a natural PPARγ-agonist (not shown). Overall, granzyme B (GRZB) remained the gene most robustly up-regulated by rosi (~fourfold, *p < .05 M1 vs. M2, Two-way ANOVA, n = 3) in macrophages upon transCC with AGS cells (). Rosi also increased IL1B and TNFA mRNAs in DOK1 p62 FL-proficient M1 macrophages (~twofold, *p < .05 vs. EV, Two-way ANOVA, n = 3) (), accompanied by an enhanced cytotoxic efficacy of macrophages towards AGS cells in cisCC conditions (). Hence, PPARγ-agonist may be a useful pharmacological tool to boost DOK1 expression in differentiating monocytes and skew the innate immune response in macrophages towards a more inflammatory (M1-like) anti-tumor profile ().
To translate our findings from leukemia cell lines to human primary monocytes, peripheral blood mononuclear cells (PBMCs) were isolated from whole blood of healthy male donors (n = 8). Western blot analyses proved basal expression of DOK1 p62 FL and PD-L1 proteins compared to matched lymphocytes (S15a). Adherent monocytes were transfected with EV or DOK1 p62 FL for 48 h followed by RNA extraction. RT-qPCR analysis confirmed the results collected from leukemia-derived macrophages that DOK1 reduces PDL1mRNA levels (S15b). As before in THP1 and U937 M1 macrophages, adherent primary monocytes treated with LPS and IFNγ for 48 h had elevated PDL1 mRNA compared with untreated ones (S15c). To finally interrogate if DOK1-mediated down-regulation of PD-L1 is a more general effect, M0 THP1 (and HEK293T or AGS cells as control) were transfected with EV or DOK1 p62 FL for 48 h together with −2kB pPDL1 promoter luciferase reporter gene plasmid. In all cell lines tested, DOK1 inhibited PDL1 promoter activity (*p < .05 vs. EV, Mann Whitney test, n = 3 per cell line) (S15d). Thus, DOK1 down-regulates PD-L1 in immune and tumor/epithelial cells, a fact which may underlie its prognostic role in gastric cancer patients.
Discussion
The current study describes DOK1 as prognostic factor and, via PPARγ, as potentially drugable target for reprogramming of macrophages to unleash inflammatory (M1-type) cytostatic or cytotoxic effector functions against human gastric cancer cells. Our findings propose that pharmacological addressing of DOK1 in macrophages provides one (of many) exemplary mechanistic explanation for the recent appreciation of this ligand-regulated transcription factor in disease conditions, e.g., in hematological malignancies.Citation31,Citation32
In gastric cancer, chromosomal breaks at the fragile locus 18C have been associated with reduced DOK6 expression,Citation33 and DOK2 correlated to prognosis.Citation34 However, the clinical relevance of DOK1 remained unknown. Consistent with the acknowledged function of DOK1 as a tumor suppressor in epithelial cells,Citation35 we previously found DOK1 to be down-regulated in tumors of genetically modified mouse models driven by host and viral oncogenes compared to the normal gastrointestinal mucosa,Citation8,Citation36 and its loss to be a negative prognostic factor in colorectal cancer patients.Citation10 Likewise, DOK1 diminished proliferation, but enhanced expression of genes related to differentiation and mucosal immune defense.Citation8,Citation10 We now demonstrate that DOK1 is also down-regulated in tumor cells of gastric cancer patients. Pathogens (e.g., Herpes Simplex Virus-1)Citation37 or oncogenes (like RAS)Citation38 evoke the degradation of DOK1 protein via the ubiquitin-proteasome pathway, while EBV silences DOK1 mRNA expression by methylation of its promoter.Citation19 Consistent with this evidence, DOK1 protein was found to be reduced in gastric tumor cells of EBV+ cases.
Conversely, DOK1 was up-regulated in tumor-adjacent stroma cells of EBV+ patients, and its expression, here predominantly in CD68+ macrophages, had a negative impact on patients’ survival. In these tumor-infiltrating CD68+ macrophages, a positive association for DOK1 and iNOS positivity was found, suggesting that the production of pro-inflammatory mediators (like nitric oxide) may be connected to the poor prognosis in these patients. CD206+ macrophages were also identified in the tissues, however, without reaching statistical differences (not shown), indicative of a dynamic mixture and coexistence of M1/M2-type tumor-associated macrophages in gastric cancer, as stated by others.Citation39–Citation42 Conclusively, DOK1 seems to be subjected to loss in tumor cells vs. gain in stroma cells. This differential expression in epithelial (tumor: low) vs. non-epithelial (stroma: high) may also endow DOK1 with specific functions in given cell types and may allow adaptive reprogramming between different polarization types.
Subsequent stratification of patients from mixed tumor/stroma samples based on public TCGA data sets,Citation17 confirmed the gain in EBV+ gastric cancer casesCitation4 which exhibits strong infiltration of immune cells and expression of checkpoint molecules (e.g., PD1, PD-L1, CTLA4)Citation43,Citation44 and, thus, is the subtype most receptive to current clinical immunotherapies with antibodies (e.g., pembrolizumab, ipilimumab).Citation45,Citation46 Consistent with this clinical evidence, we confirmed that EBV+ samples positively correlated with DOK1 mRNA expression together with toll-like receptorsCitation26 and checkpoint molecules.Citation4 We were also able to demonstrate that DOK1 gene alterations could be integrated into a drugable interaction networkCitation17 with CD14, TLR4 and NOS2 comprising genes essentially related to macrophage biology. Collectively, this pro-inflamed and immunogenic microenvironment offers a variety of drug targets for novel macrophage-directed therapies.Citation5
Intrigued by the unfavorable impact of stromal DOK1 on prognosis, we were prompted to mechanistically elucidate the function of DOK1 on differentiation, polarization and effector functions of monocytic leukemia cell lines as in vitro models of human macrophages.Citation25 In line with the observed loss of DOK1 in gastric tumor cells, hematopoietic cell lines expressed higher levels of DOK1 mRNA than most gastric cancer cell lines, corroborating the differential role of DOK1 in blood-borne vs. epithelial cells.Citation9
Historically, DOK1 was regarded as a general signaling inhibitor of trans-membrane molecules including toll-like receptors.Citation9 This view is now challenged by several reports: For example, DOK1/2 enhance production of protective gut mucosa-associated cytokines. Loss of Dok1/2 in mice evoked colitis and lowered IL17A and IL22 production.Citation47 DOK1 is also required for homeostasis of myeloid cells,Citation48,Citation49 differentiation of human and murine cytotoxic natural killer (NK) and T effector cells and mounting of anti-viral immune responses. DOK1/2 regulate development and function of NK,Citation50 γδ NK/T,Citation51 memoryCitation52 and virus-specific CD8 + T-cells.Citation53 Cytotoxic NK/T cells and macrophages secrete interferons, granzymes, nitric oxide and tumor necrosis factor-alpha (TNFα), and may thus be useful for launching anti-tumor responses. Further emphasizing an activatory function of DOK1 in innate immune cells, including macrophages, DOK1 has been shown to be integrated in pathogen-sensing receptor complexes facilitating host susceptibility towards infections by viruses, parasites, and bacteria, e.g., for Pseudomonas aeruginosaCitation54 or Helicobacter pylori.Citation55 DOK proteins are also recruited to the phagosome during infection with Leishmania major, and control danger- or pathogen-associated molecular pattern receptors receptor signaling (e.g., LPS) by binding to the intracellular domain of toll-like receptors.Citation56 Accordingly, we demonstrated that DOK1 activates NFκB-dependent gene expression in macrophages. However, this effect was independent of receptor-mediated endocytosis and downstream of TLR4.
To explain the underlying molecular mechanism, how DOK1 activates transcription, we resorted to the notion that DOK proteins act as co-chaperones of transcription factors. For example, DOK3 is required for interferon-beta (IFNβ) synthesis resulting in interferon-regulatory factor-3 (IRF3) binding and activation at the IFNβ promoter in macrophages.Citation57 Macrophages lacking DOK3 had an impaired in IFNβ production upon influenza virus infection or Poly I:C stimulation.Citation57 DOK1 activates NFκB in individuals with a fatal response to infection with EBV.Citation11 Likewise, DOK4 stimulates NFκB-dependent TNFα expression in endothelial cellsCitation58 and ETS transcription factor-4 (Elk4), downstream of RAS signaling, by interaction with its transactivation domain.Citation59 In accordance, our data propose that DOK1 activates NFκB-driven gene expression in the nucleus downstream of membrane-proximal receptors.
This concept was further supported by the observed impact of DOK1 on macrophage polarization, where it increased M1 but decreased M2 marker gene expression profiles. Because the observed gene effects occurred in response to either LPS/IFNγ or IL13/IL4, DOK1 seems to squelch and rewire transcription far down-stream of the converging cytokine-receptor-pathways. Nonetheless, one cannot exclude the possibility that DOK1 also modified the activities of additional transcription factors. Notably, DOK1 prevented the IFNγ/LPS-driven up-regulationCitation27 of the inhibitory immune checkpoint receptor PD-L1 in M1 macrophages, an event which may be achieved by a similar transcriptional co-chaperone mechanism as suggested by the recent report showing that DOK3 is implicated in PD-L1 expression in plasma cells via nuclear factor of activated T-cells (NFAT).Citation60 Conclusively, our study suggests a role for DOK1 in inflammatory M1 macrophage in reprogramming of nuclear transcriptional responses downstream of immune receptor signaling, to foster synthesis of inflammatory cytokines, cytotoxic factors and dampen inhibitory receptors.
To simulate the stroma-tumor microenvironment in vitro, we studied the cross-talk between gastric cancer cells and macrophages in indirect (soluble-factor-driven) vs. direct (cell-contact-dependent) coculture systems. Notably, direct co-cultures achieved stronger cytotoxic efficacy than indirect ones where macrophages were physically separated from cancer cells or “cross”-cultures with transfer of conditioned medium only. How could this advantage be achieved? DOK1 promotes cell adhesion and migration via interaction with integrins.Citation61 Integrins are also involved in immune-target cell recognition, so may reinforce cell-cell contacts in co-cultures. Their physical connection to the underlying actin cytoskeleton also implicates them in phagocytosis and efferocytosis, two important mechanisms of pathogen or tumor cell elimination.Citation5 As such, immune receptor-ligand pairs like PD1-PDL1 may contribute and re-enforce cell-cell communication as well.Citation29 In line with the alterations in immune receptor and cytokine profiles, contact of gastric cancer cells with macrophages triggered a concomitant increase in the cell cycle inhibitor and senescence marker P21 CIP1/WAF1. In normal and transformed epithelial cells, P21 marks growth arrest at G1/S phase, in macrophages it was evinced as a marker of exhaustion and tolerance.Citation62 Hence, its strong up-regulation in tumor cell-macrophage co-cultures may be an indicator of an immunosuppressive milieu which prevents efficient killing and elimination of cancer cells despite cytostasis. Some aspects observed in monocytic leukemia cell models could be recapitulated in human primary blood monocytes, i.e., the inhibition of PD-L1 by DOK1, fostering the hope for future translational studies in more advanced patient-derived ex vivo cocultures with autologous or allogenic settings.
DOK1 mRNA and protein expression can be induced in vitro and in vivo by pharmacological activation of members of the nuclear “hormone” receptor superfamily including retinoic acid receptor,Citation15 glucocorticoid receptorCitation16 and PPARγ (e.g., by high-fat diet).Citation12 As for gastrointestinal cancer cell lines,Citation8,Citation10 this phenomenon was now recapitulated for monocytic leukemia cells, proposing DOK1 as a drugable adapter protein also in the myeloid cell linage. We and others collected evidence for a feed-forward amplification loop (see model in S16), where PPARγ induces DOK1, and DOK1 in turn increases the transcriptional activity of PPARγ via its dual function as a transcription factor co-chaperone and RAS-MEK1/2-ERK1/2 pathway inhibitor relieving inhibitory post-translational modifications from PPARγ.Citation8,Citation12,Citation63,Citation64 In this context, PPARγ-agonist may be used as pharmacological tool to boost this reshaping of macrophage phenotypes and effector profiles.Citation25
The results obtained from this study suggest a novel role for DOK1 in patients with EBV+ gastric cancer, where it was found to be co-upregulated with toll-like receptors and targets of clinical immunotherapy (e.g., PD1, PD-L1, CTLA4). Moreover, we provide mechanistic insights into the pathways of the interaction between gastric cancer cells and the immune microenvironment, which comprised DOK1-driven activation of NFκB and inhibition of PD-L1 expression in inflammatory (M1-type) macrophages. Hence, DOK1 in tumor-associated macrophages may predict poor prognosis regarding patient survival especially in advanced stage gastric cancer if inflammation prevails. On the other hand, DOK1, via PD-L1 inhibition, may constitute a drugable target and/or predictive marker for a favorable clinical response to PD1/PD-L1 blocking antibodies in genetic subtypes of gastric cancer with “hot”/inflamed tumors (such as EBV+ and MSI+). Our findings also provide a basis for the repurposing of existing anti-diabetic drugs across disease areas in combination with approved immunotherapeutics for anti-cancer treatment. In sum, the data enabled us to conclude that DOK1 is a tumor suppressor and immune receptor regulator which allows dual targeting of aberrant receptor signaling in both tumor and stroma (immune) cells for potential application in future macrophage-based therapeutic strategies against gastric cancer.
Materials and methods
Reagents
Chemicals were purchased from Merck or Sigma (Darmstadt, Germany) if not mentioned elsewhere. Rosiglitazone (rosi) was from Cayman Chemical (Ann Arbor, MI). Antibodies are listed in Table S13.
Subjects
Human ethics approvals (2014-633N-MA, 2012-336N-MA, 2017.176-CUHK-NTEC CREC) were granted for retrospective analysis of formalin-fixed paraffin-embedded (FFPE) and fresh frozen tissue specimens from gastric cancer patients which had been collected as endoscopic biopsies or from surgical resection upon written consent. In addition, patient samples were obtained as custom-made (Kiel, Germany)Citation65 or commercial (US Biomax, Rockville, MD) tissue microarray (TMA). EBV+ patients were identified by in situ hybridization.Citation66 All studies were conducted in accordance with the Helsinki Declaration of 1975.
Immunohistochemistry (IHC)
Sections (3 µm) were cut from FFPE tissue blocks using a manual microtome (Leica RM 2145, Wetzlar, Germany), transferred to glass slides (Superfrost™, Thermofisher Scientific, Waltham, MA) and stained with hematoxylin and eosin (H&E) in automated devices (Leica XL ST5010). Antibody staining was conducted as follows:Citation10 In brief, antigen retrieval was performed by heating deparaffinized sections in antigen unmasking solution H-3000 (Vector Laboratories, Burlingame, CA), followed by quenching of endogenous peroxidase with H2O2 and blocking with serum as recommended by the manufacturer. Antibodies were diluted as detailed in (Table S13), and staining was processed according to the protocol provided by the Vectastain ABC kit (Vector Labs.). The colorimetric substrate 3,3ʹ-diaminobenzidine (DAB) (Vector Labs.) was employed for detection (brown color) followed by hematoxylin counterstaining (blue color). Slides were photographed using a digital camera-connected (Leica LAS, version 4.12) bright-field microscope (Leica DM IRB).
Signals from antibodies were quantified observer-blinded in digital images by using Image J software (imagej.nih.gov/ij) (n > 20 signals per field; n = 5 fields per image). Frequency and intensity of staining positivity were determined: The staining scores were defined as 0+ = negative (0–25%), 1+ = weak (25–50%), 2+ = moderate (50–75%), 3+ = strong (75–100%). The cut-off values for dichotome analysis of staining scores (0 to 3+) were calculated as ≥2.0 for tumor and stroma positivity.Citation10 Percentages were calculated as positive cells divided by the total number of cells per field at an original magnification of 100-200x. Normal epithelial vs. tumor cells and non-malignant lamina propria vs. tumor-adjacent stroma cells (including lymphocytes, granulocytes, fibroblasts, and smooth muscle) were identified in H&E and IHC stainings by their typical morphologies according to the guidelines of the Vienna classification.Citation18
Cell lines
Human embryonic kidney cells transformed by large T-antigen from Simian Virus-40 (HEK239T), T-cell (Jurkat), monocytic leukemia (THP1, U937), normal epithelial (GES1) and gastric adenocarcinoma (AGS, MKN45) cell lines were obtained from the American Type Culture Collection (ATCC, Manassas, VA) and kept in Roswell Park Memorial Institute (RPMI) 1640 medium or Dulbecco’s Modified Eagle’s Medium (DMEM) according to the guidelines of the distributor at 37°C and 5% CO2 in a humidified atmosphere. Basal media, herewith defined as “complete” media, were supplemented with 10% (v/v) fetal calf serum, 2 mM L-glutamine and 100 U/ml penicillin/streptomycin (all from Thermofisher Scientific).
DNA-constructs
Full-length (FL) DOK1 cDNA (aa 1–481; 62 kDa) was inserted into pTarget (Promega, Madison, WI).Citation10 pGEX-2TK-PPARγ (GST-N-terminal PPARγ: aa 1–248; 53 kDa) was from Addgene, Cambridge, MA (#16549). −2kB pPDL1-pGL3-luc and NF-κB-RE [NlucP/NF-κB-RE/Hygro] were from Promega (Madison, WI). DOK1 shRNA was from Qiagen (Hilden, Germany). Transient transfections were done with TurboFect® (Thermofisher Scientific) in HEK293T and gastric cancer cells and Fugene® (Roche Diagnostics GmbH, Mannheim, Germany) in THP1 (M0) macrophages as described by the manufacturers. Luciferase activity was measured using Dual-Luciferase® Reporter Assay System (Promega) by a multiplate reader (Infinite 200, Tecan, Männedorf, Switzerland).
PCR
Nucleic acids were isolated with RNeasy Mini Kit (Quiagen), and RNA was subjected to reverse transcription (RT) with Verso cDNA Synthesis Kit (Thermofisher Scientific). Quantitative real-time PCR (qPCR) was conducted in a qTOWER3 device (Analytik Jena AG, Germany) with the software qPCR3.4 (Analytik Jena) using SYBR™ Green PCR Master Mix (Thermofisher Scientific) according to the MIQE guidelines.Citation67 Default program was set to 40 x [95°C, 3 sec & 60°C, 30 sec]. Quality control was evinced by melting curves and visualization of amplicons after ethidium bromide gel electrophoresis. Ct-values were normalized to beta-2-microglobulin (B2M) and calculated employing the ΔΔCT method.Citation68 Primers are listed in Table S14.
Western blot
Proteins were extracted in lysis buffer [50 mM Tris-HCl pH 7.4, 1% (w/v) sodium dodecyl sulfate (SDS), 1 mM Na3VO4, 1 mM dithiothreitol, Protease Inhibitor Complete®, Roche] followed by 3 × 3 sec sonification (30% amplitude, Sonoplus HD 2070, Bandelin, Berlin, Germany) and centrifugation in a bench-top centrifuge (13.000 rpm, 10 min, 4°C). Supernatants were subjected to colorimetric quantification (Pierce BCA protein assay, Thermofisher Scientific) and stored at −20°C. Polyacrylamide gel electrophoresis and Western blotting were conducted following the procedures of the distributor (Bio-Rad Laboratories GmbH, Munich, Germany). Gels were loaded with equal amounts of protein (25 µg/lane), and transfer was visualized by Ponceau Red staining of nitrocellulose membranes. Primary and secondary peroxidase-coupled antibodies (Amersham GE, Little Chalfont, UK) were diluted as recommended by the manufacturer. Chemiluminescence was detected using ECL reagent (Amersham) and quantified in an automated luminescence imaging device (Fusion Solo, Peqlab VWR, Radnor, PA). Optical densities of bands in gels were measured using automated imaging devices and quantified with Image J (imagej.nih.gov/ij). Antibodies are listed in Table S13.
Cultivation of human monocytic leukemia cell lines
THP1 and U937 monocytes (Mo/s) were suspended in complete RPMI1640 medium and distributed to six-well plates at a density of 5 × 10⁵ cells/ml. Phorbol 12-myristate 13-acetate (PMA) was added for 48 h (8 nM) to induce differentiation.Citation6,Citation24 Adherent M0 macrophages were washed once with PBS and incubated for additional 48 h at 37°C, 5% CO2 in complete RPMI1640 medium supplemented with cytokines (all from Peprotech, Hamburg, Germany) inducing polarization to M1 (10 pg/ml LPS, 20 ng/ml IFNγ) or M2 (20 ng/ml IL4, 20 ng/ml IL13) phenotypes.
Macrophage co-cultures with gastric cancer cells
For indirect co-culture (transCC), THP1 macrophages (M0, M1 or M2) were seeded into 0.4 micron trans-well inserts (Greiner, Frickenhausen, Germany) in 24-well plates.Citation25 AGS cells were seeded into 24-well plates 2 days prior to completion of macrophages’ differentiation or polarization, in order to achieve an ~1:1 ratio at the start of the co-culture. Cells were washed once with PBS, macrophage-loaded inserts were placed into wells containing AGS cells, and the co-culture was maintained in 50% (v/v) complete RPMI1640 medium plus 50% (v/v) complete DMEM. For control, single cultures (SC) were kept in mixed media. Cells were then treated with or without 10 µM rosiglitazone (rosi) for additional 48 h at 37°C, 5% CO2. Cell types were collected separately for RNA or protein extraction. For contact-dependent co-culture (cisCC), AGS cells were labeled (marked by asterisk *) with Qtracker® 655 nm dye as detailed by the manufacturer (Cell Labeling Kit, Q25021MP, Thermofisher Scientific). Subconfluent monolayers of THP1 macrophages (M0 or M1) were prepared in six-well plates 2–4 days before the experiment. Macrophages were then overlaid with ~ 1:1 ratio of AGS* cells and incubated for additional 2 days in mixed media in absence or presence of rosi (10 µM) at 37°C, 5% CO2. Macrophages were counted by autofluorescence (488 nm), surviving cancer cells in the red channel (655 nm). In addition, cell death was determined by annexin (apoptosis) and propidiumiodide (necrosis) following the manufacturer’s procedure (Annexin-V-FLUOS Kit, Roche Diagnostics GmbH). Images were acquired at an original magnification of 100-200x using a digital camera-connected (Leica LAS, version 4.4) fluorescence microscope (Leica DM IRB). Finally, co-cultures were harvested as mixed samples for RNA or protein extraction without further separation.
Cell viability assay
For “cross”-cultures (crossCC), subconfluent monolayers of THP1 M0 macrophages were cultivated in complete RPMI1640 medium for additional 48 h before collection of conditioned medium (CM). Serial dilutions thereof using a mixture of fresh 50% (v/v) complete RPMI1640 medium and 50% (v/v) complete DMEM were transferred onto AGS or MKN45 cells which had been grown to subconfluency in 96-well plates 2 days before the start of the medium transfer. Colorimetric MTT assay was performed after additional 48 h at 37°C, 5% CO2 according to the manufacturer’s recommendations (Roche). Optical densities were measured by microplate reader (Infinite 200, Tecan, Männedorf, Switzerland).
Flow cytometry
Live cells were washed in PBS, and 1 × 10⁵ cells were resuspended in 90 µl staining buffer [5% (w/v) bovine serum albumin in PBS], 10 µl of human Fc Receptor Block (Miltenyi, Bergisch Gladbach, Germany) was added, and cells were incubated for 10 min at 4°C. Following centrifugation at 2000 rpm for 5 min at 4°C, pellets were resuspended in 100 µl of fluorescence-labeled TLR4-PE or isotypic control antibody (Table S13) diluted in staining buffer, and cells were incubated in the dark for 30 min at 4°C. Cells were washed twice in staining buffer, then resuspended in 200 µl of staining buffer. Five µl of viability dye [7-aminoactinomycin D (7AAD), eBiosciences/Thermofisher Scientific] was added 15 min before samples were detected in a FACSCantoII device. Analysis was performed using FACSDiva (version 8.0.1, BD Biosciences, San Jose, CA) software. Alternatively, cells were fixed with 4% (v/v) formaldehyde for 10 min and permeabilized with 1% (w/v) saponin in PBS, and subjected to staining procedure as above.
Isolation of primary human monocytes
Peripheral blood mononuclear cells (PBMCs) were isolated by Ficoll® Paque Plus (GE Healthcare, Chicago, IL) centrifugation from healthy male donors (DRK, Blood Donation Center, Mannheim) following standard procedures of the manufacturer. Mononuclear cells were resuspended in complete RPMI1640 medium supplemented with 1% (v/v) GlutaMAX and 1% (v/v) HEPES (pH 7.2–7.5) (all from Thermofisher Scientific), seeded into six-well plates at a density of ≤1x10⁷ per well and incubated at 37°C, 5% CO2 for 24 h to allow monocytes to adhere. Thereafter, non-adherent suspension cells (containing lymphocytes) were harvested, adherent cells washed with PBS, and monocytes were maintained for additional 48 h in presence of 10 ng/ml M-CSF (Preprotech)Citation24 with and without M1 cytokines as described for THP1 cells.
Statistics and software
Data are displayed as means ± S.E. from at least three independent experiments from different cell passages or patients. Data were normalized to housekeeping genes or proteins as indicated in the legends to figures and calculated as -fold or % compared to control. Statistical analysis was done with Prism (Graphpad Software, La Jolla, CA) and SPSS (IBM, New York, NY). All tests were unpaired and two-sided if not stated otherwise. P-values <0.05 were considered significant (*). Bioinformatic data were retrieved from Oncomine®Citation69 and cbioportal.orgCitation17 in accordance with the TCGA publication guidelines. Receiver operating characteristic analysis was performed to optimize the percent methylation ratio cut-off value which yields the best discrimination between non-neoplastic and tumor samples.
Abbreviations
Author contributions
All authors cooperated and contributed to, critically reviewed and approved the manuscript. EB, JY, JS and ME defined the research theme. BLi, CA, EB, JZ, PW, QL, SA, TGu, TLi, TLe, YD, YZ designed methods, carried out experiments, analyzed data and interpreted results. CR provided and conducted immunostainings. EB and HMB performed bioinformatic analyses. EB wrote the paper.
Disclosures
No potential conflicts of interest were disclosed.
Supplemental Material
Download PDF (2.8 MB)Acknowledgments
We thank Frank Herweck, Alexandra Kerner and Kauthar Srour for excellent technical assistance.
Supplementary material
Supplemental data for this article can be accessed on the publisher’s website.
Additional information
Funding
Related Research Data
References
- Ferlay J, Soerjomataram I, Ervik M, Dikshit R, Eser S, Mathers C, Rebelo M, Parkin DM, Forman D, Bray F. GLOBOCAN 2012 v1.0, cancer incidence and mortality worldwide: IARC CANCERBASE No. 11 [Internet]. Lyon (France): International Agency for Research on Cancer; 2013. http://globocan.iarc.fr.
- Lordick F, Janjigian YY. Clinical impact of tumour biology in the management of gastroesophageal cancer. Nat Rev Clin Oncol. 2016;13:1–18. doi:10.1038/nrclinonc.2016.15.
- Shaib WL, Nammour JP, Gill H, Mody M, Saba NF. The future prospects of immune therapy in gastric and esophageal Adenocarcinoma. J Clin Med. 2016;5. doi:10.3390/jcm5110100.
- Cancer Genome Atlas Research, N. Comprehensive molecular characterization of gastric adenocarcinoma. Nature. 2014;513:202–209. doi:10.1038/nature13480.
- Cassetta L, Pollard JW. Targeting macrophages: therapeutic approaches in cancer. Nat Rev Drug Discov. 2018;17:887–904. doi:10.1038/nrd.2018.169.
- Murray PJ, Allen JE, Biswas SK, Fisher EA, Gilroy DW, Goerdt S, Gordon S, Hamilton JA, Ivashkiv LB, Lawrence T, et al. Macrophage activation and polarization: nomenclature and experimental guidelines. Immunity. 2014;41:14–20. doi:10.1016/j.immuni.2014.06.008.
- Yuan G, Regel I, Lian F, Friedrich T, Hitkova I, Hofheinz RD, Ströbel P, Langer R, Keller G, Röcken C, et al. WNT6 is a novel target gene of caveolin-1 promoting chemoresistance to epirubicin in human gastric cancer cells. Oncogene. 2013;32:375–387. doi:10.1038/onc.2012.40.
- Burgermeister E, Friedrich T, Hitkova I, Regel I, Einwächter H, Zimmermann W, Röcken C, Perren A, Wright MB, Schmid RM, et al. The Ras inhibitors caveolin-1 and docking protein 1 activate peroxisome proliferator-activated receptor gamma through spatial relocalization at helix 7 of its ligand-binding domain. Mol Cell Biol. 2011;31:3497–3510. doi:10.1128/MCB.01421-10.
- Mashima R, Hishida Y, Tezuka T, Yamanashi Y. The roles of Dok family adapters in immunoreceptor signaling. Immunol Rev. 2009;232:273–285. doi:10.1111/j.1600-065X.2009.00844.x.
- Friedrich T, Söhn M, Gutting T, Janssen K-P, Behrens H-M, Röcken C, Ebert MPA, Burgermeister E. Subcellular compartmentalization of docking protein-1 contributes to progression in colorectal cancer. EBioMedicine. 2016;8:159–172. doi:10.1016/j.ebiom.2016.05.003.
- Sylla BS, Murphy K, Cahir-McFarland E, Lane WS, Mosialos G, Kieff E. The X-linked lymphoproliferative syndrome gene product SH2D1A associates with p62dok (Dok1) and activates NF-kappa B. Proc Natl Acad Sci U S A. 2000;97:7470–7475. doi:10.1073/pnas.130193097.
- Hosooka T, Noguchi T, Kotani K, Nakamura T, Sakaue H, Inoue H, Ogawa W, Tobimatsu K, Takazawa K, Sakai M, et al. Dok1 mediates high-fat diet-induced adipocyte hypertrophy and obesity through modulation of PPAR-gamma phosphorylation. Nat Med. 2008;14:188–193. doi:10.1038/nm1706.
- Balassiano K, Lima S, Jenab M, Overvad K, Tjonneland A, Boutron-Ruault MC, Clavel-Chapelon F, Canzian F, Kaaks R, Boeing H, et al. Aberrant DNA methylation of cancer-associated genes in gastric cancer in the European prospective investigation into cancer and nutrition (EPIC-EURGAST). Cancer Lett. 2011;311:85–95. doi:10.1016/j.canlet.2011.06.038.
- Mashima R, Honda K, Yang Y, Morita Y, Inoue A, Arimura S, Nishina H, Ema H, Nakauchi H, Seed B, et al. Mice lacking Dok-1, Dok-2, and Dok-3 succumb to aggressive histiocytic sarcoma. Lab Invest. 2010;90:1357–1364. doi:10.1038/labinvest.2010.121.
- Lamkin TJ, Chin V, Yen A. All-trans retinoic acid induces p62DOK1 and p56DOK2 expression which enhances induced differentiation and G0 arrest of HL-60 leukemia cells. Am J Hematol. 2006;81:603–615. doi:10.1002/ajh.20667.
- Hiragun T, Peng Z, Beaven MA. Dexamethasone up-regulates the inhibitory adaptor protein Dok-1 and suppresses downstream activation of the mitogen-activated protein kinase pathway in antigen-stimulated RBL-2H3 mast cells. Mol Pharmacol. 2005;67:598–603. doi:10.1124/mol.104.008607.
- Cerami E, Gao J, Dogrusoz U, Gross BE, Sumer SO, Aksoy BA, Jacobsen A, Byrne CJ, Heuer ML, Larsson E, et al. The cBio cancer genomics portal: an open platform for exploring multidimensional cancer genomics data. Cancer Discov. 2012;2:401–404. doi:10.1158/2159-8290.CD-12-0095.
- Schlemper RJ, Riddell RH, Kato Y, Borchard F, Cooper HS, Dawsey SM, Dixon MF, Fenoglio-Preiser CM, Fléjou JF, Geboes K, et al. The Vienna classification of gastrointestinal epithelial neoplasia. Gut. 2000;47:251–255. doi:10.1136/gut.47.2.251.
- Siouda M, Frecha C, Accardi R, Yue J, Cuenin C, Gruffat H, Manet E, Herceg Z, Sylla BS, Tommasino M, et al. Epstein-Barr virus down-regulates tumor suppressor DOK1 expression. PLoS Pathog. 2014;10:e1004125. doi:10.1371/journal.ppat.1004125.
- Forbes SA, Beare D, Bindal N, Bamford S, Ward S, Cole CG, Jia M, Kok C, Boutselakis H, De T, et al. COSMIC: high-resolution cancer genetics using the catalogue of somatic mutations in cancer. Curr Protoc Hum Genet. 2016;91:10 11 11–10 11 37. doi:10.1002/cphg.21.
- Fels Elliott DR, Perner J, Li X, Symmons MF, Verstak B, Eldridge M, Bower L, O’Donovan M, Gay NJ, Fitzgerald RC, et al. Impact of mutations in Toll-like receptor pathway genes on esophageal carcinogenesis. PLoS Genet. 2017;13:e1006808. doi:10.1371/journal.pgen.1006808.
- Chistiakov DA, Killingsworth MC, Myasoedova VA, Orekhov AN, Bobryshev YV. CD68/macrosialin: not just a histochemical marker. Lab Invest. 2017;97:4–13. doi:10.1038/labinvest.2016.116.
- Vannini F, Kashfi K, Nath N. The dual role of iNOS in cancer. Redox Biol. 2015;6:334–343. doi:10.1016/j.redox.2015.08.009.
- Spiller KL, Wrona EA, Romero-Torres S, Pallotta I, Graney PL, Witherel CE, Panicker LM, Feldman RA, Urbanska AM, Santambrogio L, et al. Differential gene expression in human, murine, and cell line-derived macrophages upon polarization. Exp Cell Res. 2016;347:1–13. doi:10.1016/j.yexcr.2015.10.017.
- Gutting T, Weber CA, Weidner P, et al. PPARgamma-activation increases intestinal M1 macrophages and mitigates formation of serrated adenomas in mutant KRAS mice. Oncoimmunology. 2018;7:e1423168. doi:10.1080/2162402X.2018.1490854.
- Castano-Rodriguez N, Kaakoush NO, Mitchell HM. Pattern-recognition receptors and gastric cancer. Front Immunol. 2014;5:336. doi: 10.3389/fimmu.2014.00336.
- Garcia-Diaz A, Shin DS, Moreno BH, Saco J, Escuin-Ordinas H, Rodriguez GA, Zaretsky JM, Sun L, Hugo W, Wang X, et al. Interferon receptor signaling pathways regulating PD-L1 and PD-L2 expression. Cell Rep. 2017;19:1189–1201. doi:10.1016/j.celrep.2017.04.031.
- An LL, Gorman JV, Stephens G, Swerdlow B, Warrener P, Bonnell J, Mustelin T, Fung M, Kolbeck R. Complement C5a induces PD-L1 expression and acts in synergy with LPS through Erk1/2 and JNK signaling pathways. Sci Rep. 2016;6:33346. doi:10.1038/srep33346.
- Gordon SR, Maute RL, Dulken BW, Hutter G, George BM, McCracken MN, Gupta R, Tsai JM, Sinha R, Corey D, et al. PD-1 expression by tumour-associated macrophages inhibits phagocytosis and tumour immunity. Nature. 2017;545:495–499. doi:10.1038/nature22396.
- Barretina J, Caponigro G, Stransky N, Venkatesan K, Margolin AA, Kim S, Wilson CJ, Lehár J, Kryukov GV, Sonkin D, et al. The Cancer Cell Line Encyclopedia enables predictive modelling of anticancer drug sensitivity. Nature. 2012;483:603–607. doi:10.1038/nature11003.
- Prost S, Relouzat F, Spentchian M, Ouzegdouh Y, Saliba J, Massonnet G, Beressi J-P, Verhoeyen E, Raggueneau V, Maneglier B, et al. Erosion of the chronic myeloid leukaemia stem cell pool by PPARgamma agonists. Nature. 2015;525:380–383. doi:10.1038/nature15248.
- Guo B, Huang X, Lee MR, Lee SA, Broxmeyer HE. Antagonism of PPAR-gamma signaling expands human hematopoietic stem and progenitor cells by enhancing glycolysis. Nat Med. 2018;24:360–367. doi:10.1038/nm.4477.
- Leong SH, Lwin KM, Lee SS, Ng WH, Ng KM, Tan SY, Ng BL, Carter NP, Tang C, Lian Kon O. Chromosomal breaks at FRA18C: association with reduced DOK6 expression, altered oncogenic signaling and increased gastric cancer survival. NPJ Precis Oncol. 2017;1:9. doi:10.1038/s41698-017-0012-3.
- Miyagaki H, Yamasaki M, Takahashi T, Kurokawa Y, Miyata H, Nakajima K, Takiguchi S, Fujiwara Y, Mori M, Doki Y. DOK2 as a marker of poor prognosis of patients with gastric adenocarcinoma after curative resection. Ann Surg Oncol. 2012;19:1560–1567. doi:10.1245/s10434-011-2157-6.
- Berger AH, Niki M, Morotti A, Taylor BS, Socci ND, Viale A, Brennan C, Szoke J, Motoi N, Rothman PB, et al. Identification of DOK genes as lung tumor suppressors. Nat Genet. 2010;42:216–223. doi:10.1038/ng.527.
- Friedrich T, Richter B, Gaiser T, Weiss C, Janssen K-P, Einwächter H, Schmid RM, Ebert MPA, Burgermeister E. Deficiency of caveolin-1 in Apc(min/+) mice promotes colorectal tumorigenesis. Carcinogenesis. 2013;34:2109–2118. doi:10.1093/carcin/bgt142.
- Lahmidi S, Strunk U, Smiley JR, Pearson A, Duplay P. Herpes simplex virus 1 infection of T cells causes VP11/12-dependent phosphorylation and degradation of the cellular protein Dok-2. Virology. 2017;511:66–73. doi:10.1016/j.virol.2017.08.018.
- Janas JA, Van Aelst L. Oncogenic tyrosine kinases target Dok-1 for ubiquitin-mediated proteasomal degradation to promote cell transformation. Mol Cell Biol. 2011;31:2552–2565. doi:10.1128/MCB.05045-11.
- Zhang QW, Liu L, Gong C-Y, Shi H-S, Zeng Y-H, Wang X-Z, Zhao Y-W, Wei Y-Q, Hoque MO. Prognostic significance of tumor-associated macrophages in solid tumor: a meta-analysis of the literature. PLoS One. 2012;7:e50946. doi:10.1371/journal.pone.0050946.
- Pantano F, Berti P, Guida FM, Perrone G, Vincenzi B, Amato MMC, Righi D, Dell’aquila E, Graziano F, Catalano V, et al. The role of macrophages polarization in predicting prognosis of radically resected gastric cancer patients. J Cell Mol Med. 2013;17:1415–1421. doi:10.1111/jcmm.12109.
- Zhang H, Wang X, Shen Z, Xu J, Qin J, Sun Y. Infiltration of diametrically polarized macrophages predicts overall survival of patients with gastric cancer after surgical resection. Gastric Cancer. 2015;18:740–750. doi:10.1007/s10120-014-0422-7.
- Yamaguchi T, Fushida S, Yamamoto Y, Tsukada T, Kinoshita J, Oyama K, Miyashita T, Tajima H, Ninomiya I, Munesue S, et al. Tumor-associated macrophages of the M2 phenotype contribute to progression in gastric cancer with peritoneal dissemination. Gastric Cancer. 2016;19:1052–1065. doi:10.1007/s10120-015-0579-8.
- Panda A, Mehnert JM, Hirshfield KM, Riedlinger G, Damare S, Saunders T, Kane M, Sokol L, Stein MN, Poplin E, et al. Immune activation and benefit from Avelumab in EBV-positive gastric cancer. J Natl Cancer Inst. 2018;110:316–320. doi:10.1093/jnci/djx213.
- Chang YH, Heo YJ, Cho J, Song SY, Lee J, Kim K-M. Computational measurement of tumor immune microenvironment in gastric adenocarcinomas. Sci Rep. 2018;8:13887. doi:10.1038/s41598-018-32299-0.
- Kim ST, Cristescu R, Bass AJ, Kim K-M, Odegaard JI, Kim K, Liu XQ, Sher X, Jung H, Lee M, et al. Comprehensive molecular characterization of clinical responses to PD-1 inhibition in metastatic gastric cancer. Nat Med. 2018;24:1449–1458. doi:10.1038/s41591-018-0101-z.
- Ayers M,Nebozhyn M, Cristescu R, McClanahan TK, Perini R, Rubin E, Cheng JD, Kaufman DR, Loboda AMolecular Profiling of Cohorts of Tumor Samples to Guide Clinical Development of Pembrolizum. ab as Monotherapy. Clin Cancer Res. 2019;25:1564–1573. doi: 10.1158/1078-0432.CCR-18-1316.
- Waseda M, Arimura S, Shimura E, Nakae S, Yamanashi Y. Loss of Dok-1 and Dok-2 in mice causes severe experimental colitis accompanied by reduced expression of IL-17A and IL-22. Biochem Biophys Res Commun. 2016;478:135–142. doi:10.1016/j.bbrc.2016.07.079.
- Yasuda T, Shirakata M, Iwama A, Ishii A, Ebihara Y, Osawa M, Honda K, Shinohara H, Sudo K, Tsuji K, Nakauchi H. Role of Dok-1 and Dok-2 in myeloid homeostasis and suppression of leukemia. J Exp Med. 2004;200:1681–1687. doi:10.1084/jem.20041247.
- Coppin E, De Grandis M, Pandolfi PP, Arcangeli M-L, Aurrand-Lions M, Nunès JA. Dok1 and Dok2 Proteins regulate cell cycle in hematopoietic stem and progenitor cells. J Immunol. 2016;196:4110–4121. doi:10.4049/jimmunol.1501037.
- Celis-Gutierrez J, Boyron M, Walzer T, Pandolfi PP, Jonjić S, Olive D, Dalod M, Vivier E, Nunès JA. Dok1 and Dok2 proteins regulate natural killer cell development and function. Embo J. 2014;33:1928–1940. doi:10.15252/embj.201387404.
- Besin G, Yousefi M, Saba I, Klinck R, Pandolfi PP, Duplay P. Dok-1 overexpression promotes development of gammadelta natural killer T cells. Eur J Immunol. 2012;42:2491–2504. doi:10.1002/eji.201242421.
- Laroche-Lefebvre C, Yousefi M, Daudelin J-F, Charpentier T, Tarrab E, Klinck R, Lamarre A, Labrecque N, Stäger S, Duplay P. Dok-1 and Dok-2 Regulate the Formation of Memory CD8+ T Cells. J Immunol. 2016;197:3618–3627. doi:10.4049/jimmunol.1600385.
- Lahmidi S, Yousefi M, Dridi S, Duplay P, Pearson A. Dok-1 and Dok-2 are required to maintain herpes simplex virus 1-Specific CD8(+) T cells in a murine model of ocular infection. J Virol. 2017;91. doi:10.1128/JVI.00955-17.
- De Simone M, Spagnuolo L, Lorè NI, Cigana C, De Fino I, Broman KW, Iraqi FA, Bragonzi A. Mapping genetic determinants of host susceptibility to Pseudomonas aeruginosa lung infection in mice. BMC Genomics. 2016;17:351. doi:10.1186/s12864-016-3328-4.
- Cottet S, Corthesy-Theulaz I, Spertini F, Corthesy B. Microaerophilic conditions permit to mimic in vitro events occurring during in vivo Helicobacter pylori infection and to identify Rho/Ras-associated proteins in cellular signaling. J Biol Chem. 2002;277:33978–33986. doi:10.1074/jbc.M201726200.
- Shinohara H, Inoue A, Toyama-Sorimachi N, Nagai Y, Yasuda T, Suzuki H, Horai R, Iwakura Y, Yamamoto T, Karasuyama H, et al. Dok-1 and Dok-2 are negative regulators of lipopolysaccharide-induced signaling. J Exp Med. 2005;201:333–339. doi:10.1084/jem.20041817.
- Kim SS, Lee K-G, Chin C-S, Ng S-K, Pereira NA, Xu S, Lam K-P. DOK3 is required for IFN-beta production by enabling TRAF3/TBK1 complex formation and IRF3 activation. J Immunol. 2014;193:840–848. doi:10.4049/jimmunol.1301601.
- Itoh S, Lemay S, Osawa M, Che W, Duan Y, Tompkins A, Brookes PS, Sheu -S-S, Abe J-I. Mitochondrial Dok-4 recruits Src kinase and regulates NF-kappaB activation in endothelial cells. J Biol Chem. 2005;280:26383–26396. doi:10.1074/jbc.M410262200.
- Hooker E, Baldwin C, Roodman V, Batra A, Isa NN, Takano T, Lemay S. Binding and inhibition of the ternary complex factor Elk-4/Sap1 by the adapter protein Dok-4. Biochem J. 2017;474:1509–1528. doi:10.1042/BCJ20160832.
- Ou X, Xu S, Li YF, Lam KP. Adaptor protein DOK3 promotes plasma cell differentiation by regulating the expression of programmed cell death 1 ligands. Proc Natl Acad Sci U S A. 2014;111:11431–11436. doi:10.1073/pnas.1400539111.
- Niu Y, Roy F, Saltel F, Andrieu-Soler C, Dong W, Chantegrel A-L, Accardi R, Thépot A, Foiselle N, Tommasino M, et al. A nuclear export signal and phosphorylation regulate Dok1 subcellular localization and functions. Mol Cell Biol. 2006;26:4288–4301. doi:10.1128/MCB.01817-05.
- Lloberas J, Celada A. p21(waf1/CIP1), a CDK inhibitor and a negative feedback system that controls macrophage activation. Eur J Immunol. 2009;39:691–694. doi:10.1002/eji.200939262.
- Jiang X, Huang L, Xing D. Photoactivation of Dok1/ERK/PPARgamma signaling axis inhibits excessive lipolysis in insulin-resistant adipocytes. Cell Signal. 2015;27:1265–1275. doi:10.1016/j.cellsig.2015.03.010.
- Demers A, Caron V, Rodrigue-Way A, Wahli W, Ong H, Tremblay A, Cao Y. A concerted kinase interplay identifies PPARgamma as a molecular target of ghrelin signaling in macrophages. PLoS One. 2009;4:e7728. doi:10.1371/journal.pone.0007728.
- Boger C, Behrens HM, Kruger S, Rocken C. The novel negative checkpoint regulator VISTA is expressed in gastric carcinoma and associated with PD-L1/PD-1: A future perspective for a combined gastric cancer therapy? Oncoimmunology. 2017;6:e1293215. doi:10.1080/2162402X.2017.1293215.
- Boger C, Krüger S, Behrens HM, Bock S, Haag J, Kalthoff H, Röcken C. Epstein-Barr virus-associated gastric cancer reveals intratumoral heterogeneity of PIK3CA mutations. Ann Oncol. 2017;28:1005–1014. doi:10.1093/annonc/mdx047.
- Ebert MP, Tänzer M, Balluff B, Burgermeister E, Kretzschmar AK, Hughes DJ, Tetzner R, Lofton-Day C, Rosenberg R, Reinacher-Schick AC, et al. TFAP2E-DKK4 and chemoresistance in colorectal cancer. N Engl J Med. 2012;366:44–53. doi:10.1056/NEJMoa1009473.
- Pfaffl MW. A new mathematical model for relative quantification in real-time RT-PCR. Nucleic Acids Res. 2001;29:e45. doi:10.1093/nar/29.9.e45.
- Rhodes DR, Yu J, Shanker K, Deshpande N, Varambally R, Ghosh D, Barrette T, Pandey A, Chinnaiyan AM. ONCOMINE: a cancer microarray database and integrated data-mining platform. Neoplasia. 2004;6:1–6. doi:10.1016/s1476-5586(04)80047-2.