
 ?Mathematical formulae have been encoded as MathML and are displayed in this HTML version using MathJax in order to improve their display. Uncheck the box to turn MathJax off. This feature requires Javascript. Click on a formula to zoom.
ABSTRACT
Glioblastoma (GBM) is the most aggressive malignant primary brain tumor in adults, with a median survival of 14.6 months. Recent efforts have focused on identifying clinically relevant subgroups to improve our understanding of pathogenetic mechanisms and patient stratification. Concurrently, the role of immune cells in the tumor microenvironment has received increasing attention, especially T cells and tumor-associated macrophages (TAM). The latter are a mixed population of activated brain-resident microglia and infiltrating monocytes/monocyte-derived macrophages, both of which express ionized calcium-binding adapter molecule 1 (IBA1). This study investigated differences in immune cell subpopulations among distinct transcriptional subtypes of GBM. Human GBM samples were molecularly characterized and assigned to Proneural, Mesenchymal or Classical subtypes as defined by NanoString nCounter Technology. Subsequently, we performed and analyzed automated immunohistochemical stainings for TAM as well as specific T cell populations. The Mesenchymal subtype of GBM showed the highest presence of TAM, CD8+, CD3+ and FOXP3+ T cells, as compared to Proneural and Classical subtypes. High expression levels of the TAM-related gene AIF1, which encodes the TAM-specific protein IBA1, correlated with a worse prognosis in Proneural GBM, but conferred a survival benefit in Mesenchymal tumors. We used our data to construct a mathematical model that could reliably identify Mesenchymal GBM with high sensitivity using a combination of the aforementioned cell-specific IHC markers. In conclusion, we demonstrated that molecularly distinct GBM subtypes are characterized by profound differences in the composition of their immune microenvironment, which could potentially help to identify tumors amenable to immunotherapy.
Introduction
Glioblastoma (GBM) is the most common and aggressive malignant primary brain tumor in adults. It is characterized by diffuse infiltration of high-grade glioma cells into the brain parenchyma and resistance to standard of care.Citation1–Citation3 Despite treatment regimens consisting of surgical resection, chemotherapy and radiotherapy, patients have median survival times of only 14.6 to 20.9 months.Citation4,Citation5 Thus, a greater understanding of GBM pathogenesis will provide insight for informed treatment strategies.
Previously, comprehensive analyses of gene expression profiles have identified clinically meaningful subgroups to facilitate the study of this heterogeneous disease.Citation6–Citation9 The Cancer Genome Atlas (TCGA) originally proposed four subtypes, referred to as Proneural (PN), Mesenchymal (MES), Classical (CL), and Neural (NL) .Citation8 However, following robust gene expression classification, only three subtypes, PN, MES, and CL, are currently recognized, each with its own characteristic genomic alterations.Citation10–Citation12 Although multiple subtypes can co-exist within a single tumor, both at the regional and single-cell level,Citation13 the designated subtypes reflect the dominant transcriptional program of a specific tumor.
In parallel with efforts to define GBM genomics, transcriptomics, and cell signaling within the tumor cell population, other investigations have attempted to more fully characterize its diverse cellular composition. GBM is a dynamic ecosystem composed of neoplastic and non-neoplastic cells, which together form the tumor microenvironment and play a significant role in GBM pathogenesis. Citation14,Citation15 Particular emphasis has been placed on immune system constituents, especially tumor-associated macrophages (TAM). This mixed population of activated brain-resident microglia and infiltrating bone marrow-derived macrophages constitutes up to 45% of cells within GBM and has been shown to engage in reciprocal interactions with neoplastic cells to promote tumor growth and progression.Citation16–Citation20 Although these cell types originate from distinct sources – with progenitor cells of microglia migrating into the brain during embryonic brain development, and macrophages derived from peripheral monocytes only infiltrating the brain as a result of tissue injury – they both express ionized calcium-binding adapter molecule 1 (IBA1), a protein involved in membrane ruffling and phagocytosis that is used to visualize both cell types.Citation21–Citation25 With the advent of immunotherapeutic strategies for GBM, T cells have also been subject to increasing scrutiny.Citation26–Citation28 Previous studies have found increased expression of immune response-related genes in MES GBM,Citation8,Citation29,Citation30 yet its biological relevance remains unclear. The main aim of this study is to investigate whether the PN, MES and CL subtypes of GBM differ with respect to the presence of TAM and distinct T cell subpopulations.
Materials and methods
Tissue samples and pathological appraisal
Human formalin-fixed, paraffin-embedded (FFPE) GBM samples, post-mortem brain specimens, and de-identified clinical information were provided by Emory University, Memorial Sloan Kettering Cancer Center, Uppsala University, and the University of Washington Medical Center following ethical approval by institutional review boards. Pathologists graded and diagnosed the tissue based on the 2007 World Health Organization Classification of Tumors of the Central Nervous System.Citation31 The 2016 classification had not yet been published at the time work on this project commenced. Both primary and recurrent tumors were used for this study. All tissue samples were anonymized.
Gene expression profiling using nanostring ncounter technology
The procedure to identify GBM subtype based on gene expression levels has been described elsewhere in detail.Citation32–Citation34 Briefly, RNA was extracted from tumor samples and expression levels were analyzed by NanoString nCounter Technology (NanoString Technologies, Seattle, U.S.A.) using custom-made probes for 152 genes from the original GBM_2 design for the training (32 in total, 27 GBM, and 5 control brains) and test sets (29 GBM in total) (Supplementary Table S1).
Immunohistochemistry (IHC)
FFPE specimens were sectioned at five-micrometers and stained on the DISCOVERY XT platform (Ventana Medical Systems, Inc., Tucson, U.S.A). TAM and microglia were identified using antibodies against IBA1. Antibodies targeting CD3 and CD8 stained the entire T cell population and cytotoxic T cells, respectively. Regulatory T cells were stained by antibodies against forkhead box P3 (FOXP3). Due to the lack of a validated antibody, the CD4+ T cell number was estimated to be the difference between the CD3+ and CD8+ T cell numbers according to published protocol.Citation35 In six cases, the number of CD8+ T cells exceeded or was identical to the number of CD3+ T cells, so that the CD4+ T cell population was considered to be equal to the FOXP3+ T cell number, since the latter constitutes a subpopulation of CD4+ T cells. The following primary antibodies were used: Anti-IBA1 (1:500, rabbit polyclonal, #019–19741, Wako Pure Chemical Ind., Ltd., Osaka, Japan); anti-human FOXP3, clone 259D (1:100, mouse monoclonal, #320202, BioLegend, San Diego, U.S.A); anti-human CD8, clone C8/144B (1:100, mouse monoclonal, code M7103, Dako, Glostrup, Denmark); anti-human CD3 (1:100, rabbit polyclonal, code A0452, Dako, Glostrup, Denmark).
Immunofluorescent staining
Five-micrometer FFPE sections were deparaffinized and rehydrated before antigen retrieval was performed by heating the sections in citrate solution (Vector Shield) at 93°C for 15 min. The sections were then treated with 0.3% Triton in PBS and blocked with 3% normal donkey serum in PBS for 30 min at room temperature. Primary antibodies targeting CD3 (1:100, rabbit polyclonal, code A0452, Dako, Glostrup, Denmark) and CD2 (1:100, mouse monoclonal, code NBP2-32814, Centennial CO, USA) were incubated with the sections for 90 min at room temperature. Secondary antibodies donkey-anti-rabbit-Alexa 488 and donkey-anti-mouse-Alexa 568 (Invitrogen) at a dilution of 1:500 in PBS were applied to the sections for 1h at room temperature. DAPI (Sigma) was used for nuclear counterstaining. Images were acquired on a Leica DM2500 microscope.
Image acquisition
The Nanozoomer 2.0HT (Hamamatsu Photonic K.K., Hamamatsu, Japan) whole slide scanner was utilized to digitalize the stained tissue sections. Image analysis was performed using Fiji.Citation36 Images were captured at 20x magnification, representing an area of 0.3828 mm2 and 0.4263 mm2, depending upon the screen used for quantification. Owing to the high number of TAM in GBM, it was not possible to consistently identify those cells individually. Therefore, for IBA1, the percentage of stained area per field was analyzed, whereas the number of cells per field was quantified for CD3, CD8 and FOXP3. The total amount of representative images obtained from each tissue section analyzed with Fiji was standardized based on overall tumor area, but so far as possible, at least five images were captured. In order to account for heterogeneity within individual samples, every tissue section was subdivided into different regions. Each region was subsequently attributed a percentage of the total number of images per section on the basis of its relative size. Investigators were blinded as to the subtype of the GBM samples during the quantification process. Necrotic and peri-tumor areas were not included. Pixel width of the images was 454 nanometers and final values were standardized to an area of one mm2.
Microglia/macrophage shape analysis
Four tumors with adjacent non-tumor tissue were stained for IBA1+ cells, including microglia in the healthy brain and TAM. Three images were taken in each of the regions of interest, namely the tumor, peri-tumor, and non-tumor areas. The peri-tumor area was defined as a field in which half of the area resembled tumor and the other half resembled non-tumor tissue based on cellular density and composition, as well as macrophage morphology. In each field, the number of primary processes per IBA1+ cell was counted and then averaged as a measure of cell activation. Plot profiles displaying changes in staining intensity in four adjacent fields (one non-tumor, one peri-tumor, and two tumor) were generated for each of the four samples using Fiji. The mean and standard deviation of the relative intensity were plotted with MatLab software (The MathWorks, Inc., Natick, U.S.A).
TCGA analysis
Expression levels and survival data corresponding to the genes of interest were obtained from the cBioPortal for Cancer Genomics (Cancer Study: Glioblastoma Multiforme (TCGA, Provisional), Genomic Profiles: mRNA Expression z-Scores (microarray)) in August of 2016, which provides tools for the analysis and visualization of TCGA datasets.Citation37,Citation38 All primary GBM with complete gene expression and subtype information were analyzed. In total, 357 samples were included, of which 69 were PN, 106 MES, and 101 CL. Of the remaining samples, 55 demonstrated a NL signature and 26 displayed a glioma-CpG island methylator phenotype (G-CIMP). For the subtype-specific analyses, G-CIMP-positive and NL tumors were excluded. The GBM subtype classification was described by Verhaak et al. Citation8
Mathematical prediction model of GBM subtypes
The markers IBA1, CD3, FOXP3 and CD8 were combined to create an empirically-derived, threshold-based GBM subtype prediction model. Given the three-level outcome with three possible GBM subtypes, a multinomial model, which is an extension of a logistic regression model with more than two outcomes, was fit for the training set of 29 samples. A set of two independent binary regressions were fit, using the subtype PN as the reference. Parameter estimates were found by solving for three equations: the two binary regression equations (below) and the equation: P(CL) + P(MES) + P(PN) = 1, where P(CL) is the probability of Classical subtype, P(MES) is the probability of Mesenchymal subtype, and P(PN) is the probability of Proneural subtype. Using a test set of 21 samples and the parameter estimates from the multinomial model, predicted probabilities for each subtype were generated for each sample. The subtype with the highest predicted probability for a given sample was considered as the predicted subtype for that sample. For example, if a sample’s set of predicted probabilities was P(CL) = 0.65, P(MES) = 0.2, P(PN) = 0.15, then that sample was classified as a CL subtype based on the model. The sensitivity and specificity for each subtype, along with 95% confidence intervals, were reported (Supplementary Tables S3, S4). P-values from the multinomial model were also reported.
Equations: Set of binary regression equations estimated from the multinomial model:
Statistical analysis
Graphs were created with GraphPad Prism 6.0b and 7.04 (GraphPad Software Inc., La Jolla, U.S.A). One-way ANOVA and Tukey´s multiple comparisons tests were used to compare more than two groups. Analyses involving low sample numbers were performed using Dunn’s multiple comparisons test and a two-tailed Mann-Whitney U test. Correlations were analyzed with the Pearson correlation coefficient (r). The Log-rank (Mantel-Cox) test and Gehan-Breslow-Wilcoxon test were performed for survival analyses. Significance levels were indicated as follows: ns (not significant); * (P < .05); ** (P < .01); *** (P < .001); **** (P < .0001). Details pertaining to individual graphs are included in the figure legends.
Results
Human gene expression data reveal differential immune profiles among GBM subtypes and indicate distinct effects on survival
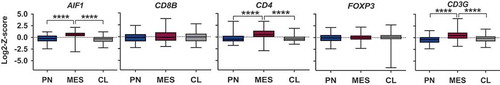
Gene expression data corresponding to the immune cell markers of interest were obtained from TCGA and surveyed for differences among the established GBM subtypes PN, MES and CL (). Genes analyzed were AIF1 (encoding IBA1), CD8B (beta-chain of CD8), CD4 (CD4), FOXP3 (FOXP3), and CD3G (gamma chain of CD3). We identified a significant upregulation of the macrophage marker AIF1, CD3G and CD4 in MES GBM. To further evaluate the correlative biological significance of increased immune cells in MES tumors, levels for each marker were split into groups of high and low expression in order to identify differences in overall survival.
Figure 1. Box plots representing mRNA expression levels of immune-related genes in different GBM subtypes obtained from TCGA. The genes encode the following proteins: IBA1 (AIF1), beta-chain of CD8 (CD8B), CD4 (CD4), FOXP3 (FOXP3), as well as gamma-chain of CD3 (CD3G). MES GBM shows a significant upregulation of TAM, CD3+ and CD4+ T cell markers. Expression levels are depicted as Log2-Z-scores, with Z-scores describing the number of standard deviations that a value differs from the mean of a given population. Sixty-nine PN, 106 MES, and 101 CL samples were included.
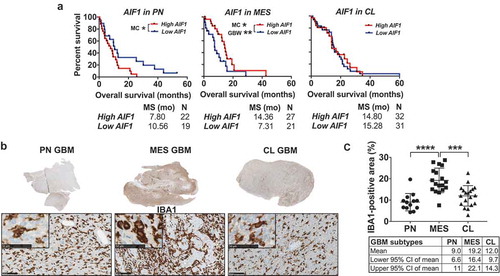
In PN GBM, AIF1 was the only gene to have an impact on survival. High AIF1 levels were associated with a significantly worse prognosis in patients with PN tumors compared to those PN GBM with low expression (median survival high AIF1: 7.80 months, low AIF1: 10.56 months) (Supplementary Fig. S1). Conversely, in MES GBM, high expression of AIF1 conferred a survival benefit, with median survival lengths in the high-AIF1 cohort being almost twice as long (high AIF1: 14.36 months, low AIF1: 7.31 months) ()). In the MES subtype, high expression of the T cell marker CD3G was also prognostically beneficial (median survival high CD3G: 14.36 months, low CD3G: 10.43 months) (Supplementary Fig. S2). No significant survival differences were observed in CL tumors (Supplementary Fig. S3).
Figure 2. MES GBM is characterized by increased presence of TAM compared to the PN and CL subtypes. (a) Kaplan-Meier curves created using data provided by TCGA comparing the effects of different expression levels of AIF1 on overall survival in GBM subtypes. High AIF1 expression levels confer a worse prognosis in the PN subtype, but bestow a survival benefit in MES tumors. No effect is seen in patients with CL GBM. High and low expression levels were defined as the average of all samples in each subtype ± 0.5 standard deviations. MC = Log-rank (Mantel-Cox) test, GBW = Gehan-Breslow-Wilcoxon test. (b) Tumor sections (scale bars represent 5 mm) and representative images of GBM samples demonstrating differential immunohistochemical IBA1 staining among distinct GBM subtypes. IBA1 labels TAM in dark brown and nuclei are counterstained in blue using hematoxylin. Scale bar lengths correspond to 100 micrometers and 50 micrometers (inserted images). (c) Quantification of the percentage of IBA1-positive area in the different GBM subtypes. Each data point represents the average of one tumor. PN = Proneural, MES = Mesenchymal, CL = Classical.
When all GBM, including those classified as NL and G-CIMP-positive, were combined, high expression levels of FOXP3 and CD3G were associated with improved overall survival (Supplementary Fig. S4).
GBM is characterized by an increased presence of immune cells compared to naïve control brains
In order to characterize immune infiltration patterns at the protein level, 56 GBM samples were stained for IBA1, CD8, FOXP3 and CD3. Their averages were compared to those of five control brain samples (Supplementary Fig. S5). Quantification of the IBA1-positive area revealed a significantly increased density of IBA1+ cells in tumor sections compared to naïve brains (mean area of all GBM samples: 13.9%, Controls: 3.9%). Similarly, GBM was characterized by higher numbers of CD8+ (20.3 cells/mm2) and FOXP3+ (3.1 cells/mm2) T cells compared to controls (2.2 and 0.25 cells/mm2). The pan-T cell marker CD3 was also expressed significantly higher in tumor samples (GBM: 44.6 cells/mm2, Controls: 1.3 cells/mm2). The slightly lower number of CD3+ T cells in the naïve brains compared to the CD8+ T cell infiltration can be explained by the extremely low levels T cell infiltrates in healthy brains, which is likely below our methods´ threshold of accurate quantification.
TAM are present at high levels in MES GBM
Using limited group sizes and differing methodologies to determine the tumor subtype, previous studies have proposed that the number of IBA1+ cells is significantly higher in MES tumors compared to the other subtypes. Citation39–Citation41 In order to discriminate between PN, CL, and MES and to increase the sample size per subtype, we subsequently compared the density of TAM among the three subgroups at the protein level by IHC. Using NanoString nCounter Technology, we found that, out of the 56 cases of GBM, 13 were characterized as PN, 18 were assigned to the MES subtype, and 19 showed a CL profile. Six tumors classified as G-CIMP-positive were excluded from this analysis. Quantification in Fiji demonstrated that MES GBM showed significantly higher levels of TAM infiltration compared to PN and CL tumors (), thus corroborating the TCGA expression data. The results for individual GBM samples and clinical information can be found in Supplementary Table S2.
The MES subtype of GBM is characterized by increased T cell levels
A similar infiltration pattern was observed for different T cell populations (; Supplementary Fig. S6). CD3 stains all T cell populations and thus showed the highest numbers of all T cell markers, with the PN and CL subtypes not differing significantly (PN: 20.2 cells/mm2, CL: 39 cells/mm2) and MES tumors showing markedly increased levels compared to both (76.1 cells/mm2), confirming our observations from TCGA.
Figure 3. T cells preferentially infiltrate MES GBM. (a) Representative images depicting infiltrated CD3+, FOXP3+ and CD8+ T cells (arrows) in different GBM subtypes. Scale bars indicate a length of 100 micrometers and 50 micrometers (inserted images). (b) Quantification of the number of CD3+ cells reveals a higher density in MES GBM, with CD3 staining all T cells. (c) Infiltration of CD8+ T cells differs significantly between the PN and MES subtypes. CD8+ T cell numbers were also higher in MES than CL tumors, but not significantly (p = .08). (d, e) Dot plots demonstrating FOXP3+ and CD4+ T cells appear in significantly higher numbers in MES GBM. PN and CL GBM show similar levels of infiltration. The average of each tumor is represented by one data point.
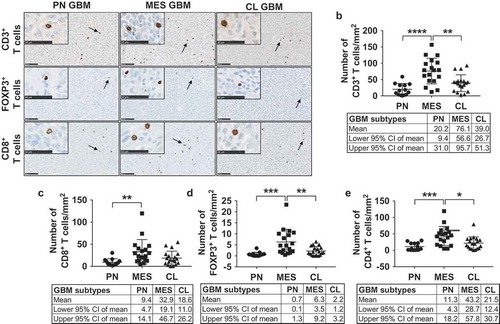
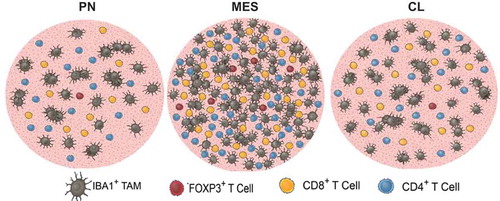
CD4+, CD8+, and FOXP3+ T cells (FOXP3+ cells consist of both CD8+/FOXP3+ and CD4+/FOXP3+) were also found at higher densities in tumors with a MES profile as compared to PN and CL samples. The difference in CD8+ T cell infiltration between MES and CL GBM, however, was not significant (P = .08). CD4+ T cells were the most common (PN: 11.3, MES: 43.2, CL: 21.5 cells/mm2), followed by CD8+ (PN: 9.4, MES: 32.9, CL: 18.6 cells/mm2) and FOXP3+ T cells (PN: 0.7, MES: 6.3, CL: 2.2 cells/mm2). Furthermore, significant positive correlations were found between IBA1+ TAM and all T cell populations (Supplementary Fig. S7). illustrates the differential immune cell infiltration in each of the GBM subtypes.
Figure 4. Graphic illustration depicting the immune cell infiltration in PN, MES, and CL GBM. IBA-positive area and T cell infiltration are markedly increased in MES tumors. Each circle represents an area of one mm2.
Finally, we examined differences in immune cell profiles between the six G-CIMP-positive and all non-G-CIMP tumors. In G-CIMP-positive tumors, we observed a decreased number of CD3+ T cells (G-CIMP: 20.2, non-G-CIMP: 47.5 cells/mm2) and CD4+ T cells (G-CIMP: 9.5, non-G-CIMP: 26.7 cells/mm2). No differences were seen in the infiltration of other cell types (Supplementary Fig. S8).
Specific combinations of IHC markers can be utilized to predict MES GBM
In order to determine the predictive nature of the immune phenotype for each transcriptional subtype, we then investigated the possibility of using a combination of the markers IBA1, CD3, CD8, and FOXP3 to predict the subgroup of our samples. The number of CD4+ cells was estimated by subtracting the number of CD8+ cells from CD3+ cells in accordance with a published protocolCitation35 and was therefore not included. Applying our multinomial model to a training set consisting of 9 PN, 9 CL, and 11 MES samples, we found that 18 of the 29 (62.1%) samples were classified correctly. MES samples were accurately predicted with a sensitivity of 90.9%(Supplementary Table S3). The training set had less success with the PN and CL subtypes (sensitivity of 55.5% and 33.3%, respectively).
The test set was composed of 4 PN, 10 CL, and 7 MES tumors. Of the 21 samples, 13 were classified correctly based on the model (61.9%). The model accurately predicted the majority of PN and MES samples (sensitivity PN: 100%, MES: 71.4%). CL tumors were successfully identified with a sensitivity of only 40% (Supplementary Table S4). All estimated specificity values were adequate. None of the biomarkers alone were significantly associated with subtype (P > .05, Supplementary Table S5). These results highlight the potential of this IHC-based model to predict GBM subtypes, but necessitate additional studies with larger sample sizes.
IBA1+ TAM undergo morphological changes in the peri-tumor area
Given the abundance of TAM in GBM, we further investigated their morphology in relation to naïve microglial shape in the adjacent brain (). Four GBM samples displaying clear core-tumor, peri-tumor, and non-tumor areas were selected. Since five-micrometer sections were analyzed, the following data represent relative values for the purposes of comparing the different regions and underestimate the absolute number of microglial processes, which extend in all three dimensions. For more comprehensive analyses and depictions of microglial processes, we refer to previously published work.Citation42–Citation45
Figure 5. Tumor-associated macrophages (TAM) exhibit distinct morphologies in tumor and non-tumor regions. (a) Image of a GBM section with adjacent brain tissue stained with IBA1. The black rectangles represent images captured to quantify differences in the morphology of TAM in non-tumor (left), peri-tumor (mid), and tumor (right) areas, as well as changes in IBA1-positivity. Peri-tumor areas were defined as a field in which half of the area is non-tumor and the other half is tumor tissue based on macrophage morphology and cellular density. Scale bar corresponds to a length of 10 millimeters. (b) The number of primary processes per IBA1+ cell, a marker for macrophage shape and activation, changes incrementally from non-tumor to tumor areas. The data points represent average numbers of processes per cell in each area of different tumors. (c) Quantification shows the percentage area covered by IBA1+ TAM gradually increases from non-tumor to tumor areas, with each dot representing the average of one sample. Dunn´s multiple comparisons test was performed. (d) Plot profile demonstrating a gradual increase in relative IBA1 immunopositivity with increasing proximity to the tumor parenchyma. The solid dark blue line indicates mean intensity and the shades represent ± one standard deviation (n = 4 independent samples). Examples of TAM highlight their morphological plasticity. The section below the plot profile exemplifies the areas used for this analysis. Staining intensity increases from left (non-tumor) to right (tumor). The scale bar indicates a length of 100 micrometers. (e) Quantification of the percentage of the IBA1-positive area in control brains and non-tumor areas adjacent to GBM indicated no significant difference. Dots represent averages of each sample. Mann-Whitney U test was performed.
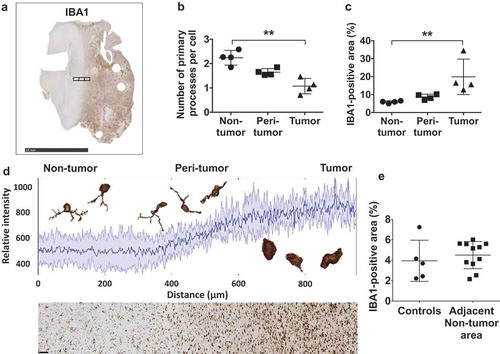
We measured the number of primary processes that extend from TAM, since lower numbers are associated with activation.Citation46 The highest number of processes were noted in adjacent tumor-free brain tissue, with an average of 2.2 primary processes per cell. Lower numbers were seen in the peri-tumor area (1.6 primary processes/cell), while the lowest numbers were noted within tumor tissue, with an average of 1.1 per cell ()). The qualitative perception that the degree of IBA1-positivity gradually increased when going from normal brain to peritumoral brain to brain tumor was confirmed by quantitation of IBA1-positive areas (non-tumor: 5.9%, peri-tumor: 8.7%, tumor: 19.9%) ()). These phenomena, indicating an increased activation and infiltration of TAM in the tumor compared to the adjacent brain, was further visualized by plot profiles of the changing staining intensity in those regions ()).
Finally, the percentage of IBA1-positive area in the adjacent brain tissue of eleven tumor samples was compared to that of the five control brain samples in order to examine possible differences in activation ()). The difference in their means, however, was not significant (naïve control brains: 3.9%, non-tumor tissue of GBM samples: 4.5%).
Discussion
The present study provides evidence of marked differences in the cellular immune profile amongst distinct GBM subtypes. First, we analyzed TCGA gene expression data and found an upregulation of AIF1, CD3G, and CD4, markers of TAM, T-cells, and T-helper cells respectively, in the MES subgroup. Our results reflect those found by Doucette et al., who identified an enrichment of both proinflammatory and immunosuppressive genes in the MES subtype compared to the PN and CL groups by leveraging TCGA data. Citation29 It should be noted that not all chains of CD3 are specific T cell markers, with natural killer (NK) cells, for instance, being able to express some CD3 subunits as well.Citation47
Due to limitations associated with the use of high-throughput sequencing techniques, we complemented our initial findings with an immunohistochemical study of immune cell infiltration, which identified increased levels of TAM and T cells in MES GBM. An investigation of human adult and pediatric astrocytomas by Engler et al. also demonstrated higher numbers of TAM in MES GBM compared to non-MES tumors, albeit using unequal group sizes and without distinguishing among the remaining groups, rendering a definitive assessment difficult.Citation39 In another study of human PN and MES tumors, Beier et al. similarly showed that TAM and CD8+ T cells preferentially infiltrate MES tumors, Citation40 although low sample numbers were used and the subtype was determined based on a combination of immunohistochemical markers, preventing a conclusive judgment to be made. Although the same caveats apply to the findings of Sørensen et al, who also demonstrated higher numbers of TAM in MES GBM, Citation41 our own results combined with the cited studies make a compelling case for a significantly increased presence of TAM infiltration in MES tumors at the protein level. However, using gene expression data, we demonstrated opposite effects of AIF1 in PN and MES GBM, with high expression levels of this marker of TAM leading to a worse prognosis within the former subtype and conferring a survival benefit in the latter, suggesting that high numbers of TAM are not a predictor for patient survival when various subtypes are compared.
With regard to T cell infiltration, the results from previous publications are less conclusive. While Prins et al. demonstrated increased levels of CD3+ and CD8+ cells in MES versus PN tumors in a Phase I trial testing a dendritic cell vaccine, no difference was found in the infiltration of CD4+ and CD8+ cells in a study by Han et al.Citation26,Citation48 Both studies, however, applied different molecular classifications, with the former referring to the subtypes proposed by Phillips et al. and the latter grouping their samples according to the systematization put forth by Verhaak et al.Citation8,Citation9 Leveraging robust group sizes and focusing on the three subgroups for which strong molecular underpinnings exist, the PN, MES and CL subtypes.Citation11 we aimed to add clarity to the question of T cell infiltration and demonstrated increased numbers of different T cell populations in MES GBM. Nonetheless, limitations apply to our indirect quantification of CD4+ T cell-infiltration by subtracting CD8+ from CD3+ T cells, as this reduces accuracy in samples that have very low to nearly zero infiltration of T cells, and because a small number of CD3+ cells lack both CD8 and CD4.Citation49 In a study by Waziri et al. analyzing subsets of CD3+CD56+ infiltrating T cells in GBM, which constituted nearly half of all CD3+ T cells in that sample, CD4/CD8 double-negative T cells only accounted for less than 5% of all CD3+CD56+ cells.Citation50
Despite challenges associated with the use of gene expression profiling studies, the plethora of previous evidence, in addition to our own data, indicate a fundamentally distinct immune profile in MES tumors. These results confirm the findings of Wang et al., who similarly identified an increased immune infiltration in MES GBM in an analysis using CIBERSORT in silico cytometry, which is a computational approach to studying relative cell compositions of tissues.Citation30 They further demonstrated that tumors switching their molecular subtype upon recurrence also change their immune profile accordingly, which indicates the inclusion of recurrent tumors in our study may not constitute a confounding variable.Citation30
Although the role of TAM in glioma pathogenesis is well-established,Citation16,Citation17 the individual effects of the two populations subsumed under this term, microglia- and monocyte-derived macrophages, remain contentious areas of investigation. While some authors have reported microglia constitute the majority of mononuclear cells in GBM,Citation51 our data using transgenic knock-in reporter mice indicate a clear predominance of monocyte-derived macrophages in PN tumors.Citation52 Unpublished findings from our laboratory indicate that microglia are predominant in MES GBM. Although in mouse systems microglia and monocyte-derived macrophages can be distinguished by using cell type-specific reporter mice, this is not possible in human FFPE tumors specimens due to the lack of cell type-specific IHC markers. Although a recent study using GBM single-cell RNA sequencing proposed unique genes to discriminate microglia from macrophages, validation at the protein level was performed only on two tumor samples by FACS. Citation53 An improved understanding of the ratio of these cell types might offer clues regarding their differential interactions with neoplastic cells and help explain the survival differences seen in our TCGA analysis.
The prognostic value of infiltrating T cells in GBM is equally controversial. While some studies indicate high CD3+ and CD8+ T cell numbers are associated with prolonged survival, others, such as Zhai et al. in their analysis of the role of the immunosuppressive enzyme IDO1 in gliomas, found high levels of these subpopulations as well as CD4 + T cells to confer an unfavorable outcome.Citation27,Citation48,Citation54–Citation60 Several investigations have been dedicated to understanding the impact of regulatory T cells on the survival of GBM patients, with the majority not reporting any significant relationship.Citation55,Citation57,Citation58 However, our own finding based on TCGA demonstrating a survival advantage for patients with higher FOXP3 levels, possibly indicating increased Treg cell infiltration, as well as studies implicating high FOXP3+ T cell levels in poorer overall survival, highlight the need for further investigations, especially taking into account the heterogeneity of the Treg cell population.Citation56,Citation59,Citation61 Although controversy exists in the literature regarding FOXP3 being expressed either by macrophages or cancer cells,Citation62 our results, together with published literature, suggest that its expression is largely limited to CD4+ and CD8+ T cells.Citation56,Citation57 In this context, our findings in a small cohort indicating lower CD3+ and CD4+ T cell levels in G-CIMP-positive GBM, which are associated with mutations in isocitrate dehydrogenase 1 (IDH1) and improved survival,Citation63 further demonstrate the complexity of T cell involvement. This last finding echoes results by Amankulor et al., who identified lower levels of macrophages, T and B cells in a small group of IDH1-mutated grade 2 and 3 gliomas, which, the authors speculate, could potentially contribute to the favorable outcome seen in G-CIMP tumors. Citation64
The advent of immune-based therapies for GBM has rendered these questions increasingly pertinent. In their Phase I trial of lysate-pulsed dendritic cells in the treatment of GBM, Prins et al. identified a survival advantage for MES tumors.Citation26 Interestingly, leveraging their high-throughput approach, Wang et al. demonstrated an increased enrichment of genes related to dendritic cells in the CL subtype, indicating these tumors might benefit from the vaccine. Although the trial was not designed to assess efficacy, it provides a rationale for continued investigations into the role of the immune system in the context of molecular and cellular heterogeneity.Citation65 The success of immune checkpoint inhibitors in other cancer types such as melanoma or lung cancer has generated interest in these agents as a possible treatment option for GBM patients.Citation66,Citation67 Expression of Programmed Death-Ligand 1 (PD-L1) has been shown to be increased in tumors with a MES profile.Citation68 Worse outcomes have been observed in a correlative study in tumors with higher PD-L1 expression, however a similar previous investigation had not detected a difference in survival.Citation69,Citation70 Preclinical studies have demonstrated significant survival advantages in mice treated with inhibitors of PD-1 or PD-L1. Citation71,Citation72 Clinical trials, however, have thus far delivered mixed results.Citation73,Citation74 Consequently, additional investigations, which take into account the immune heterogeneity laid out in this study, seem warranted.
All of these findings demonstrate the potential of stratification for GBM patients, creating the necessity to translate the subtypes into clinical applications. Molecular characterization, however, is still costly and dependent upon the existence of appropriate facilities. Therefore, we propose a model based on distinct immune cell infiltration patterns that is able to identify MES tumors with a high sensitivity. However, it should be noted, owing to the relatively small sample size used to establish the model, further validation is required. Since the study used archived clinical FFPE specimens, there is significant potential for developing the model to increase the sensitivity of prediction, with the ultimate goal of creating a prognostic model.
In conclusion, our results lend credence to the notion of utterly distinct microenvironments of molecularly heterogeneous GBM subtypes and form the basis for future mechanistic studies investigating their relevance in the context of novel therapeutic strategies and GBM pathogenesis.
Author contributions
Planning of the study: DH, IK, HK. Method development: IK, ZC. Provision of samples and clinical information and gene expression profiling: FS, CB, JV, JS, JH, BW, SN, KF, LU, NM, EH, DB. Immunohistochemistry staining: FS. TCGA analysis: IK, DH. Image analysis: IK, CH, JR, LM. Statistical analysis: IK, JMS, ZC. Prediction model: JS, IK, DH. Drafting of the manuscript: IK, DH. All authors read, reviewed, and approved the final manuscript.
Conflict of interest
The authors declare that the research was conducted in the absence of any commercial or financial relationships that could be construed as a potential conflict of interest.
Supplemental Material
Download Zip (390.6 KB)Acknowledgments
The authors would like to thank Dr. Suresh Mohla for the inspiration to initiate the project and his active involvement during the entire process. We would also like to thank the Tumor Microenvironment Network at the National Cancer Institute for providing antibodies for this study. Furthermore, the authors extend their thanks to Neil Anthony for his advice on image quantification, Victor Maximov for fruitful discussions, and Kristina Alikhanyan for technical assistance. The graphic illustrations of immune cells were created by Dave Schumick. This research project was supported in part by the Emory University Integrated Cellular Imaging Microscopy Core of the Emory+Children’s Pediatric Research Center. Moreover, research reported in this publication was supported in part by the Biostatistics and Bioinformatics Shared Resource of Winship Cancer Institute of Emory University and NIH/NCI under award number P30CA138292. The content is solely the responsibility of the authors and does not necessarily represent the official views of the National Institutes of Health.
Data availability statement
The raw data supporting the conclusions of this manuscript will be made available by the authors, without undue reservation, to any qualified researcher.
Supplementary material
Supplemental data for this article can be accessed on the publisher’s website.
Additional information
Funding
Related Research Data
References
- Bocangel DB, Finkelstein S, Schold SC, Bhakat KK, Mitra S, Kokkinakis DM. Multifaceted resistance of gliomas to temozolomide. Clin Cancer Res. 2002;8:2725–2734.
- Sahm F, Capper D, Jeibmann A, Habel A, Paulus W, Troost D, von Deimling A. Addressing diffuse glioma as a systemic brain disease with single-cell analysis. Arch Neurol. 2012;69(4):523–526. doi:10.1001/archneurol.2011.2910.
- Shu HK, Kim MM, Chen P, Furman F, Julin CM, Israel MA. The intrinsic radioresistance of glioblastoma-derived cell lines is associated with a failure of p53 to induce p21(BAX) expression. Proc Natl Acad Sci U S A. 1998;95(24):14453–14458. doi:10.1073/pnas.95.24.14453.
- Stupp R, Mason WP, van Den Bent MJ, Weller M, Fisher B, Taphoorn MJB, Belanger K, Brandes AA, Marosi C, Bogdahn U, et al. Radiotherapy plus concomitant and adjuvant temozolomide for glioblastoma. N Engl J Med. 2005;352(10):987–996. doi:10.1056/NEJMoa043330.
- Stupp R, Taillibert S, Kanner A, Read W, Steinberg D, Lhermitte B, Toms S, Idbaih A, Ahluwalia MS, Fink K, et al. Effect of tumor-treating fields plus maintenance temozolomide vs maintenance temozolomide alone on survival in patients with glioblastoma: a randomized clinical trial. Jama. 2017;318(23):2306–2316. doi:10.1001/jama.2017.18718.
- Brennan C, Momota H, Hambardzumyan D, Ozawa T, Tandon A, Pedraza A, Holland E, Creighton C. Glioblastoma subclasses can be defined by activity among signal transduction pathways and associated genomic alterations. PLoS One. 2009;4(11):e7752. doi:10.1371/journal.pone.0007752.
- Mischel PS, Shai R, Shi T, Horvath S, Lu KV, Choe G, Seligson D, Kremen TJ, Palotie A, Liau LM, et al. Identification of molecular subtypes of glioblastoma by gene expression profiling. Oncogene. 2003;22(15):2361–2373. doi:10.1038/sj.onc.1206344.
- Verhaak RGW, Hoadley KA, Purdom E, Wang V, Qi Y, Wilkerson MD, Miller CR, Ding L, Golub T, Mesirov JP, et al. Integrated genomic analysis identifies clinically relevant subtypes of glioblastoma characterized by abnormalities in PDGFRA, IDH1, EGFR, and NF1. Cancer Cell. 2010;17(1):98–110. doi:10.1016/j.ccr.2009.12.020.
- Phillips HS, Kharbanda S, Chen R, Forrest WF, Soriano RH, Wu TD, Misra A, Nigro JM, Colman H, Soroceanu L, et al. Molecular subclasses of high-grade glioma predict prognosis, delineate a pattern of disease progression, and resemble stages in neurogenesis. Cancer Cell. 2006;9(3):157–173. doi:10.1016/j.ccr.2006.02.019.
- Gill BJ, Pisapia DJ, Malone HR, Goldstein H, Lei L, Sonabend A, Yun J, Samanamud J, Sims JS, Banu M, et al. MRI-localized biopsies reveal subtype-specific differences in molecular and cellular composition at the margins of glioblastoma. Proc Natl Acad Sci U S A. 2014;111(34):12550–12555. doi:10.1073/pnas.1405839111.
- Wang Q, Hu B, Hu X, Kim H, Squatrito M, Scarpace L, deCarvalho AC, Lyu S, Li P, Li Y, et al. Tumor evolution of glioma intrinsic gene expression subtype associates with immunological changes in the microenvironment. Cancer Cell. 2017;32(1):42-56.e6. doi: 10.1016/j.ccell.2017.06.003.
- Sturm D, Witt H, Hovestadt V, Khuong-Quang D-A, Jones DTW, Konermann C, Pfaff E, Tönjes M, Sill M, Bender S, et al. Hotspot mutations in H3F3A and IDH1 define distinct epigenetic and biological subgroups of glioblastoma. Cancer Cell. 2012;22(4):425–437. doi:10.1016/j.ccr.2012.08.024.
- Patel AP, Tirosh I, Trombetta JJ, Shalek AK, Gillespie SM, Wakimoto H, Cahill DP, Nahed BV, Curry WT, Martuza RL, et al. Single-cell RNA-seq highlights intratumoral heterogeneity in primary glioblastoma. Science (New York, NY). 2014;344(6190):1396–1401. doi:10.1126/science.1254257.
- Hambardzumyan D, Bergers G. Glioblastoma: defining tumor niches. Trends Cancer. 2015;1(4):252–265. doi:10.1016/j.trecan.2015.10.009.
- Hambardzumyan D, Gutmann DH, Kettenmann H. The role of microglia and macrophages in glioma maintenance and progression. Nat Neurosci. 2016;19(1):20–27. doi:10.1038/nn.4185.
- Feng X, Szulzewsky F, Yerevanian A, Chen Z, Heinzmann D, Rasmussen RD, Alvarez-Garcia V, Kim Y, Wang B, Tamagno I, et al. Loss of CX3CR1 increases accumulation of inflammatory monocytes and promotes gliomagenesis. Oncotarget. 2015;6(17):15077–15094. doi:10.18632/oncotarget.3730.
- Hu F, A Dzaye OD, Hahn A, Yu Y, Scavetta RJ, Dittmar G, Kaczmarek AK, Dunning KR, Ricciardelli C, Rinnenthal JL, et al. Glioma-derived versican promotes tumor expansion via glioma-associated microglial/macrophages Toll-like receptor 2 signaling. Neuro-oncology. 2015;17(2):200–210. doi:10.1093/neuonc/nou324.
- Morantz RA, Wood GW, Foster M, Clark M, Gollahon K. Macrophages in experimental and human brain tumors. Part 2: Studies of the Macrophage Content of Human Brain Tumors. J Neurosurg. 1979;50:305–311.
- Rossi ML, Hughes JT, Esiri MM, Coakham HB, Brownell DB. Immunohistological study of mononuclear cell infiltrate in malignant gliomas. Acta Neuropathol. 1987;74:269–277.
- Chen Z, Hambardzumyan D. Immune microenvironment in glioblastoma subtypes. Front Immunol. 2018;9:1004. doi:10.3389/fimmu.2018.01004.
- Ginhoux F, Greter M, Leboeuf M, Nandi S, See P, Gokhan S, Mehler MF, Conway SJ, Ng LG, Stanley ER, et al. Fate mapping analysis reveals that adult microglia derive from primitive macrophages. Science (New York, NY). 2010;330(6005):841–845. doi:10.1126/science.1194637.
- Shi C, Pamer EG. Monocyte recruitment during infection and inflammation. Nature Rev Immunol. 2011;11(11):762–774. doi:10.1038/nri3070.
- Schluesener HJ, Seid K, Kretzschmar J, Meyermann R. Allograft-inflammatory factor-1 in rat experimental autoimmune encephalomyelitis, neuritis, and uveitis: expression by activated macrophages and microglial cells. Glia. 1998;24:244–251.
- Okano T, Nakagawa T, Kita T, Kada S, Yoshimoto M, Nakahata T, Ito J. Bone marrow-derived cells expressing Iba1 are constitutively present as resident tissue macrophages in the mouse cochlea. J Neurosci Res. 2008;86(8):1758–1767. doi:10.1002/jnr.21625.
- Ohsawa K, Imai Y, Kanazawa H, Sasaki Y, Kohsaka S. Involvement of Iba1 in membrane ruffling and phagocytosis of macrophages/microglia. J Cell Sci. 2000;113:3073–3084.
- Prins RM, Soto H, Konkankit V, Odesa SK, Eskin A, Yong WH, Nelson SF, Liau LM. Gene expression profile correlates with T-cell infiltration and relative survival in glioblastoma patients vaccinated with dendritic cell immunotherapy. Clin Cancer Res. 2011;17(6):1603–1615. doi:10.1158/1078-0432.CCR-10-2563.
- Yang I, Tihan T, Han SJ, Wrensch MR, Wiencke J, Sughrue ME, Parsa AT. CD8+ T-cell infiltrate in newly diagnosed glioblastoma is associated with long-term survival. J Clin Neurosci. 2010;17(11):1381–1385. doi:10.1016/j.jocn.2010.03.031.
- Rutledge WC, Kong J, Gao J, Gutman DA, Cooper LAD, Appin C, Park Y, Scarpace L, Mikkelsen T, Cohen ML, et al. Tumor-infiltrating lymphocytes in glioblastoma are associated with specific genomic alterations and related to transcriptional class. Clin Cancer Res. 2013;19(18):4951–4960. doi:10.1158/1078-0432.CCR-13-0551.
- Doucette T, Rao G, Rao A, Shen L, Aldape K, Wei J, Dziurzynski K, Gilbert M, Heimberger AB. Immune heterogeneity of glioblastoma subtypes: extrapolation from the cancer genome atlas. Cancer Immunol Res. 2013;1(2):112–122. doi:10.1158/2326-6066.CIR-13-0028.
- Wang Q, Hu B, Hu X, Kim H, Squatrito M, Scarpace L, deCarvalho AC, Lyu S, Li P, Li Y, et al. Tumor evolution of glioma-intrinsic gene expression subtypes associates with immunological changes in the microenvironment. Cancer Cell. 2017;32(1):42–56.e6. doi:10.1016/j.ccell.2017.06.003.
- Louis DN, Ohgaki H, Wiestler OD, Cavenee WK, Burger PC, Jouvet A, Scheithauer BW, Kleihues P. The 2007 WHO classification of tumours of the central nervous system. Acta Neuropathol. 2007;114(2):97–109. doi:10.1007/s00401-007-0243-4.
- Kastenhuber ER, Huse JT, Berman SH, Pedraza A, Zhang J, Suehara Y, Viale A, Cavatore M, Heguy A, Szerlip N, et al. Quantitative assessment of intragenic receptor tyrosine kinase deletions in primary glioblastomas: their prevalence and molecular correlates. Acta Neuropathol. 2014;127(5):747–759. doi:10.1007/s00401-013-1217-3.
- Xie Y, Bergström T, Jiang Y, Johansson P, Marinescu VD, Lindberg N, Segerman A, Wicher G, Niklasson M, Baskaran S, et al. The human glioblastoma cell culture resource: validated cell models representing all molecular subtypes. EBioMedicine. 2015;2(10):1351–1363. doi:10.1016/j.ebiom.2015.08.026.
- Omuro A, Beal K, Gutin P, Karimi S, Correa DD, Kaley TJ, DeAngelis LM, Chan TA, Gavrilovic IT, Nolan C, et al. Phase II study of bevacizumab, temozolomide, and hypofractionated stereotactic radiotherapy for newly diagnosed glioblastoma. Clin Cancer Res. 2014;20(19):5023–5031. doi:10.1158/1078-0432.CCR-14-0822.
- Lohr J, Ratliff T, Huppertz A, Ge Y, Dictus C, Ahmadi R, Grau S, Hiraoka N, Eckstein V, Ecker RC, et al. Effector T-cell infiltration positively impacts survival of glioblastoma patients and is impaired by tumor-derived TGF-β. Clin Cancer Res. 2011;17(13):4296–4308. doi:10.1158/1078-0432.CCR-10-2557.
- Schindelin J, Arganda-Carreras I, Frise E, Kaynig V, Longair M, Pietzsch T, Preibisch S, Rueden C, Saalfeld S, Schmid B, et al. Fiji: an open-source platform for biological-image analysis. Nat Methods. 2012;9(7):676–682. doi:10.1038/nmeth.2019.
- Cerami E, Gao J, Dogrusoz U, Gross BE, Sumer SO, Aksoy BA, Jacobsen A, Byrne CJ, Heuer ML, Larsson E, et al. The cBio cancer genomics portal: an open platform for exploring multidimensional cancer genomics data. Cancer Discov. 2012;2(5):401–404. doi:10.1158/2159-8290.CD-12-0095.
- Gao J, Aksoy BA, Dogrusoz U, Dresdner G, Gross B, Sumer SO, Sun Y, Jacobsen A, Sinha R, Larsson E, et al. Integrative analysis of complex cancer genomics and clinical profiles using the cBioPortal. Sci Signal. 2013;6(269):pl1–pl1. doi:10.1126/scisignal.2004088.
- Engler JR, Robinson AE, Smirnov I, Hodgson JG, Berger MS, Gupta N, James CD, Molinaro A, Phillips JJ, Jones C. Increased microglia/macrophage gene expression in a subset of adult and pediatric astrocytomas. PLoS One. 2012;7(8):e43339. doi:10.1371/journal.pone.0043339.
- Beier CP, Kumar P, Meyer K, Leukel P, Bruttel V, Aschenbrenner I, Riemenschneider MJ, Fragoulis A, Rümmele P, Lamszus K, et al. The cancer stem cell subtype determines immune infiltration of glioblastoma. Stem Cells Dev. 2012;21(15):2753–2761. doi:10.1089/scd.2011.0660.
- Sørensen MD, Dahlrot RH, Boldt HB, Hansen S, Kristensen BW. Tumour-associated microglia/macrophages predict poor prognosis in high-grade gliomas and correlate with an aggressive tumour subtype. Neuropathol Appl Neurobiol. 2018;44(2):185–206. doi:10.1111/nan.12428.
- Papageorgiou IE, Fetani AF, Lewen A, Heinemann U, Kann O. Widespread activation of microglial cells in the hippocampus of chronic epileptic rats correlates only partially with neurodegeneration. Brain Struct Funct. 2015;220(4):2423–2439. doi:10.1007/s00429-014-0802-0.
- Sierra A, de Castro F, Del Rio-Hortega J, Rafael Iglesias-Rozas J, Garrosa M, Kettenmann H. The “Big-Bang” for modern glial biology: translation and comments on Pio del Rio-Hortega 1919 series of papers on microglia. Glia. 2016;64(11):1801–1840. doi:10.1002/glia.23046.
- Wogram E, Wendt S, Matyash M, Pivneva T, Draguhn A, Kettenmann H. Satellite microglia show spontaneous electrical activity that is uncorrelated with activity of the attached neuron. Eur J Neurosci. 2016;43(11):1523–1534. doi:10.1111/ejn.13256.
- Chen Z, Ross JL, Hambardzumyan D. Intravital 2-photon imaging reveals distinct morphology and infiltrative properties of glioblastoma-associated macrophages. Proc Natl Acad Sci U S A. 2019. doi:10.1073/pnas.1902366116.
- Kettenmann H, Hanisch UK, Noda M, Verkhratsky A. Physiology of microglia. Physiol Rev. 2011;91(2):461–553. doi:10.1152/physrev.00011.2010.
- Lanier LL, Chang C, Spits H, Phillips JH. Expression of cytoplasmic CD3 epsilon proteins in activated human adult natural killer (NK) cells and CD3 gamma, delta, epsilon complexes in fetal NK cells. Implications for the relationship of NK and T lymphocytes. J Immunol (Baltimore, Md: 1950). 1992;149:1876–1880.
- Han S, Zhang C, Li Q, Dong J, Liu Y, Huang Y, Jiang T, Wu A. Tumour-infiltrating CD4(+) and CD8(+) lymphocytes as predictors of clinical outcome in glioma. Br J Cancer. 2014;110(10):2560–2568. doi:10.1038/bjc.2014.162.
- D’Acquisto F, Crompton T. CD3+CD4-CD8- (double negative) T cells: saviours or villains of the immune response? Biochem Pharmacol. 2011;82(4):333–340. doi:10.1016/j.bcp.2011.05.019.
- Waziri A, Killory B, Ogden AT 3rd, Canoll P, Anderson RCE, Kent SC, Anderson DE, Bruce JN. Preferential in situ CD4+CD56+ T cell activation and expansion within human glioblastoma. J Immunol (Baltimore, Md: 1950). 2008;180(11):7673–7680. doi:10.4049/jimmunol.180.11.7673.
- Muller A, Brandenburg S, Turkowski K, Muller S, Vajkoczy P. Resident microglia, and not peripheral macrophages, are the main source of brain tumor mononuclear cells. Int J Cancer. 2015;137(2):278–288. doi:10.1002/ijc.29379.
- Chen Z, Feng X, Herting CJ, Alvarez Garcia V, Nie K, Pong WW, Rasmussen R, Dwivedi B, Seby S, Wolf SA, et al. Cellular and molecular identity of tumor-associated macrophages in glioblastoma. Cancer Res. 2017;77:2266–2278. doi:10.1158/0008-5472.CAN-16-2310.
- Müller S, Kohanbash G, Liu SJ, Alvarado B, Carrera D, Bhaduri A, Watchmaker PB, Yagnik G, Di Lullo E, Malatesta M, et al. Single-cell profiling of human gliomas reveals macrophage ontogeny as a basis for regional differences in macrophage activation in the tumor microenvironment. Genome Biol. 2017;18(1):234. doi:10.1186/s13059-017-1362-4.
- Kmiecik J, Poli A, Brons NHC, Waha A, Eide GE, Enger PØ, Zimmer J, Chekenya M. Elevated CD3+ and CD8+ tumor-infiltrating immune cells correlate with prolonged survival in glioblastoma patients despite integrated immunosuppressive mechanisms in the tumor microenvironment and at the systemic level. J Neuroimmunol. 2013;264(1–2):71–83. doi:10.1016/j.jneuroim.2013.08.013.
- Thomas AA, Fisher JL, Rahme GJ, Hampton TH, Baron U, Olek S, Schwachula T, Rhodes CH, Gui J, Tafe LJ, et al. Regulatory T cells are not a strong predictor of survival for patients with glioblastoma. Neuro-oncology. 2015;17(6):801–809. doi:10.1093/neuonc/nou363.
- Yue Q, Zhang X, Ye H-X, Wang Y, Du Z-G, Yao Y, Mao Y. The prognostic value of Foxp3+ tumor-infiltrating lymphocytes in patients with glioblastoma. J Neurooncol. 2014;116(2):251–259. doi:10.1007/s11060-013-1314-0.
- Heimberger AB, Abou-Ghazal M, Reina-Ortiz C, Yang DS, Sun W, Qiao W, Hiraoka N, Fuller GN. Incidence and prognostic impact of FoxP3+ regulatory T cells in human gliomas. Clin Cancer Res. 2008;14(16):5166–5172. doi:10.1158/1078-0432.CCR-08-0320.
- Jacobs JFM, Idema AJ, Bol KF, Grotenhuis JA, de Vries IJ, Wesseling P, Adema GJ. Prognostic significance and mechanism of Treg infiltration in human brain tumors. J Neuroimmunol. 2010;225(1–2):195–199. doi:10.1016/j.jneuroim.2010.05.020.
- Miyara M, Yoshioka Y, Kitoh A, Shima T, Wing K, Niwa A, Parizot C, Taflin C, Heike T, Valeyre D, et al. Functional delineation and differentiation dynamics of human CD4+ T cells expressing the FoxP3 transcription factor. Immunity. 2009;30(6):899–911. doi:10.1016/j.immuni.2009.03.019.
- Zhai L, Ladomersky E, Lauing KL, Wu M, Genet M, Gritsina G, Győrffy B, Brastianos PK, Binder DC, Sosman JA, et al. Infiltrating T cells increase IDO1 expression in glioblastoma and contribute to decreased patient survival. Clin Cancer Res. 2017;23(21):6650–6660. doi:10.1158/1078-0432.CCR-17-0120.
- Platten M, Wick W. Tregs in gliomas - the jury is still out. Neuro-oncology. 2015;17(6):769–770. doi:10.1093/neuonc/nov034.
- Vadasz Z, Toubi E. FoxP3 expression in macrophages, cancer, and B cells-is it real? Clin Rev Allergy Immunol. 2017;52(3):364–372. doi:10.1007/s12016-016-8572-5.
- Noushmehr H, Weisenberger DJ, Diefes K, Phillips HS, Pujara K, Berman BP, Pan F, Pelloski CE, Sulman EP, Bhat KP, et al. Identification of a CpG island methylator phenotype that defines a distinct subgroup of glioma. Cancer Cell. 2010;17(5):510–522. doi:10.1016/j.ccr.2010.03.017.
- Amankulor NM, Kim Y, Arora S, Kargl J, Szulzewsky F, Hanke M, Margineantu DH, Rao A, Bolouri H, Delrow J, et al. Mutant IDH1 regulates the tumor-associated immune system in gliomas. Genes Dev. 2017;31(8):774–786. doi:10.1101/gad.294991.116.
- Wang Q, Hu B, Hu X, Kim H, Squatrito M, Scarpace L, deCarvalho AC, Lyu S, Li P, Li Y, et al. Tumor evolution of glioma-intrinsic gene expression subtypes associates with immunological changes in the microenvironment. Cancer Cell. 2018;33(1):152. doi:10.1016/j.ccell.2017.12.012.
- Hodi FS, O’Day SJ, McDermott DF, Weber RW, Sosman JA, Haanen JB, Gonzalez R, Robert C, Schadendorf D, Hassel JC, et al. Improved survival with ipilimumab in patients with metastatic melanoma. N Engl J Med. 2010;363(8):711–723. doi:10.1056/NEJMoa1003466.
- Gandhi L, Rodríguez-Abreu D, Gadgeel S, Esteban E, Felip E, De Angelis F, Domine M, Clingan P, Hochmair MJ, Powell SF, et al. Pembrolizumab plus chemotherapy in metastatic non-small-cell lung cancer. N Engl J Med. 2018;378(22):2078–2092. doi:10.1056/NEJMoa1801005.
- Heiland DH, Haaker G, Delev D, Mercas B, Masalha W, Heynckes S, Gäbelein A, Pfeifer D, Carro MS, Weyerbrock A, et al. Comprehensive analysis of PD-L1 expression in glioblastoma multiforme. Oncotarget. 2017;8(26):42214–42225. doi:10.18632/oncotarget.15031.
- Nduom EK, Wei J, Yaghi NK, Huang N, Kong L-Y, Gabrusiewicz K, Ling X, Zhou S, Ivan C, Chen JQ, et al. PD-L1 expression and prognostic impact in glioblastoma. Neuro-oncology. 2016;18(2):195–205. doi:10.1093/neuonc/nov172.
- Berghoff AS, Kiesel B, Widhalm G, Rajky O, Ricken G, Wöhrer A, Dieckmann K, Filipits M, Brandstetter A, Weller M, et al. Programmed death ligand 1 expression and tumor-infiltrating lymphocytes in glioblastoma. Neuro-oncology. 2015;17(8):1064–1075. doi:10.1093/neuonc/nou307.
- Reardon DA, Gokhale PC, Klein SR, Ligon KL, Rodig SJ, Ramkissoon SH, Jones KL, Conway AS, Liao X, Zhou J, et al. Glioblastoma eradication following immune checkpoint blockade in an orthotopic, immunocompetent model. Cancer Immunol Res. 2016;4(2):124–135. doi:10.1158/2326-6066.CIR-15-0151.
- Zeng J, See AP, Phallen J, Jackson CM, Belcaid Z, Ruzevick J, Durham N, Meyer C, Harris TJ, Albesiano E, et al. Anti-PD-1 blockade and stereotactic radiation produce long-term survival in mice with intracranial gliomas. Int J Radiat Oncol Biol Phys. 2013;86(2):343–349. doi:10.1016/j.ijrobp.2012.12.025.
- Cloughesy TF, Mochizuki AY, Orpilla JR, Hugo W, Lee AH, Davidson TB, Wang AC, Ellingson BM, Rytlewski JA, Sanders CM, et al. Neoadjuvant anti-PD-1 immunotherapy promotes a survival benefit with intratumoral and systemic immune responses in recurrent glioblastoma. Nat Med. 2019;25(3):477–486. doi:10.1038/s41591-018-0337-7.
- Lim M, Xia Y, Bettegowda C, Weller M. Current state of immunotherapy for glioblastoma. Nat Rev Clin Oncol. 2018;15(7):422–442. doi:10.1038/s41571-018-0003-5.