
ABSTRACT
Adrenocortical carcinomas (ACCs) are heterogeneous cancers associated with a very poor prognosis. The improvement of prognostic tools and systemic therapy are urgently needed. Targeting the immune system using checkpoint inhibitors such as PD1/PDL1 inhibitors is an attractive novel therapeutic strategy for poor-prognosis tumors. Multiple clinical trials are ongoing, including in advanced ACC. However, PDL1 expression has been studied in ACC in only one heterogeneous series of 28 clinical samples. Here, we have retrospectively analyzed PDL1 mRNA expression in 146 clinical ACC samples and searched for correlations between expression and biological and clinicopathological data, including post-operative disease-free survival (DFS). PDL1 mRNA expression was heterogeneous across samples. “PDL1-high” tumors were not associated with the classical prognostic variables but were associated with longer DFS in both uni- and multivariate analyses. High PDL1 mRNA expression was associated with biological signs of the cytotoxic local immune response. Supervised analysis between “PDL1-high” and “PDL1-low” tumors identified a robust 370-gene signature whose ontology analysis suggested the existence in “PDL1-high” tumors of a cytotoxic T-cell response, however, associated with some degree of T-cell exhaustion. In conclusion, PDL1 mRNA expression refines the prognostication in ACC and high expression is associated with longer DFS. Clinical validation at the protein level and functional validation are required to fully understand the role of PDL1 in ACC. Reactivation of dormant tumor-infiltrating lymphocytes by PDL1-inhibitors could represent a promising strategy in “PDL1-high” ACCs, supporting the ongoing clinical trials.
Introduction
Adrenocortical carcinomas (ACCs) are rare cancers with 0.5–2 new cases per million diagnosed every year in the United States.Citation1,Citation2 ACC is associated with a very poor prognosis. Complete surgical resection is the only curative therapeutic option but is possible in less than half of patients.Citation3–Citation5 ACC is a heterogeneous disease. Currently, the most validated prognostic factor is initial tumor stage and nodal or distant metastases; other unfavorable factors include increasing age, poorly differentiated or high-grade tumors, and involved surgical margins. But the current prognostic clinicopathological classifications are imperfect and need to be redefined. Despite treatment, nearly 80% of operated patients relapse. The 5-year survival rate is lower than 35% in patients with non-operable tumors. The mitotane adrenolytic drug, a 55-year-old therapy, remains the cornerstone of medical treatment and the currently used cytotoxic chemotherapy agents include old drugs such as etoposide, doxorubicin, cisplatin, and streptozotocin, which display limited efficacy and high toxicity. Clearly, the improvement of prognostic tools and the development of more efficient systemic therapy are crucial.Citation6
Development of ACC is not well characterized at the biological level. Transcriptional profiling identified prognostic classes,Citation7 and expression signatures associated with malignancy,Citation8,Citation9 with hormonal activitiesCitation8 and with survival in adrenocortical tumors.Citation8,Citation10 Integrated genomic characterization recently identified recurrent alterations in known driver genes and in genes not previously reported in ACC, and distinct molecular subtypes with distinct clinical outcome.Citation11,Citation12 If genomic profiling is expected to become clinically relevant in the future, the KI67 proliferation index seems the best prognostic tool currently available.Citation13 Regarding the targeted therapies, no study has demonstrated any benefit with agents blocking molecular pathways such as EGFR, VEGF, mTOR, IGF-1R or FGFR in advanced disease.Citation14–Citation18
The concept that cancer cells can exploit the immune checkpoint pathway to evade the immune system and allow tumor growth has been known for decades.Citation19 Immune response is a complex phenomenon based on a balance between activator and inhibitor pathways that regulate tumor-infiltrating lymphocytes (TILs) activity. One key inhibitor is the PD1/PDL1 pathway. PD1 (Programmed cell Death 1) is expressed at the cell surface of several immune cell populations including T-cells. PD1 is activated by its ligands PDL1 and PDL2, and expressed by antigen-presenting cells but also by tumor cells from different locations. The PD1/PDL1 pathway is a major actor in cancer progression through inhibition of anti-cancer immune response.Citation20–Citation22 Recently, immune checkpoint inhibitors have revolutionized cancer treatment and represent the most successful class of immunotherapies. Remarkably, durable responses have been reported in the clinical trials testing monoclonal antibodies (mAbs) directed against PD1 or PDL1, notably in melanoma, lung, renal cell, head and neck, and bladder carcinomas.Citation23–Citation25 Today, several anti-PD1 and anti-PDL1 mAbs are approved for the treatment of different cancers or are at an advanced stage of clinical development. Furthermore, the relationship between PDL1 expression on tumor and/or immune cells and objective response has been reported.Citation23,Citation24,Citation26,Citation27
Few data are available regarding the clinical activity of anti-PDL1/PD1 mABs in ACC. Preliminary data from two small phase 2 studies have been reported.Citation28,Citation29 Of seven patients who received nivolumab, five had disease progression as best response and two were awaiting evaluation.Citation28 Of 11 patients who received pembrolizumab, two had a partial response, one achieved stable disease, and the 6-month progression-free survival rate was 27%.Citation29 The JAVELIN Solid Tumor trial (NCT01772004) was a phase 1a, multi-cohort, dose-escalation trial assessing avelumab, a mAb directed against PDL1, in patients with metastatic or locally advanced previously treated solid tumors.Citation30 A phase 1b expansion cohort enrolled 50 patients with platinum-pretreated metastatic ACC.Citation31 To our knowledge, this is the largest prospective trial for a checkpoint inhibitor in this disease. The objective response rate (ORR) was 6%, and 21 patients (42%) had the stable disease as a best response (disease control rate: 48%). In evaluable patients with PDL1-positive (N = 12) or PDL1-negative (N = 30) tumors (≥5% tumor cell as IHC cutoff), the ORR was 16.7% versus 3.3% (p = .192) respectively. Possible mechanisms of ACC resistance to PD1/PDL1 inhibitors have been suggested, such as WNT-β-catenin amplification, TP53 mutation, abnormal PD-L1 expression and increased production of steroids.Citation32,Citation33
PDL1 expression has been studied in many cancers, with evidence of correlations with clinicopathological features, including survival, in several studies.Citation34–Citation48 In ACC, only one study analyzed the prevalence and prognostic value of PDL1 expressionCitation49 in a small series of 28 samples and at the protein level using immunohistochemistry (IHC). Here, we have analyzed PDL1 mRNA expression in 146 clinical ACC samples. We searched for correlations between PDL1 mRNA expression and biological and clinicopathological data, including survival.
Results
Patients’ population and PDL1 expression and copy number alteration
PDL1 mRNA expression was analyzed in the 79 TCGA ACC samples, whose clinicopathological characteristics are summarized in . The median patients’ age was 49 (range, 14 to 77) years. There were more females (61%) than males (39%). The most frequent ENSAT stage was stage 2 (48%). Most of the operated tumors were pathologically classified as pT2 (55%), pN0 (88%), and with negative surgical margins (79%). In the Weiss classification, 78% of cases displayed a high score. The majority of tumors (65%) were functional with an excess of steroid hormone secretion. Ninety-one percent of informative patients received adjuvant mitotane therapy and 21% received adjuvant radiotherapy.
Table 1. Clinicopathological characteristics of ACC patients.
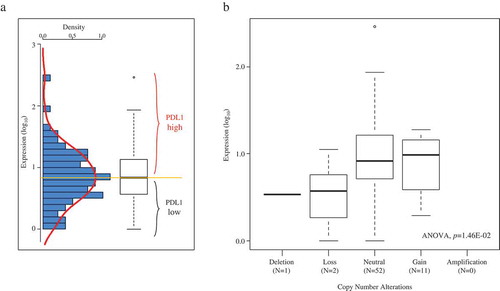
PDL1 mRNA expression level was heterogeneous across all samples with a range of intensities over nearly three decades in a log10 scale (). SNP-array data were available for 76 out of 79 tumors. PDL1 copy number alterations were rare, observed in 24 samples (32%): one tumor displayed deletion (homozygous loss), 12 displayed loss (1 copy), and 11 displayed gain (3 copies). A small positive correlation existed between DNA copy number and mRNA expression level (p = 1.46E-02, ANOVA; ).
Figure 1. PD-L1 mRNA expression across the 79 ACC samples.
A/Left: histogram of distribution of PDL1 mRNA expression levels (log10) across the 79 TCGA samples. The red line represents the density curve of distribution. Right: PDL1 expression level reported as a box plot. The median expression level (orange horizontal line) defines the “PDL1-low” and “PDL1-high” classes. B/Similar to A-Right, but according to PDL1 DNA copy number alteration (SNP-array).
PDL1 expression and clinicopathological features
We searched for correlations between PDL1 mRNA expression assessed as a binary variable (high versus low using the median expression level as cutoff) and clinicopathological features. As shown in , no correlation was found with all tested variables: patients’ age, sex, ENSAT stage, pathological tumor size, pathological lymph node status, surgical margins status, Weiss classification, steroid secretion, adjuvant mitotane therapy, adjuvant radiotherapy, MKI67 mRNA expression, and TP53 mutation status. The “PDL1-high” class tended to be associated with younger patients’ age (p = 6.45E-02, Student t-test), and with higher MKI67 expression (p = 7.29E-02, Fisher’s exact test).
Table 2. Correlations of PDL1 expression with clinicopathological variables.
PDL1 expression and disease-free survival
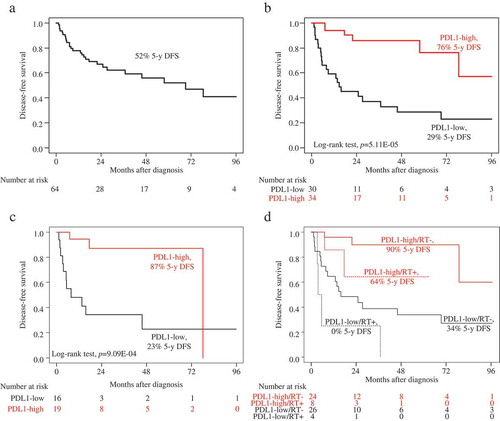
We assessed the prognostic value of PDL1 mRNA expression for post-operative DFS in the 64 patients non-metastatic at diagnosis (M0). Fifty-seven patients remained event-free during a median follow-up of 22 months (range, 1 to 154) and 27 (42%) displayed a DFS event. The 5-year DFS rate was 52% (95%CI, 39–70) (). DFS was correlated with PDL1 expression: in the “PDL1-high” class, the number of patients with DFS event was 6 out of 39 (18%) and the 5-year DFS rate was 76% (95%CI, 58–100); whereas in the “PDL1-low” class, the number of patients with DFS event was 21 out of 40 (70%; p = 3.47E-05, Fisher’s exact test) and the 5-year DFS rate was 29% (95%CI, 16–53; p = 5.11E-05, log-rank test; ).
Figure 2. Disease-free survival according to PDL1 mRNA expression in the M0 patients.
A/Kaplan-Meier DFS curves in the whole population (N = 64). B/Kaplan-Meier DFS curves in the “PDL1-low” and “PDL1-high” classes in the whole population (N = 64). C/Kaplan-Meier DFS curves in the “PDL1-low” and “PDL1-high” classes in the patients treated with adjuvant mitotane (N = 35). D/Kaplan-Meier DFS curves in the “PDL1-low” and “PDL1-high” classes in the patients treated with adjuvant radiotherapy (RT+; dashed curves; N = 12) and in the patients untreated with adjuvant radiotherapy (RT-; solid curves; N = 50).
In univariate analysis (), pathological tumor size, surgical margins, Weiss classification, MKI67 mRNA expression, TP53 mutation status, and PDL1 class were (p < .05) or tended to be (0.05 < p < .10) associated with DFS (Wald test). The hazard ratio (HR) for DFS event was 0.19 (95%CI 0.08–0.46) in the “PDL1-high” class when compared with the “PDL1-low” class (p = 3.00E-04, Wald test). In multivariate analysis incorporating all these variables, two variables remained significantly associated with shorter DFS: higher pathological tumor size, and the “PDL1-low” class, suggesting independent prognostic value. Of note, the same independent prognostic value was observed for PDL1 mRNA expression when analyzed in continuous value (p = 2.99E-03 in univariate analysis, and p = 9.01E-03 in multivariate analysis; Wald test).
Table 3. Univariate and multivariate prognostic analyses for DFS.
Since the adjuvant mitotane and/or radiotherapy can impact on DFS, we reassessed the prognostic value of PDL1 expression according to the delivery or not of adjuvant therapy. Among the 35 patients treated with adjuvant mitotane, the 5-year DFS was 87% (95%CI, 72–100) in the “PDL1-high” class versus 23% (95%CI, 08–66) in the “PDL1-low” class (p = 9.09E-04, log-rank test; ). Among the 50 patients untreated with adjuvant radiotherapy, the 5-year DFS was 90% (95%CI, 77–100) in the “PDL1-high” class versus 34% (95%CI, 19–60) in the “PDL1-low” class (p = 4.54E-04, log-rank test; ). Among the 12 patients treated with adjuvant radiotherapy, the 5-year DFS was 64% (95%CI, 34–100) in the “PDL1-high” class versus 0% (95%CI, NA-NA) in the “PDL1-low” class (p = 1.43E-02, log-rank test; ).
PDL1 expression and immune features
We studied if PDL1 mRNA expression was associated (Student t-test) with immune variables in clinical samples of the whole TCGA data set. As shown in , we found higher expression of the three Palmer’s metagenes representing B-cells, T-cells, and CD8 + T-cellsCitation50 in the “PDL1-high” class. Similarly, the probability of activationCitation51 of the four immune-related pathways, IFNα, IFNγ, STAT3 and TNFα, was higher in the “PDL1-high” class, as was the Rooney’ cytolytic activity score.Citation52 This immune pattern was confirmed and refined using the 24 Bindea signatures for immune cell subsetsCitation53 showing a strong enrichment in the “PDL1-high” class versus “PDL1-low” class for B-cells, T-cells, cytotoxic T-cells, Th1 cells, and CD8 + T-cells, TFH cells and neutrophils. Among T-helper cells, the Th1/Th2 ratio was higher in the “PDL1-high” class. This anti-tumor activation was also correlated to subsets involved in antigen presentation, such as activated dendritic cells (aDC), DC, B-cells, and macrophages, which were higher in the “PDL1-high” class. The “PDL1-high” class was also enriched in samples with ICR4 signature, a reflect of an anti-tumor immune response. Altogether, these results suggested an association of PDL1 mRNA expression with an anti-tumor T-cell response in ACC samples.
Table 4. Correlations of PDL1 expression with immune features.
PDL1 expression and associated biological processes
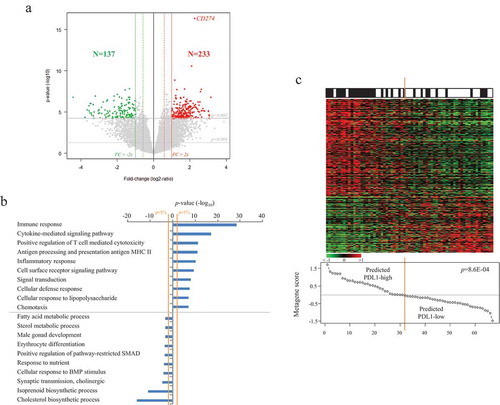
Finally, to further explore the biological pathways associated to PDL1 mRNA expression in ACC, we compared within the whole TCGA data set the expression profiles of all genes between “PDL1-high” tumors and “PDL1-low” tumors. We identified 370 genes differentially expressed, including 233 genes upregulated and 137 genes downregulated in the “PDL1-high” samples (Supplementary Table 1, ). Ontology analysis of these 370 genes (Supplementary Table 2, ) revealed that the “PDL1-high” samples overexpressed genes mainly involved in the regulation of the local immune response. More specifically, we found evidence for macrophages (CD68, CD14) and T-cells (CD2, CD4, CD8B, CD244, CD247, KLRB1, KLRD1, PTPRC) infiltrates. Numerous genes from the PDL1-high signature were related to antigen processing and presentation of peptides via MHC class II (B2M, CIITA, CD74, HLA-DPA1, HLA-DRB1, HLA-DPB1, HLA-DQA1, HLA-DRA, HLA-DMA …). This immune function, responsible for T-cells activation, is performed by antigen-presenting cells only, including macrophages, which were found more abundant in the PDL1-high tumors. Inflammatory response (GBP5, LY96, CYSLTR1, CYSLTR2, CYBB, CSF1, DAGLA, TLR5, CSF1R, P2RX7, CLEC7A, NLRP3, IRF1, INPP5D, TRIM22, TLR4, TLR5), chemokines and cytokines family members involved in immune cells recruitment and activation were also upregulated in the “PDL1-high” samples (CCR5, ITGAL, CX3CR1, CXCR6, CCL8, IL15, IL16, CXCL10, CCR2, CSF1, CCR5, IL2RA, CCL5, CCR1, IL15, XCL1). Some of these chemokines are essential for T-cell homing to the tumor site. In this line, some transcripts upregulated in the “PDL1-high” group suggested local anti-tumor activation of T-cells (ITGAL, IL2RA, IL2RB, IL12RB1, ITK, CRTAM, CD69, PRF1, STAT4, EOMES, GZMA, GZMK, LCK, SYK, …). However, additional candidates indicated an exhausted/anergic status of T-cells (IL10RA, PDCD1LG2, PTPRJ, HLA-E, HAVCR2, TIGIT, EOMES, IKZF1, …). Altogether, this transcriptional profile of the “PDL1-high” group showed an anti-tumor response being under the control of tumor cells at the time of analysis. Many genes overexpressed in the “PDL1-low” class were involved in the steroid and lipid metabolism, the gland development, and differentiation. The robustness of this gene list was confirmed in the independent validation set including 33 “PDL1-high” tumors and 34 “PDL1-low” tumors (p = 31E-03, Fisher’s exact test; ).
Figure 3. Identification and validation of the PDL1 gene expression signature.
A/Identification of the signature in the TCGA data set (N = 79). Volcano-plot showing the 370 genes differentially expressed between the “PDL1-high” versus “PDL1-low” ACC samples. B/Top 20 ontologies associated with the 370 genes differentially expressed based on GO biological processes of the Database for Annotation, Visualization and Integrated Discovery (DAVID). C/Validation of the signature in the pooled Giordano’s and De Reynies’s sets (N = 67). Up, observed PDL1 expression status (black: positive; white: negative); Middle, expression of the 370 differential genes. Each row represents a gene and each column represents a sample. Expression levels are depicted according to the color scale. Genes are ordered from top to bottom by their decreasing t-test statistics, and samples are ordered from left to right according to the decreasing “PDL1 metagene” score (Bottom). The solid orange line indicates the threshold 0 that separates the two predicted classes of samples, “PDL1-high” (at the left of the line) and “PDL1-low” (right to the line). The p-value is for the Student t-test comparing the “PDL1 metagene” score in the two observed PDL1 classes.
Discussion
The need for new therapeutic and/or prognostic targets are crucial in ACC. Blockade of the PD1-PDL1 pathway in tumors is a recent promising therapeutic strategy. To our knowledge, only one study (JAVELIN Solid Tumor trial) with an immune checkpoint inhibitor (avelumab) has included more than 15 patients with advanced ACC treated.Citation29 The ORR was 6% in the whole 50-patient series, higher in the PDL1-positive tumors (16.7%) than in the PDL1-negative tumors (3.3%). Our objective was to document the expression of PDL1 in a large series of ACC clinical samples and to search for correlations with tumor features. We found that PDL1 mRNA expression was heterogeneous and associated with better DFS independently from classical prognostic variables. To our knowledge, with 146 cases analyzed this study is the largest series reported in the literature.
During the last years, PDL1 expression in cancer has been mainly studied at the protein level using IHC. However, divergent results have been reported, notably regarding its prognostic value.Citation54 Such divergence has often been related to the usual limitations of IHC such as the absence of standardization for PDL1, notably in terms of specificity and reproducibility of available antibodies,Citation55,Citation56 the definition of positivity cutoff, and interpretative subjectivity. Our analysis at the mRNA level allowed us to avoid these limitations, to work on a large series of samples, and to search for associations with expression of other genes on a whole-genome scale.
PDL1 mRNA expression was heterogeneous between samples with a relatively wide range of values (~3 decades) and showed a small positive correlation with PDL1 DNA copy number in the TCGA data set. However, DNA copy number alterations were rare (32% of samples), confirming the existence of many other levels of regulation for PDL1 expression in tumors.Citation57 Such heterogeneity allowed the search for correlations between PDL1 mRNA expression and clinically and biologically relevant features. No correlation was found with patients’ age, sex, ENSAT stage, pathological tumor size or lymph node status, surgical margins status, Weiss classification, steroid secretion. There was a trend toward association with a younger patients’ age reported as a good-prognosis featureCitation58 and with higher MKI67 expression known as a poor-prognosis feature.Citation59 To our knowledge, only one study in literature characterized PDL1 expression in ACC and searched for clinicopathological correlations.Citation49 The analysis was limited to a series of 28 samples, including 20 primary tumors and 8 metastases, and was based on IHC and an antibody developed in an academic laboratory. PDL1 staining was assessed on tumor cell membrane with a positivity cutoff equal to 5% of tumor cells (observed in 10.7% of samples) and in tumor-infiltrating mononuclear cells (TIMC) with a positivity cutoff equal to 1% of cells (observed in 70.4% of samples). PDL1 positivity at the cell surface of either tumor cells or TIMC was not associated with stage at diagnosis, tumor grade, excessive hormone secretion, or overall survival. Our results observed in a larger (N = 79) and more homogeneous (only primary tumors) series confirms the absence of association between PDL1 mRNA expression and the classical prognostic variables. However, we show for the first time the prognostic value of PDL1 mRNA expression in ACC. In uni- and multivariate analyses for DFS, high expression was associated with longer DFS, suggesting independent prognostic value, and this result was observed both as discrete value and as a continuous value. Possible explanations for this discordance with the IHC study may be related to the IHC limitations described above, the small size and the heterogeneity of the IHC series, and the non-perfect correlation between mRNA and protein expression.
To date, the prognostic role of immunity in ACC has been little documented. Two studies suggest that the immune response may impact the clinical outcome of patients. Elevated neutrophil-lymphocyte ratio (NLR) and platelet-lymphocyte ratio (PLR) were associated with shorter post-operative relapse-free survival and disease-specific survival in a retrospective series of 84 patients.Citation60 In a comprehensive pan-cancer meta-analysis of mRNA expression in TCGA data,Citation61 the intra-tumoural immune cytolytic activity (CYT), calculated as the geometric mean of GZMA and PRF1 expression levels, was associated with improved overall survival in ACC. In fact, the favorable prognostic value of high PDL1 expression may seem paradoxical given the known immunosuppressive role of PDL1. Similar favorable prognostic value was previously reported in other cancers such as lung cancer,Citation54 breast cancer,Citation47,Citation62 colorectal cancer,Citation41 Merkel cell carcinoma,Citation63 and GIST.Citation44 It is even more puzzling that there was a positive correlation between PDL1 mRNA expression and MKI67 mRNA expression, which makes these tumors more likely to have a worse prognosis. The results of our supervised analysis provide a few elements to help in understanding these paradoxes. The list of genes that were correlated with PDL1 mRNA expression identified a coherent immunological signature. This signature was related to chemo-attractive factors for leukocytes, and macrophages and T-cells infiltrates. Because of the very good antigen presentation capabilities (CMH-II-related molecules were strongly upregulated), the T-cells probably received convincing positive anti-tumor activation signals. In this line, the co-expression of STAT4 and EOMES was indeed reported in effector T-cells.Citation64 Some molecules involved in T-cell cytotoxicity against tumor cells were upregulated (PRF1, GZM …). Considering this, one hypothesis would be that PDL1 expression was the consequence of IFNγ activation as already demonstrated in this context.Citation26,Citation65 The correlation between high PDL1 expression and elevated tumor cell proliferation (Ki67) might be explained by the higher mutation rate of hyperproliferative tumor cells, potentially responsible for higher immunogenicity due to the rapid appearance of neoantigens. Similar positive correlations between PDL1 expression and cell proliferation and longer survival were previously reported in breast cancer,Citation47,Citation62 and GIST.Citation44 However, some very well-known markers of exhaustion (TIGIT, HAVCR2, the simultaneous expression of EOMES and IKAROS …) were also found upregulated in the “PDL1-high” samples, which is certainly the consequence of the tumor overcoming the anti-tumor T-cell response. Altogether, this is laying the ground for the use of immune-checkpoint inhibitors in patients with “PDL1-high” ACC. In those patients, there is a real potential to re-activate the host immune response as reported for melanoma or lung cancers.
In conclusion, we showed that PDL1 mRNA expression is heterogeneous in ACC and represents an independent prognostic feature. Samples with high expression are associated with longer DFS independently from the other prognostic features, suggesting that PDL1 expression cooperates with tumor cell-intrinsic features to influence survival. The strength of our study lies in its originality, the number of samples analyzed (N = 146), important when considering the low incidence of the disease, the homogeneity of the series (primary tumors only), the independent prognostic value of PDL1 mRNA expression as discrete or continuous value, and its biological relevance. Limitations include its retrospective nature and associated biases, such as the absence of information with respect to overall survival, the analysis at the mRNA rather protein level, the use of DNA microarrays and RNA-sequencing that quantify expression levels of both epithelial and stromal cells, and the absence of metastatic samples tested. Even if the biological relevance of our PDL1 signature provides an indirect indication that increased PDL1 mRNA expression in ACC is likely associated with an increase in its activity, and thus its protein expression, it is warranted to validate these preliminary results at the protein level. Analysis of larger patients’ series, retrospective, then prospective, is warranted to confirm our results and to fully understand the role of PDL1 in ACC. If confirmed, PDL1 expression might refine the prediction of postoperative clinical outcome in ACC and improve our ability to better tailor adjuvant therapy. Given the suspected link between PDL1 expression and tumor response to PDL1-inhibitors, our study also suggests that the therapeutic targeting of PDL1 in ACC could enhance the local immune response, thus providing an antitumor effect. Functional and clinical validation of this hypothesis is urgently warranted in front of this devastating disease. Phase 2 clinical trials are ongoing with nivolumab combined with ipilimumab (NCT03333616), and with pembrolizumab (NCT02721732; NCT02673333). In this setting, analysis of metastatic and/or pre-treated samples is warranted to assess PDL1 expression and to test if it can predict the response to immune checkpoint inhibitors.
Materials and methods
Adrenocortical carcinoma samples
We collected clinicopathological and gene expression data of clinical ACC samples from three publicly available data setsCitation7,Citation10,Citation11 comprising at least one probe set representing CD274/PDL1. Data were collected from the National Center for Biotechnology Information (NCBI)/Genbank GEO, and TCGA databases (Supplementary Table 3). All samples were pre-treatment primary tumor samples collected on the surgical resection specimen. The TCGA set included 79 cases profiled using RNA-seq (Illumina) and clinically annotated for many variables including classical prognostic variables, adjuvant treatment, and clinical outcome. The Giordano’s and De Reynies’s sets included 33 and 34 cases, respectively; all were profiled using whole-genome DNA microarrays (Affymetrix U133 Plus 2.0). Only the TCGA set could be used for the prognostic analysis since the other datasetsCitation6–Citation9 were not annotated for both expression, prognostic and survival data.
Gene expression data analysis
Data analysis required pre-analytic processing. The first step was to normalize each data set separately: we used the Robust Multichip Average (RMA)Citation66 with the non-parametric quantile algorithm for the raw data from the Affymetrix data sets. Normalization was done in R using Bioconductor and associated packages. Then, hybridization probes were mapped across the different technological platforms represented. We used NetAffx Annotation files (www.affymetrix.com; release from 01/12/2008) to update the Affymetrix annotations. The probes were then mapped based on their EntrezGeneID. When multiple probes mapped to the same GeneID, we retained the one with the highest variance in a particular dataset. PDL1 (CD274) tumor expression was measured by analyzing different probe sets whose identity and specificity were verified using the NCBI program BLASTN 2.2.31+ (Supplementary Table 3). For the TCGA data, we used the available normalized RNA-seq data that we log2-transformed.
Because of the role of PDL1 in immunity, we also analyzed gene expression signatures related to the immune response in cancers. Each of the following signatures was applied to the TCGA data set: three Palmer’s B-cell, T-cell, and CD8 + T-cell signatures,Citation50 the Rooney’ cytolytic activity score,Citation52 four Gatza’s signatures of IFNα, IFNγ, STAT3, and TNFα biological pathway activity,Citation51 the signatures of 24 different innate and adaptative immune cell subpopulations defined by Bindea et al.,Citation53 and the Immunologic Constant of Rejection (ICR) signature of Th-1 immunity-mediated response.Citation67
Finally, to explore more-in-depth the biological pathways associated to PDL1 mRNA expression in ACC, we applied a supervised analysis to the whole TCGA data set as a learning set (N = 79) and compared the expression profiles of all genes between tumors with low versus high PDL1 mRNA expression using a moderated t-test with the following significance thresholds: p < .001, q < 0.001 and fold change (FC) superior to |2x|. Ontology analysis applied to the resulting gene list was based on GO biological processes of the Database for Annotation, Visualization and Integrated Discovery (DAVID; david.abcc.ncifcrf.gov/). The robustness of this gene list was tested in the 67 pooled Affymetrix-profiled ACC samplesCitation7,Citation10 used as an independent validation set. We computed for each sample a “PDL1 metagene” score as the difference between the mean expression of genes upregulated and the mean expression of genes downregulated in the “PDL1-high” group. The natural score of 0 was used as a threshold to define a sample as “PDL1-up” or “PDL1 no up”. Once defined, we analyzed the concordance of the predicted and observed statutes of all 67 samples using Fisher’s exact test.
Statistical analysis
Correlations between tumor groups and clinicopathological features were analyzed using the t-test or Fisher’s exact test when appropriate. Disease-free survival (DFS) was calculated from the date of diagnosis until the date of distant relapse or death from any cause. Follow-up was measured from the date of diagnosis to the date of last news for event-free patients. Survivals were calculated using Kaplan–Meier method and curves were compared with the log-rank test. Univariate and multivariate survival analyses were done using Cox regression analysis (Wald test). Variables tested in univariate analyses included patients’ age at time of diagnosis, sex, pathological tumor size (pT: pT1 vs pT2, vs pT3, vs pT4), pathological lymph node status (pN: negative vs positive), surgical margins status (R0 vs R1, vs R2), ENSAT stage (1 vs 2–3), Weiss classification (low vs high),Citation68 excess of steroid hormonal secretion (no vs yes), adjuvant mitotane therapy (no vs yes), adjuvant radiotherapy (no vs yes), MKI67 mRNA expression (low vs high), and TP53 mutation status (wild type WT vs mutated). Variables with a p-value <0.10 in univariate analysis were tested in multivariate analysis. All statistical tests were two-sided at the 5% level of significance. Statistical analysis was done using the survival package (version 2.30) in the R software (version 2.15.2; http://www.cran.r-project.org/). We followed the reporting REcommendations for tumor MARKer prognostic studies (REMARK criteria).Citation69
Disclosure of potential conflicts of interest
No potential conflicts of interest were disclosed.
Supplemental Material
Download Zip (83.3 KB)Acknowledgments
Our work is supported by Institut Paoli-Calmettes and Inserm.
Supplementary material
Supplemental data for this article can be accessed on the publisher’s website.
Additional information
Funding
References
- Habra MA, Sukkari MA, Hasan A, Albousen Y, Elsheshtawi MA, Jimenez C, Campbell M, Karam JA, Graham PH, Hatia RI, et al. Epidemiological risk factors for adrenocortical carcinoma: A hospital-based case-control study. Int J Cancer. 2019 Jun 26. doi:10.1002/ijc.32534.
- Fassnacht M, Dekkers O, Else T, Baudin E, Berruti A, de Krijger RR, Haak HR, Mihai R, Assie G, Terzolo M. European society of endocrinology clinical practice guidelines on the management of adrenocortical carcinoma in adults, in collaboration with the European network for the study of adrenal tumors. Eur J Endocrinol. 2018 Jul 24;179:G1–G46. doi:10.1530/EJE-18-0608.
- Long SE, Miller BS. Adrenocortical cancer treatment. Surg Clin North Am. 2019 Aug 1;99(4):759–771. doi:10.1016/j.suc.2019.04.012.
- Jasim S, Habra MA. Management of adrenocortical carcinoma. Curr Oncol Rep. 2019 Feb 23;21(3):20. doi:10.1007/s11912-019-0773-7.
- Puglisi S, Perotti P, Cosentini D, Roca E, Basile V, Berruti A, Terzolo M. Decision-making for adrenocortical carcinoma: surgical, systemic, and endocrine management options. Expert Rev Anticancer Ther. 2018;18(11):1125–1133. doi:10.1080/14737140.2018.1510325.
- Creemers SG, Hofland LJ, Korpershoek E, Franssen GJH, van Kemenade FJ, de Herder WW, van Kemenade FJ. Future directions in the diagnosis and medical treatment of adrenocortical carcinoma. Endocr Relat Cancer. 2016 Jan;23(1):R43–69. doi:10.1530/ERC-15-0452.
- Giordano TJ, Kuick R, Else T, Gauger PG, Vinco M, Bauersfeld J, Sanders D, Thomas DG, Doherty G, Hammer G. Molecular classification and prognostication of adrenocortical tumors by transcriptome profiling. Clin Cancer Res. 2009 Jan 15;15(2):668–676. doi:10.1158/1078-0432.CCR-08-1067
- Laurell C, Velázquez-Fernández D, Lindsten K, Juhlin C, Enberg U, Geli J, Höög A, Kjellman M, Lundeberg J, Hamberger B, et al. Transcriptional profiling enables molecular classification of adrenocortical tumours. Eur J Endocrinol. 2009 Jul;161(1):141–152. doi:10.1530/EJE-09-0068.
- de Fraipont F, El Atifi M, Cherradi N, Le Moigne G, Defaye G, Houlgatte R, Bertherat J, Bertagna X, Plouin PF, Baudin E, et al. Gene expression profiling of human adrenocortical tumors using complementary deoxyribonucleic acid microarrays identifies several candidate genes as markers of malignancy. J Clin Endocrinol Metab. 2005 Mar 1;90(3):1819–1829. doi:10.1210/jc.2004-1075.
- de Reyniès A, Assié G, Rickman DS, Tissier F, Groussin L, René-Corail F, Dousset B, Bertagna X, Clauser E, Bertherat J. Gene expression profiling reveals a new classification of adrenocortical tumors and identifies molecular predictors of malignancy and survival. J Clin Oncol. 2009 Mar;27(7):1108–1115. doi:10.1200/JCO.2008.18.5678.
- Zheng S, Cherniack AD, Dewal N, Moffitt RA, Danilova L, Murray BA, Lerario A, Else T, Knijnenburg T, Ciriello G, et al. Comprehensive pan-genomic characterization of adrenocortical carcinoma. Cancer Cell. 2016 May 9;29(5):723–736. doi:10.1016/j.ccell.2016.04.002.
- Assié G, Letouzé E, Fassnacht M, Jouinot A, Luscap W, Barreau O, Omeiri H, Rodriguez S, Perlemoine K, René-Corail F, et al. Integrated genomic characterization of adrenocortical carcinoma. Nat Genet. 2014 Jun;46(6):607–612. doi:10.1038/ng.2953.
- Kerkhofs TMA, Ettaieb MHT, Hermsen IGC, Haak HR. Developing treatment for adrenocortical carcinoma. Endocr Relat Cancer. 2015 Dec;22(6):R325–338. doi:10.1530/ERC-15-0318.
- De Martino MC, van Koetsveld PM, Feelders RA, Sprij-Mooij D, Waaijers M, Lamberts SWJ, de Herder WW, Colao A, Pivonello R, Hofland LJ. The role of mTOR inhibitors in the inhibition of growth and cortisol secretion in human adrenocortical carcinoma cells. Endocr Relat Cancer. 2012 Jun;19(3):351–364. doi:10.1530/ERC-11-0270.
- Kroiss M, Quinkler M, Johanssen S, van Erp NP, Lankheet N, Pöllinger A, Laubner K, Strasburger CJ, Hahner S, Müller -H-H, et al. Sunitinib in refractory adrenocortical carcinoma: A phase II, single-arm, open-label trial. J Clin Endocrinol Metab. 2012 Oct;97(10):3495–3503. doi:10.1210/jc.2012-1419.
- García-Donas J, Hernando Polo S, Guix M, Climent Duran MA, Méndez-Vidal MJ, Jiménez-Fonseca P, Mateos LL, Rodriguez-Moreno JF, Moreno F, Segura E, et al. Phase II study of dovitinib in first line metastatic or (non resectable primary) adrenocortical carcinoma (ACC): SOGUG study 2011–03. J Clin Oncol. 2014 May 20;32(15_suppl):4588. doi:10.1200/jco.2013.31.15_suppl.4587
- O’Sullivan C, Edgerly M, Velarde M, Wilkerson J, Venkatesan AM, Pittaluga S, Yang SX, Nguyen D, Balasubramaniam S, Fojo T. The VEGF inhibitor axitinib has limited effectiveness as a therapy for adrenocortical cancer. J Clin Endocrinol Metab. 2014 Apr 1;99(4):1291–1297. doi:10.1210/jc.2013-2298.
- Lerario AM, Worden FP, Ramm CA, Hasseltine EA, Stadler WM, Else T, Shah MH, Agamah E, Rao K, Hammer GD. The combination of insulin-like growth factor receptor 1 (IGF1R) antibody cixutumumab and mitotane as a first-line therapy for patients with recurrent/metastatic adrenocortical carcinoma: a multi-institutional NCI-sponsored trial. Horm Cancer. 2014 Aug;5(4):232–239. doi:10.1007/s12672-014-0182-1.
- Alsaab HO, Sau S, Alzhrani R, Tatiparti K, Bhise K, Kashaw SK, Iyer AK. PD-1 and PD-L1 checkpoint signaling inhibition for cancer immunotherapy: mechanism, combinations, and clinical outcome. Front Pharmacol [Internet]. 2017 Aug 23 [[accessed 2019 Apr 25]];8. doi:10.3389/fphar.2017.00561
- Dong H, Strome SE, Salomao DR, Tamura H, Hirano F, Flies DB, Roche PC, Lu J, Zhu G, Tamada K, et al. Tumor-associated B7-H1 promotes T-cell apoptosis: a potential mechanism of immune evasion. Nat Med. 2002 Aug;8(8):793–800. doi:10.1038/nm730.
- Iwai Y, Ishida M, Tanaka Y, Okazaki T, Honjo T, Minato N. Involvement of PD-L1 on tumor cells in the escape from host immune system and tumor immunotherapy by PD-L1 blockade. Proc Natl Acad Sci U S A. 2002 Sep 17;99(19):12293–12297. doi:10.1073/pnas.192461099.
- Reiss KA, Forde PM, Brahmer JR. Harnessing the power of the immune system via blockade of PD-1 and PD-L1: a promising new anticancer strategy. Immunotherapy. 2014;6(4):459–475. doi:10.2217/imt.13.166.
- Brahmer JR, Tykodi SS, Chow LQM, Hwu W-J, Topalian SL, Hwu P, Drake CG, Camacho LH, Kauh J, Odunsi K, et al. Safety and activity of anti-PD-L1 antibody in patients with advanced cancer. N Engl J Med. 2012 Jun 28;366(26):2455–2465. doi:10.1056/NEJMoa1200694
- Topalian SL, Hodi FS, Brahmer JR, Gettinger SN, Smith DC, McDermott DF, Powderly JD, Carvajal RD, Sosman JA, Atkins MB, et al. Safety, activity, and immune correlates of anti-PD-1 antibody in cancer. N Engl J Med. 2012 Jun 28;366(26):2443–2454. doi:10.1056/NEJMoa1200690
- Powles T, Eder JP, Fine GD, Braiteh FS, Loriot Y, Cruz C, Bellmunt J, Burris HA, Petrylak DP, Teng S-L, et al. MPDL3280A (anti-PD-L1) treatment leads to clinical activity in metastatic bladder cancer. Nature. 2014 Nov 27;515(7528):558–562. doi:10.1038/nature13904.
- Taube JM, Klein A, Brahmer JR, Xu H, Pan X, Kim JH, Chen L, Pardoll DM, Topalian SL, Anders RA. Association of PD-1, PD-1 ligands, and other features of the tumor immune microenvironment with response to anti-PD-1 therapy. Clin Cancer Res. 2014 Oct 1;20(19):5064–5074. doi:10.1158/1078-0432.CCR-13-3271
- Tumeh PC, Harview CL, Yearley JH, Shintaku IP, Taylor EJM, Robert L, Chmielowski B, Spasic M, Henry G, Ciobanu V, et al. PD-1 blockade induces responses by inhibiting adaptive immune resistance. Nature. 2014 Nov 27;515(7528):568–571. doi:10.1038/nature13954.
- Cavalcante L, Carneiro BA, Costa RLB, Chae YK, Rademaker A, Giles FJ. Preliminary results from a phase II study of nivolumab for patients with metastatic adrenocortical carcinoma (ACC). J Clin Oncol. 2017 Mar 1;35(7_suppl):96.
- Habra MA, Campbell MT, Jimenez C, Karp D, Hong D, Subbiah V, Pant S, Painter J, Khan S, Bernatchez C, et al. Efficacy of pembrolizumab (MK-3475) in patients withadrenocortical carcinoma. J Immunother Cancer. 2017 Nov;5(Suppl 2), P424.
- Heery CR, O’Sullivan-Coyne G, Madan RA, Cordes L, Rajan A, Rauckhorst M, Lamping E, Oyelakin I, Marté JL, Lepone LM, et al. Avelumab for metastatic or locally advanced previously treated solid tumours (JAVELIN Solid Tumor): a phase 1a, multicohort, dose-escalation trial. Lancet Oncol. 2017;18(5):587–598. doi:10.1016/S1470-2045(17)30239-5
- Le Tourneau C, Hoimes C, Zarwan C, Wong DJ, Bauer S, Claus R, Wermke M, Hariharan S, von Heydebreck A, Kasturi V, et al. Avelumab in patients with previously treated metastatic adrenocortical carcinoma: phase 1b results from the JAVELIN solid tumor trial. J Immunother Cancer. 2018 Dec;6(1):111. doi:10.1186/s40425-018-0424-9.
- Cosentini D, Grisanti S, Dalla Volta A, Laganà M, Fiorentini C, Perotti P, Sigala S, Berruti A. Immunotherapy failure in adrenocortical cancer: where next? Endocr Connect. 2018 Oct 30;7(12):E5–8. doi:10.1530/EC-18-0398.
- Fiorentini C, Grisanti S, Cosentini D, Abate A, Rossini E, Berruti A, Sigala S. Molecular drivers of potential immunotherapy failure in adrenocortical carcinoma. J Oncol. 2019;2019:6072863. doi:10.1155/2019/6072863.
- Nomi T, Sho M, Akahori T, Hamada K, Kubo A, Kanehiro H, Nakamura S, Enomoto K, Yagita H, Azuma M, et al. Clinical significance and therapeutic potential of the programmed death-1 ligand/programmed death-1 pathway in human pancreatic cancer. Clin Cancer Res. 2007 Apr 1;13(7):2151–2157. doi:10.1158/1078-0432.CCR-06-2746.
- Ohigashi Y, Sho M, Yamada Y, Tsurui Y, Hamada K, Ikeda N, Mizuno T, Yoriki R, Kashizuka H, Yane K, et al. Clinical significance of programmed death-1 ligand-1 and programmed death-1 ligand-2 expression in human esophageal cancer. Clin Cancer Res. 2005 Apr 15;11(8):2947–2953. doi:10.1158/1078-0432.CCR-04-1469.
- Strome SE, Dong H, Tamura H, Voss SG, Flies DB, Tamada K, Salomao D, Cheville J, Hirano F, Lin W, et al. B7-H1 blockade augments adoptive T-cell immunotherapy for squamous cell carcinoma. Cancer Res. 2003 Oct 1;63(19):6501–6505.
- Thompson RH, Dong H, Lohse CM, Leibovich BC, Blute ML, Cheville JC, Kwon ED. PD-1 is expressed by tumor-infiltrating immune cells and is associated with poor outcome for patients with renal cell carcinoma. Clin Cancer Res. 2007 Mar 15;13(6):1757–1761. doi:10.1158/1078-0432.CCR-06-2599.
- Thompson RH, Gillett MD, Cheville JC, Lohse CM, Dong H, Webster WS, Krejci KG, Lobo JR, Sengupta S, Chen L, et al. Costimulatory B7-H1 in renal cell carcinoma patients: Indicator of tumor aggressiveness and potential therapeutic target. Proc Natl Acad Sci U S A. 2004 Dec 7;101(49):17174–17179. doi:10.1073/pnas.0406351101.
- Hamanishi J, Mandai M, Iwasaki M, Okazaki T, Tanaka Y, Yamaguchi K, Higuchi T, Yagi H, Takakura K, Minato N, et al. Programmed cell death 1 ligand 1 and tumor-infiltrating CD8+ T lymphocytes are prognostic factors of human ovarian cancer. Proc Natl Acad Sci U S A. 2007 Feb 27;104(9):3360–3365. doi:10.1073/pnas.0611533104.
- Badoual C, Hans S, Merillon N, Van Ryswick C, Ravel P, Benhamouda N, Levionnois E, Nizard M, Si-Mohamed A, Besnier N, et al. PD-1-expressing tumor-infiltrating T cells are a favorable prognostic biomarker in HPV-associated head and neck cancer. Cancer Res. 2013 Jan 1;73(1):128–138. doi:10.1158/0008-5472.CAN-12-2606.
- Droeser RA, Hirt C, Viehl CT, Frey DM, Nebiker C, Huber X, Slobec I, Eppenberger-Castori S, Tzankov A, Rosso R, et al. Clinical impact of programmed cell death ligand 1 expression in colorectal cancer. Eur J Cancer Oxf Engl 1990. 2013 Jun;49(9), 2233–2242. doi:10.1016/j.ejca.2013.02.015
- Spranger S, Spaapen RM, Zha Y, Williams J, Meng Y, Ha TT, Gajewski TF. Up-regulation of PD-L1, IDO, and tregs in the melanoma tumor microenvironment is driven by CD8+ T cells. Sci Transl Med. 2013 Aug 28;5(200):200ra116. doi:10.1126/scitranslmed.3006504.
- Wintterle S, Schreiner B, Mitsdoerffer M, Schneider D, Chen L, Meyermann R, Weller M, Wiendl H. Expression of the B7-related molecule B7-H1 by glioma cells: a potential mechanism of immune paralysis. Cancer Res. 2003 Nov 1;63(21):7462–7467.
- Bertucci F, Finetti P, Mamessier E, Pantaleo MA, Astolfi A, Ostrowski J, Birnbaum D. PDL1 expression is an independent prognostic factor in localized GIST. Oncoimmunology [Internet]. 2015 Feb 3 [accessed 2019 May 12];4(5). doi:10.1080/2162402X.2014.1002729
- Bertucci F, Finetti P, Perrot D, Leroux A, Collin F, Le Cesne A, Coindre J-M, Blay J-Y, Birnbaum D, Mamessier E. PDL1 expression is a poor-prognosis factor in soft-tissue sarcomas. Oncoimmunology. 2017;6(3):e1278100. doi:10.1080/2162402X.2016.1278100.
- Birnbaum DJ, Finetti P, Lopresti A, Gilabert M, Poizat F, Turrini O, Raoul J-L, Delpero J-R, Moutardier V, Birnbaum D, et al. Prognostic value of PDL1 expression in pancreatic cancer. Oncotarget. 2016 01;7(44):71198–71210. doi:10.18632/oncotarget.11685
- Bertucci F, Finetti P, Colpaert C, Mamessier E, Parizel M, Dirix L, Viens P, Birnbaum D, Van Laere S. PDL1 expression in inflammatory breast cancer is frequent and predicts for the pathological response to chemotherapy. Oncotarget. 2015 May 30;6(15):13506–13519. doi:10.18632/oncotarget.3642
- Sabatier R, Finetti P, Mamessier E, Adelaide J, Chaffanet M, Ali HR, Viens P, Caldas C, Birnbaum D, Bertucci F. Prognostic and predictive value of PDL1 expression in breast cancer. Oncotarget. 2015 Mar 10;6(7):5449–5464. doi:10.18632/oncotarget.3216
- Fay AP, Signoretti S, Callea M, Telό GH, McKay RR, Song J, Carvo J, Lampron ME, Kaymakcalan MD, Poli-de-Figueiredo CE, et al. Programmed death ligand-1 expression in adrenocortical carcinoma: an exploratory biomarker study. J Immunother Cancer [Internet]. 2015 Feb 17 [[accessed 2019 Apr 26]];3. doi:10.1186/s40425-015-0047-3
- Palmer C, Diehn M, Alizadeh AA, Brown PO. Cell-type specific gene expression profiles of leukocytes in human peripheral blood. BMC Genomics. 2006 May 16;7(1):115. doi:10.1186/1471-2164-7-115.
- Gatza ML, Lucas JE, Barry WT, Kim JW, Wang Q, Crawford MD, Datto MB, Kelley M, Mathey-Prevot B, Potti A, et al. A pathway-based classification of human breast cancer. Proc Natl Acad Sci U S A. 2010 Apr 13;107(15):6994–6999. doi:10.1073/pnas.0912708107
- Rooney MS, Shukla SA, Wu CJ, Getz G, Hacohen N. Molecular and genetic properties of tumors associated with local immune cytolytic activity. Cell. 2015 Jan 15;160(1–2):48–61. doi:10.1016/j.cell.2014.12.033.
- Bindea G, Mlecnik B, Tosolini M, Kirilovsky A, Waldner M, Obenauf AC, Angell H, Fredriksen T, Lafontaine L, Berger A, et al. Spatiotemporal dynamics of intratumoral immune cells reveal the immune landscape in human cancer. Immunity. 2013 Oct 17;39(4):782–795. doi:10.1016/j.immuni.2013.10.003
- Velcheti V, Schalper KA, Carvajal DE, Anagnostou VK, Syrigos KN, Sznol M, Herbst RS, Gettinger SN, Chen L, Rimm DL. Programmed death ligand-1 expression in non-small cell lung cancer. Lab Investig J Tech Methods Pathol. 2014 Jan;94(1):107–116. doi:10.1038/labinvest.2013.130.
- Gadiot J, Hooijkaas AI, Kaiser ADM, van Tinteren H, van Boven H, Blank C. Overall survival and PD-L1 expression in metastasized malignant melanoma. Cancer. 2011 May 15;117(10):2192–2201. doi:10.1002/cncr.25747.
- Rimm D, Schalper K, Pusztai L. Unvalidated antibodies and misleading results. Breast Cancer Res Treat. 2014 Sep;147(2):457–458. doi:10.1007/s10549-014-3061-0.
- Mamessier E, Birnbaum DJ, Finetti P, Birnbaum D, Bertucci F. CMTM6 stabilizes PD-L1 expression and refines its prognostic value in tumors. Ann Transl Med [Internet]. 2018 Feb [accessed 2019 May 30];6(3). doi:10.21037/atm.2017.11.26
- Li Y, Bian X, Ouyang J, Wei S, He M, Luo Z. Nomograms to predict overall survival and cancer-specific survival in patients with adrenocortical carcinoma. Cancer Manag Res. 2018;10:6949–6959. doi:10.2147/CMAR.S187169.
- Morimoto R, Satoh F, Murakami O, Suzuki T, Abe T, Tanemoto M, ABE M, URUNO A, ISHIDOYA S, ARAI Y, et al. Immunohistochemistry of a proliferation marker Ki67/MIB1 in adrenocortical carcinomas: Ki67/MIB1 labeling index is a predictor for recurrence of adrenocortical carcinomas. Endocr J. 2008;55(1):49–55. doi:10.1507/endocrj.K07-079.
- Bagante F, Tran TB, Postlewait LM, Maithel SK, Wang TS, Evans DB, Hatzaras I, Shenoy R, Phay JE, Keplinger K, et al. Neutrophil-lymphocyte and platelet-lymphocyte ratio as predictors of disease specific survival after resection of adrenocortical carcinoma. J Surg Oncol. 2015 Aug;112(2):164–172. doi:10.1002/jso.23982.
- Roufas C, Chasiotis D, Makris A, Efstathiades C, Dimopoulos C, Zaravinos A. The expression and prognostic impact of immune cytolytic activity-related markers in human malignancies: a comprehensive meta-analysis. Front Oncol. 2018;8:27. doi:10.3389/fonc.2018.00027.
- Schalper KA, Velcheti V, Carvajal D, Wimberly H, Brown J, Pusztai L, Rimm DL. In situ tumor PD-L1 mRNA expression is associated with increased TILs and better outcome in breast carcinomas. Clin Cancer Res. 2014 May 15;20(10):2773–2782. doi:10.1158/1078-0432.CCR-13-2702
- Lipson EJ, Vincent JG, Loyo M, Kagohara LT, Luber BS, Wang H, Xu H, Nayar SK, Wang TS, Sidransky D, et al. PD-L1 expression in the Merkel cell carcinoma microenvironment: association with inflammation, Merkel cell polyomavirus and overall survival. Cancer Immunol Res. 2013 Jul;1(1):54–63. doi:10.1158/2326-6066.CIR-13-0034.
- Furusawa A, Reiser J, Sadashivaiah K, Simpson H, Banerjee A. Eomesodermin increases survival and IL-2 responsiveness of tumor-specific CD8+ T cells in an adoptive transfer model of cancer immunotherapy. J Immunother Hagerstown Md 1997. 2018 Mar;41(2):53–63.
- Soliman H, Khalil F, Antonia S. PD-L1 expression is increased in a subset of basal type breast cancer cells. PLoS One. 2014 Feb 14;9(2):e88557. doi:10.1371/journal.pone.0088557.
- Irizarry RA, Hobbs B, Collin F, Beazer-Barclay YD, Antonellis KJ, Scherf U, Speed TP. Exploration, normalization, and summaries of high density oligonucleotide array probe level data. Biostat Oxf Engl. 2003 Apr;4(2):249–264. doi:10.1093/biostatistics/4.2.249.
- Bertucci F, Finetti P, Simeone I, Hendrickx W, Wang E, Marincola FM, Viens P, Mamessier E, Ceccarelli M, Birnbaum D, et al. The immunologic constant of rejection classification refines the prognostic value of conventional prognostic signatures in breast cancer. Br J Cancer. 2018 Nov;119(11):1383–1391. doi:10.1038/s41416-018-0309-1.
- Weiss LM, Medeiros LJ, Vickery AL. Pathologic features of prognostic significance in adrenocortical carcinoma. Am J Surg Pathol. 1989 Mar;13(3):202–206.
- McShane LM, Altman DG, Sauerbrei W, Taube SE, Gion M, Clark GM. REporting recommendations for tumour MARKer prognostic studies (REMARK). Br J Cancer. 2005 Aug 22;93(4):387–391. doi:10.1038/sj.bjc.6602678.