
ABSTRACT
Anti-tumor immune responses impede tumor formation, and cancers have evolved many mechanisms of immune evasion. Confirming earlier findings, we show that human tumors with high chromosomal instability (CIN+) are significantly less immunogenic, as judged by tumor lymphocyte infiltration, compared to those with more stable genomes (CIN-). This finding is paradoxical, as genomic instability is expected to evoke an innate immune response. Importantly, CIN+ tumors and cell lines exhibited suppressed expression of proteins involved in MHC class I antigen presentation at least partly due to DNA hypermethylation of the corresponding genes. Using a mouse model of the in vivo evolution of aneuploid tumors, we found that the induction of chromosomal instability in tumor cells is highly immunogenic due to the activation of the STING/TBK1 pathway and consequent increased interferon signaling and antigen presentation. However, tumors evolving under immune pressure suppress the STING/TBK1 and antigen presentation pathways and evade anti-tumor immune responses. In contrast, CIN+ tumors that develop under low immune pressure in both humans and mice retain efficient MHC class I antigen presentation and immunogenicity. Altogether, this study identifies an important mechanism of immune evasion in chromosomally unstable tumors.
Introduction
Early neoplastic cells are mostly immunogenic and are targeted by both innate and adaptive immune responses.Citation1 Therefore, “successful” tumors are characterized by tumor evasion mechanisms that either reduce their immune visibility (e.g. through reduced antigen presentation), block tumor lymphocyte infiltration (e.g. by β-catenin signalingCitation2) and/or actively suppress tumor-infiltrating effector cells through inhibitory signaling (e.g. due to expression of PD-L1, IDO, etc …).Citation3 The strategy of re-activation of local tumor infiltrates by inhibiting the negative regulatory checkpoints, such as CTLA-4 and PD-1, on T-cells has had a remarkable success in the clinic. However, despite the promise of unprecedented long-term disease management in select patients, the response rates to checkpoint inhibitor therapies are still low, underscoring the importance of poorly understood tumor escape mechanisms.Citation4
Immunotherapy has been traditionally considered for “immunogenic” tumors: those that are characterized by significant lymphocyte infiltration.Citation4 Accordingly, one of the strongest correlates of clinical response to checkpoint inhibitors is the increased tumor lymphocyte infiltration (TLI) both prior to, and in response to, the administration of therapy.Citation5–Citation7 In addition to innate mechanisms of TLI, such as pro-inflammatory oncogenic stress,Citation1 TLI has been proposed to be driven by the adaptive immune response to the tumor-specific antigens. As such, tumor mutational load was found to correlate with TLI in a panel of cancers,Citation8 as well as with the clinical response to PD1 and CTLA4 blockade in lung cancer and melanoma patients.Citation5,Citation7,Citation9,Citation10 A recent study found a strong negative correlation of TLI with tumor aneuploidy, meaning that highly aneuploid tumors were characterized by scarce immune infiltration.Citation11
The finding that aneuploid tumors have suppressed immune infiltration is somewhat paradoxical, as the induction of genomic instability and aneuploidy in tumor cells has been found to elicit anti-tumor immune responses in vivo.Citation12–Citation15 In this study, to identify the mechanisms of immune evasion in chromosomally unstable (CIN+) tumors, we conducted a comprehensive pan-cancer analysis of The Cancer Genome Atlas (TCGA) and the Cancer Cell Line Encyclopedia (CCLE) datasets. We found that antigen presentation through MHC class I pathway (APP) is suppressed in CIN+ tumors and cell lines at least partly due to DNA hypermethylation of the corresponding genes. Then, using a mouse model of CIN+ tumor evolution, we show that APP is in fact induced, not suppressed, by CIN through the cytoplasmic DNA sensing pathway. However, the process of tumor evolution under immune pressure conditions (i.e. immunoselection) in vivo leads to the eventual suppression of APP and to subsequent immune evasion. Our findings shed light on the mechanisms of suppression of TLI in chromosomally unstable tumors, and suggest therapeutic avenues for the forced re-activation of TLI in these patients.
Results
CIN negatively correlates with tumor lymphocyte infiltration
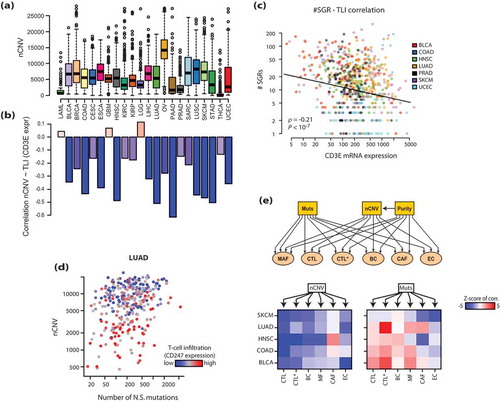
To study the role of CIN in tumor immune infiltration, we retrieved copy number variation (CNV) data for genes measured by the Affymetric SNP6 array across a panel of 22 cancer types from TCGA. We scored CIN as the number of genes that had a gain (i.e. CNV > 0.25) or a loss (CNV < −0.25) of their copy numbers in a given tumor (nCNV). The nCNV values correlated with mutations in TP53 in several cancers (Supp. Figure1A), and strongly correlated with several markers of DNA double strand breaks, a hallmark of CIN, such as increased protein levels of p53 binding protein (p53BP1), Ku80 subunit of DNA-dependent protein kinase, Rad50, and Chk2 (Supp. Figure1B). Moreover, nCNV values strongly correlated with the abundance of genomic structural rearrangements (SGRs), such as chromosomal breakage and fusions, as detected by analyses of whole genome sequencing dataCitation16 (Supp. Figure 1C). It should be noted, however, that SGRs do not account for whole-chromosome or chromosome arm-level events, which may lead to the underestimation of the total genomic structural variations in a tumor. Nevertheless, these correlations suggest that nCNV scores reflect tumor DNA damage and genomic rearrangements, strong characteristics of CIN.
The distributions of CIN scores (nCNV) across tumor types ()) was similar to the distributions of tumor aneuploidy scores from the pan-cancer TCGA analysesCitation17 (Supp. Figure2A). In line with the previous report, we detected a substantial negative correlation of CIN with tumor T-cell infiltration, as judged by the expression of the T-cell receptor gene CD3E in the bulk tumor ()). A similar correlation was observed with the number of structural genomic rearrangements (SGRs) identified from whole genome sequencing of tumor samples ()). Importantly, CIN was a stronger predictor of TLI than non-synonymous mutational burden ()). The strong correlation between CIN and TLI was corroborated in colon adenocarcinomas (COAD), especially within the category of microsatellite instability (MSI)- tumors, and less so for MSI+ cancers, the latter being characterized by exceptionally high mutational load and TLI (Supp. Figure 2B). Altogether this indicates that, contrary to an earlier seminal report,Citation8 CIN is the main predictor of TLI in human tumors.
Figure 1. Chromosomal instability (CIN) correlates with reduced T-lymphocyte infiltration (TLI) in human cancers. a) The distribution of CIN scores (nCNV) across human cancers. b) Correlation of CIN scores with TLI, as measured by the mRNA expression of CD3E in the bulk tumor, in the respective cancres (Spearman’s ρ values shown). c) Correlation of the number of structural genomic rearrangements (SGR) in each tumor sample sample with TLI. SGRs were identified from the whole-genome sequencing studies by a prior study.Citation16 d) A plot of non-synonymous (N.S.) mutation burden and nCNV values in lung adenocarcinoma (LUAD) samples. Each point represents a tumor sample, and its coloring reflects TLI according to the color key. e) Top: the diagram of the SEM model tested. MAF (macrophage), CTL (cytotoxic CD8 + T-cells), CTL* (active CTLs), BC (B-cells), CAF (tumor fibroblasts) and EC (endothelial cells) were defined as latent variables, and the mutational load, nCNV and tumor purity were used as predictors (exogenous variables) to predict their individual partial effects on each of the latent variables (also see Supp. Figure 3A). Bottom: heatmaps showing partial effects (z-scores) of nCNV and mutational burden on each of the factors in the indicated cancers. Red: significant positive impact, Blue: significant negative impact. A z-score of |1.96| corresponds to a p-value of 0.05, so one would expect the pairs that are <-2 or >2 to be significant at P < .05 in this heatmap. The abbreviations of TCGA cancer types are explained in Supplementary Table 1.
Immune and stromal cell types in CIN+ tumors
To examine how CIN and mutational load affect the composition of immune and non-immune cell infiltrates in tumors, we employed the powerful multivariate regression method Structural Equation Modeling (SEM), which combines confirmatory factor analysis with path analyses, thus allowing to analyze complex structural regression models with unobserved latent variables (e.g. immune infiltrates).Citation18 Using a set of cell type-specific markers for cytotoxic T cells (CTL), B cells (BC), macrophages (MAF), cancer-associated fibroblasts (CAF) and endothelial cells (EC) from a recent single-cell RNAseq analysis of melanoma tumor tissues,Citation19 we constructed a latent variable model that captured each cell-type specific expression pattern (Supp.Figure 3A). Beyond these cell types, we defined “active CTL” as another latent variable to measure activated effector cell content in tumors, based on several markers of activated effector cells, such as GZMB, IFNG, PRF1 and CD38. Importantly, our SEM model could accurately capture each cell type-specific marker (Supp. Figure 3B), indicating that our latent variables denote the molecular correlates associated with the different immune cell types. The final SEM model is illustrated in ()), which we used to model the correlation of CIN (measured by nCNV) and the non-synonymous mutational load with the 6 types of infiltrating cells in tumors. In our model, we also included tumor purity (measured by CHATCitation20) to control for potential confounding effects.
We applied SEM to several cancer type specific datasets (urothelial bladder carcinoma, BLCA; colon adenocarcinoma, COAD; head and neck squamous carcinoma, HNSC; lung adenocarcinoma. LUAD and cutaneous melanoma, SKCM), where the nCNV – TLI correlation was strong (see )). The nCNV values strongly correlated with CTL in all five cancers as shown above ()). Interestingly however, nCNV most strongly correlated with CTL, and much less so with the presence of macrophages (MAF) and fibroblasts (CAF) in the tumor bed. Intriguingly, although nonsynonymous mutation load was not a significant factor in controlling TLI, it did strongly correlate with local CTL activation in BLCA, COAD and LUAD ()), as also indicated by high levels of cleaved (i.e. active) caspase 7, indicative of apoptotic cell death (Supp. Figure 3C). These observations suggest that CIN negatively affects CTL infiltration, while mutational load may contribute to CTL activation.
Molecular correlates of CIN in cancer tissues and cell lines
The finding that TLI is suppressed in CIN+ tumors counters our current understanding, as CIN has been shown to evoke anti-tumor immunity through proteotoxic stressCitation14 and innate cytoplasmic DNA sensing.Citation12,Citation15 Indeed, genomic instability leads to the accumulation of damaged DNA in the cytoplasm, where it triggers the cGAS/STING pathway and a subsequent type I interferon response, thus eliciting an efficient anti-tumor immune surveillance.Citation21 The finding that human tumors display a strongly opposite phenotype suggests that tumors employ secondary mechanisms to suppress TLI and evade anti-tumor immune surveillance.
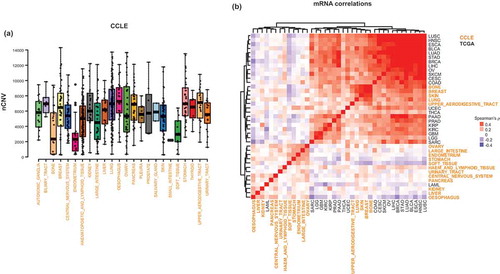
In order to identify the potential mechanisms of suppression of TLI by CIN+ tumors, we analyzed the global mRNA- and protein-level correlates of CIN (i.e. CIN signatures) in tumor clinical samples (from TCGA) and in cancer cell lines (from CCLE). The distribution of nCNV values in cancer cell lines shows a wide distribution, similar to clinical samples ()). The comparison of transcriptomic CIN signatures between the cancer tissues and cell lines showed a significant concordance between some, though not all, cancer cell lines and tissues ()). Although the transcriptomic CIN signatures were highly similar among all the cancer tissues, except for LAML (myeloid leukemias), only the cancer cell lines from lung, breast, skin, bone and upper aerodigestive tract showed the correlation profiles that were highly consistent with those in the tissues ()). Similar findings were obtained for the proteomic CIN signatures obtained from the reverse-phase protein array (RPPA) data (Supp. Figure 4A), where the cancer cell lines of lung, bone, breast and skin, but not upper aerodigestive tract, displayed CIN signatures that were consistent with those in human cancer tissues. These observations suggest that the cancer cell lines of these lineages are acceptable in vitro models to study the mechanisms associated with CIN in cancers.
Figure 2. CIN-associated molecular profiles (signatures) are conserved in some cancer cell lines. a) The distribution of CIN values in cancer cell lines. b) The heatmap of pair-wise comparison (Spearman’s ρ) of the transcriptomic CIN signatures among the indicated cancer tissues and cell lines. Note high similarity of most tissues and some cancer cell line models.
The MHC-I antigen presentation pathway is suppressed in CIN+ tumors
The analyses of proteomic CIN signatures that were consistent among the cancer tissues and cell lines revealed a widespread upregulation of proteins related to DNA damage response, such as p53BP1 (p53-binding protein), the Ku80 subunit of DNA-dependent protein kinase, CHK2 (checkpoint kinase 2), MSH2 and MSH6 (Supp. Figure 4B). These are expected correlations, as CIN is associated with extensive DNA damage in cells. The consistently suppressed proteins included LCK, a lymphocyte-specific kinase and stress kinases (p38 and JNK).
For the functional analyses of transcriptomic CIN signatures, we chose to employ a pathway-based scoring scheme exploiting the prior knowledge of functional gene-gene interactions to facilitate the mechanistic interpretations. We performed NetWalk-based scoring of pathwaysCitation22,Citation23 based on the CIN signatures, and prioritized the best-scoring pathways for each tissue in a clustered heatmap ()). As with RPPA, the pathways with a positive association with CIN were mostly related to the DNA damage response and mitotic progression ()), whereas those with the most negative association were related to immune processes. In addition, the positive-scoring pathways included mitochondrial metabolism, and the negative-scoring pathways included many pathways related to extracellular matrix remodeling.
Figure 3. Antigen processing and presentation is suppressed in CIN+ cancer tissues and cell lines. a) Heatmap of pathway scores calculated with genome-wide nCNV-mRNA correlations in the indicated cancer tissues and cell lines using NetWalker. As with correlations, a positive score (red) indicates positive association with CIN, and a negative score (blue) indicates a negative association with CIN. b) Network plots of some sample pathways from A, where nodes are colored by their individual nCNV~mRNA correlation values in cancer tissues (for the upper three pathways) and cell lines (for the Antigen presentation pathway at the bottom). c) Barplot of nCNV values in lung cancer cell lines (up) and LUAD samples (bottom), with each bar (sample) colored by its relative expression of ERAP2 (endoplasmic reticulum aminopeptidase 2), a key enzyme in the processing of antigenic peptides for the MHC-I complex.
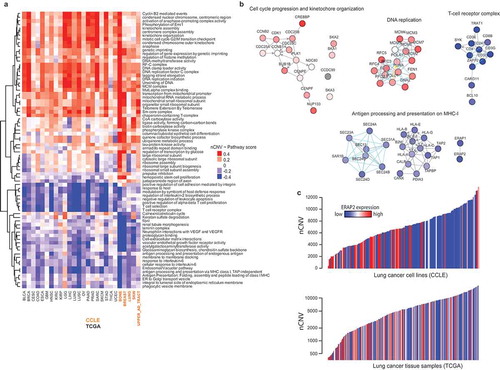
An intriguing finding in this analysis was that both the cell lines and the tissues revealed a significant negative association of the MHC-I antigen processing and presentation (APP) pathway with CIN ()), such that, CIN+ tumors and cell lines were both characterized by extensive suppression of APP genes ()).
Tumors and other tissues present their antigens on the MHC-I complexes, which are recognized by antigen-specific T-cells through their T-cell receptors (TCR). The MHC-I: TCR interaction is crucial for effector T-cells to initiate an anti-tumor attack, and amplify the systemic anti-tumor immune response.Citation24 As such, the down-regulation of the MHC-I machinery, including the HLA, TAP1 and B2M genes, are frequently employed by cancers to avoid the recognition by CTL.Citation25 Therefore, the relative underexpression of these genes in CIN+ tumors suggests a primary culprit in the suppression of TLI in CIN+ tumors. Importantly, the observation of this suppression in cancer cell lines shows that the effect is tumor cell-autonomous, rather than an artifact due to the dilution of cancer cells by tumor-infiltrating ancillary cells.
APP genes are hypermethylated in CIN+ tumors and cell lines
The Class I HLA genes (HLA-A,B,C,E,F,G) reside on the chromosome 6p21-22, along with TAP1 (tapasin 1), which plays a key role in the loading of antigen peptides onto the MHC-I complex. The 6p locus undergoes frequent copy number changes (both losses and gains) in cancers (not shown). Therefore, it is possible that their reduced expression in CIN+ tumors reflects their copy number loss. However, we found that the copy number changes in 6p21-22 genes of APP exhibit no, or a positive, correlation with nCNV values in cancers ()), suggesting that copies of these genes are frequently gained, not lost, in CIN+ tumors. Moreover, their expression seemed to be independent of their copy number changes in CIN+ HNSC tumors ()). In contrast, B2M (chromosome 15q21), which encodes the light chain of the MHC-I complex, seems to be frequently lost (shallow loss) in some CIN+ tumors (not shown). However, even in LUAD, where the most negative association of B2M copy numbers with nCNV is observed, B2M expression in CIN+ tumors seems to be suppressed regardless of its gene copy number changes ()), suggesting that the gene copy number variations in the APP genes do not play a role in their suppression in CIN+ tumors.
Figure 4. Antigen processing and presentation pathway genes are suppressed in CIN+ tumors through DNA hyper-methylation. a) Correlation of CNVs of indicated APP genes with CIN in the indicated cancer tissues. All of these genes, except for B2M, reside on 6p21-22. b) A plot of HNSC (head and neck cancer, TCGA) samples scattered by their TAP1 CNV (x-axis) and nCNV (y-axis). Coloring of points (samples) is by relative TAP1 mRNA expression. c) Same as in (B), for B2M in LUAD samples. d) Same as in (C), but with the coloring of samples reflecting the relative DNA methylation of B2M. e) Left: a network plot of DNA methyl-transferase genes, with their coloring reflecting the correlation of the expression of the respective genes with nCNV in LUAD. Right: heatmap of correlations of DNA methylation of the indicated genes with nCNV in the indicated cancers. f) Barplots of correlation values of B2M (up) and HLA-A (bottom) with nCNV in the indicated datasets. *: P ≤ 0.05, **: P < .01. g) Correlation of promoter DNA methylation of the indicated genes with nCNV in lung cancer cell lines from CCLE. *: P ≤ 0.05.
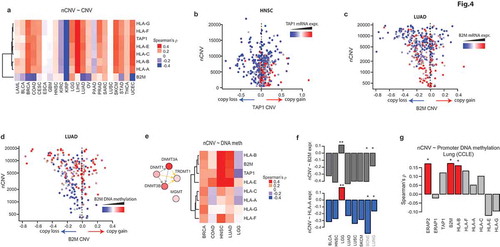
Next, we hypothesized that DNA hypermethylation may play a role in the suppression of APP genes. Indeed, the DNA methylation of B2M showed a strong correlation with increasing nCNV in LUAD ()). Analyses of the DNA methylation profiles of the APP genes in several other cancer types (4 where the CIN – TLI correlation was strong, and one [low grade glioma, LGG] where the correlation was reversed) showed a similar pattern of strong positive correlation, except for LGG, where the pattern seemed to be reversed ()). The latter is consistent with the positive, rather than negative, correlation of CIN with the expression of these genes ()) and with TLI in LGG (see )). An analysis of the promoter DNA methylation profiles of genes for the cancer cell lines, based on reduced representation bisulfite sequencing (RRBS) data, showed a similarly strong positive correlation of CIN with some of the APP genes, though not all ()), suggesting that the effect is not as strong in the cell lines. Nevertheless, the observations above show that APP genes are suppressed in CIN+ tumors through DNA hypermethylation.
Interestingly, the tumor type where CIN was positively correlated with the expression of APP and with TLI was low-grade glioma (LGG), which are also the least immune-infiltrated of adult tumors in TCGA (see )), perhaps due to the immune-privileged status of the brain. This suggests that DNA hyper-methylation of APP genes may be an adaptive mechanism to evade anti-tumor immune surveillance under immune pressure (i.e. immunoselection). However, LGG tumors are not under immune pressure, correlating with the fact that they do not downregulate APP genes.
APP is induced by CIN, but suppressed during tumor evolution under immune pressure
To test the hypothesis that the suppression of APP gene expression is an adaptive mechanism of CIN+ tumors to evade anti-tumor immune surveillance, we took advantage of CIN+ derivative clones of a near-diploid mouse colon cancer cell line CT26 that were generated by transiently exposing them to nocodazole in vitro (hyperploid clone: HP). To mimic the tumor evolution under immune pressure, we serially passaged HP cells in immune-competent mice to obtain immunoselected clones (IC1 and IC2). As a control, we also passaged them similarly in immune-deficient (Rag2−/-γ−/-) mice to obtain ID clones (immune non-selected) ()). Since the CIN+ tumors that had been immunoselected through passaging in wild-type mice often exhibit loss of chromosomes to avoid proteotoxic stress and immunogenicity,Citation14 we selected a clone (HP) that did not exhibit any major chromosome loss and thus retained their original hyperploidy for our subsequent analyses ()).
Figure 5. Inflammatory response signaling and antigen presentation are suppressed in CIN+ tumors by immunoselection. a) Diagram of development of the indicated CT26 cell clones (HP: parental hyperploid, IC: immunoselected hyperploid clone [i.e. passaged in immune-competent mice], ID: hyperploid clone passaged in immune-deficient mice). b) Flow cytometry profiles of DNA content of the indicated cells. c) In vivo tumor growth curves of the indicated lines in immune-competent Balb/c mice. Error bars: s.d. of two mice per group. *: P < .05 by t-test. d) Immunoblots of indicated proteins in the indicated lines. e) Distribution of cell surface expression of H2-KD in the indicated lines as measured by flow cytometry. f) Genome-wide correlation profiles of the transcriptomic signatures of CT26 and its derivative lines with the CIN signatures of indicated cancers from TCGA. The coloring in the heatmap reflects – log10-transformed p-values of Spearman’s rank correlation of the corresponding signatures adjusted by the direction of correlation (i.e. negative indicates negative correlation and vice versa). g) Heatmap of pathway scores calculated from the genome-wide transcriptomic analyses of indicated lines by NetWalker. Pathway scores reflect relative expression in the indicated lines (red: high, blue: low). h) Network plot of the highest scoring sub-network in the HP line from NetWalk analysis. The coloring of nodes reflects their relative expression in HP line. Inset: Ifnb2 mRNA levels measured by qPCR in the WT, HP, IC1, IC2 and ID lines normalized to β-actin. i) Left: a diagram of Sting-mediated cytoplasmic DNA sensing pathway. Right: heatmap of relative expression of the indicated Sting pathway genes in the indicated lines. j) Immunoblot of some key cGas/Tbk1 pathway proteins in the indicated lines. k) Top: Ifnb1 mRNA levels (qPCR) in HP cells upon treatment with the TBK inhibitor. Error bars: s.d. of two replicates. Bottom: Immunoblot of B2m and H2-KD in HP cells before and after treatment with the increasing doses of the TBK1 inhibitor (BX795). l) Heatmap of correlations of type I interferon response (top) and STING (bottom) pathway genes with CIN in the indicated cancers from TCGA. Western blots in the panels D, J and K are representative of at least two independent experiments.
![Figure 5. Inflammatory response signaling and antigen presentation are suppressed in CIN+ tumors by immunoselection. a) Diagram of development of the indicated CT26 cell clones (HP: parental hyperploid, IC: immunoselected hyperploid clone [i.e. passaged in immune-competent mice], ID: hyperploid clone passaged in immune-deficient mice). b) Flow cytometry profiles of DNA content of the indicated cells. c) In vivo tumor growth curves of the indicated lines in immune-competent Balb/c mice. Error bars: s.d. of two mice per group. *: P < .05 by t-test. d) Immunoblots of indicated proteins in the indicated lines. e) Distribution of cell surface expression of H2-KD in the indicated lines as measured by flow cytometry. f) Genome-wide correlation profiles of the transcriptomic signatures of CT26 and its derivative lines with the CIN signatures of indicated cancers from TCGA. The coloring in the heatmap reflects – log10-transformed p-values of Spearman’s rank correlation of the corresponding signatures adjusted by the direction of correlation (i.e. negative indicates negative correlation and vice versa). g) Heatmap of pathway scores calculated from the genome-wide transcriptomic analyses of indicated lines by NetWalker. Pathway scores reflect relative expression in the indicated lines (red: high, blue: low). h) Network plot of the highest scoring sub-network in the HP line from NetWalk analysis. The coloring of nodes reflects their relative expression in HP line. Inset: Ifnb2 mRNA levels measured by qPCR in the WT, HP, IC1, IC2 and ID lines normalized to β-actin. i) Left: a diagram of Sting-mediated cytoplasmic DNA sensing pathway. Right: heatmap of relative expression of the indicated Sting pathway genes in the indicated lines. j) Immunoblot of some key cGas/Tbk1 pathway proteins in the indicated lines. k) Top: Ifnb1 mRNA levels (qPCR) in HP cells upon treatment with the TBK inhibitor. Error bars: s.d. of two replicates. Bottom: Immunoblot of B2m and H2-KD in HP cells before and after treatment with the increasing doses of the TBK1 inhibitor (BX795). l) Heatmap of correlations of type I interferon response (top) and STING (bottom) pathway genes with CIN in the indicated cancers from TCGA. Western blots in the panels D, J and K are representative of at least two independent experiments.](/cms/asset/e2db0b57-9773-4f88-8921-aaf38cf74164/koni_a_1657374_f0005_oc.jpg)
Importantly, and as reported previously,Citation14 induction of CIN renders CT26 cells immunogenic, as HP cells grow slower in immune-competent hosts in vivo ()). However, the clones obtained from serial passaging under immune pressure (IC1 and IC2) had a significantly faster growth rate compared to both parental and hyperploid CT26 cells ()). These observations show that, while the induction of CIN is immunogenic, CIN+ tumor growth under immune pressure selects for a population of cells that gain the ability to evade anti-tumor immune surveillance.
Intriguingly, the expression of key APP proteins was significantly increased in hyperploid clones cultured in vitro (HP cells, )), and showed increased cell surface expression of the MHC-I complex ()). However, in line with our hypothesis, the IC, but not ID, clones showed a profound suppression of the expression of APP proteins ()), coupled to reduced cell surface expression of MHC-I complex ()).
In order to gain a holistic view of the molecular changes during the evolution of CIN+ tumors, we used RNA sequencing to characterize the transcriptomes of the parental CT26, HP, IC1, IC2 and ID cells. First, we tested if the global relative mRNA expression profiles of these cells (i.e. their signatures) showed similarity to the transcriptomic CIN signatures from human cancer tissues (see )). Interestingly, we found that the global transcriptional signatures of the IC1 and IC2 clones was significantly similar to the CIN signatures of several cancers that also showed a negative CIN-TLI correlation (see )), while that of HP cells was highly similar to the CIN signatures of glioblastoma multiforme (GBM), and to a lesser degree, of LGG, where CIN correlated with higher TLI ()). These observations strongly suggest that while the transcriptomes of CIN+ brain tumors resemble non-immunoselected CIN+ cells, the transcriptomes of CIN+ non-brain tumors resemble immunoselected CIN+ cells, and thus may have been shaped by immunoselection.
Next, we performed network-based pathway analyses of these cells’ transcriptomic signatures. Strikingly, we found that the processes related to inflammatory response, interferon signaling and dsRNA sensing pathways were among the highest-scoring processes in the HP line ()). However, these processes were significantly suppressed in the IC1-2, but not ID1, clones ()), suggesting that prolonged tumor growth under immune pressure led to their suppression. Accordingly, HP and ID lines exhibited a dramatic induction of Ifnb1 (encoding Interferon β) relative to the parental cells; but this Ifnb1 increase was suppressed in the IC lines ()).
Since the cytoplasmic DNA sensing through the STING/TBK1 pathway has been shown to have a central role in the induction of the immune responses to CIN,Citation13,Citation15 we evaluated the expression levels of genes involved in this pathway genes. The expression of many key players, such as Cgas, Ifi204 and Irf7 were increased in HP, but suppressed in the IC, but not ID, lines at the mRNA level ()). We observed a similar trend at the protein level as well, where, in addition to total levels, phosphorylated forms of the key pathway players, such as Sting, Tbk1 and Irf3, were increased in HP, but suppressed in IC, but not ID, cells ()). Furthermore, confirming the role of the STING/TBK1 pathway in the pro-immunogenic state of HP lines, treating the HP cells with a TBK1 inhibitory compound suppressed the expression of Ifnb1, as well as of B2m and H2-Kd (MHC-I subunit)()). These results support our hypothesis that the pro-inflammatory response to CIN, involving STING pathway signaling, type I response and APP, is suppressed during the evolution of CIN+ tumors under immune pressure, and lead to an immunologically cold state. Finally, in support of this hypothesis in the clinical samples, while CIN+ brain tumors, which are not subject to immunoselection (i.e. GBM, LGG), showed an overall overexpression of the type I interferon response and STING pathway genes, CIN+ non-brain tumors, which evolve under strong immune pressure, showed an overall suppression of these genes ()).
Discussion
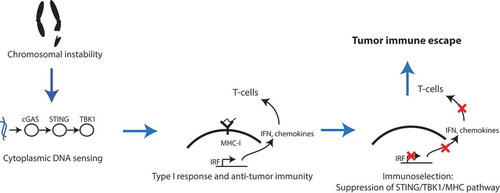
Unlike tumors with high microsatellite instability, which are characterized by high mutational burden and immune infiltration,Citation8 tumors with chromosomal instability, which are characterized by large structural aberrations, are immunologically cold.Citation11 This is seemingly at odds with the multitude of studies showing the pro-inflammatory effect of CIN and the subsequent DNA damage response in tumor cells.Citation12–Citation15,Citation21 Our computational interrogation of the legacy genomic datasets from cancer tissues and cell lines, combined with our analyses of an experimental model of tumor aneuploidy, support a model of CIN+ tumor evolution, where the initial induction of CIN leads to the activation of the cGAS/STING pathway and of pro-inflammatory signaling, leading to the induction of MHC-I antigen presentation and a pro-immunogenic state in the tumor. However, as tumors evolve under the immune pressure, they suppress the innate immune response signaling machinery and antigen presentation, and acquire an immunologically cold state (). Consistent with this hypothesis, human (e.g. GBM and LGG) and mouse CIN+ tumors (ID clones) that do not experience significant immune pressure during their evolution retain their pro-inflammatory character, and display high expression of STING, innate response and APP pathway genes compared to genomically more stable tumors. The suppression of pro-inflammatory (including cGAS/STING) and APP pathway genes in CIN+ tumors is likely to be due to immune editing,Citation3 where nascent transformed cells with CIN that are immunogenic are eliminated by the immune system, and only clones that suppress the STING/APP pathway can thrive, thus giving rise to immunologically cold tumors.
Figure 6. Schematic model of the evolution of CIN+ tumors. CIN creates an immune pressure in the nascent tumor cells due to the activation of the STING pathway and subsequent innate anti-tumor response. This immune pressure allows for the selection of CIN+ clones that have uncoupled genomic instability from the activation of the STING pathway activation and consequent immunostimulation. The resultant tumors are thus immunologically cold.
Our analyses suggest that the suppression of APP genes is unlikely to be due to the deletion of these genes, but rather due to their epigenetic silencing (see ). Inactivation of tumor suppressor genes through DNA methylation during oncogenesis and cancer progression is a well-characterized phenomenon, and our analyses reveal yet another pathway targeted by this machinery in cancers under immune pressure. Interestingly, the expression of the DNA methyltransferase machinery is significantly upregulated in CIN+ tumors (see )). However, this is unlikely to lead to genome-wide increases in the DNA methylation, as the cumulative DNA methylation seems to decrease, rather than increase, with CIN (not shown). Therefore, the hypermethylation of APP genes might be the result of gene locus-specific, rather than genome-wide changes, in DNA methylation. Identifying the causal players of APP gene suppression will be crucial to design intervention strategies to reactivate the TLI in CIN+ tumors. In this regard, artificial STING agonists and DNA methylation inhibitors (5-azacytidine), both of which are currently in clinical trials, may be attractive immediate candidates to test for the re-activation of the cGAS/STING pathway and re-expression of APP genes.
Methods
Datasets
TCGA RNAseq, RPPA, CNV and Methylomic datasets were obtained from the Broad GDAC Firehose (https://gdac.broadinstitute.org/). CCLE RNAseq, RPPA, CNV and RBBS data were obtained from the CCLE data portal (https://portals.broadinstitute.org/ccle/data).
Definition of CIN
We scored CIN as the number of genes that had CNV values greater than |0.25|. This measure strongly correlated with the aneuploidy scores from the pan-cancer TCGA study (see Supp. Figure 2A). For CCLE, we defined the threshold at |0.5|, due to the higher purity of the cell line data. Using different thresholds did not significantly affect the results.
Calculation of CIN signatures
We defined transcriptomic CIN signature as the vector of correlation values (Spearman’s ρ) of each gene’s mRNA expression with nCNV in a given cancer. Proteomic CIN signatures were defined same way, but using RPPA data instead of mRNA expression.
Structural equation modeling analyses
SEM analyses were conducted using the R package lavaan. The equations were defined as described in Supp. Figure 3A, and SEM was run using standard parameters.
Pathway analyses and scoring
To convert gene-based measures (e.g. transcriptomic CIN signature) to pathway-based scores, we used our previously developed method NetWalk implemented in NetWalker using standard parameters. The interpretation of the pathway scores are similar to the interpretation of the original correlation values that were used to derive them: more positive values indicate enrichment for the more positive correlation values, and more negative values indicate higher enrichment for the negative correlation values.
Analyses of methylation data
For TCGA, the Infinium 450k array data were used. To enable gene-level correlations with nCNV, we summed the methylation beta-values for the probes of each gene, and used the resultant values for correlation analyses in . For CCLE, the RRBS data from promoter CpG clusters were used. Gene-level correlations were done as described above by summing the values for each gene.
Cell culture
The HP, IC and ID clones from CT26 cells were generated as described. All cells were cultured in DMEM supplemented with 10% FBS and 0.1% antibiotic and antimycotic (Gibco), in a humidified atmosphere in 5% CO2 at 37°C. All cells were regularly tested for mycoplasma contamination and were negative.
Tumor growth assay
Balb/C mice (6–8 weeks old, Jackson Laboratories) were injected with 1 × 10Citation6 cells of the indicated lines subcutaneously into the right flank. Tumor volumes were monitored every two days up to day 24, at which point the mice were euthanized. Animal research was approved and overseen by The CCHMC Institutional Animal Care and Use Committee (CCHMC IACUC).
Immunoblotting
Total proteins were extracted with RIPA buffer (Santa Cruz Biotechnology, sc-24948), and 15µg protein from each sample was run in a 4–18% SDS polyacrylamide gel (Bio-Rad), and transferred onto polyvinylidene difluoride membranes. The membranes were blocked in 5% dry milk in tris-buffered saline–Tween 20 for 1 hour. Blocked membranes were incubated overnight with primary antibodies in 5% bovine serum albumin. After washing and incubating with the appropriate secondary antibody, protein signals were detected with enhanced chemiluminescence (Millipore). The normalized quantifications of band intensities in the blots in are provided in Supplementary Table 3.
Antibodies
Except for B2M (Abcam) and H2-Kd (Biolegend), all the antibodies were from Cell Signaling.
Rnaseq
Total RNA was extracted from the cells using Tri reagent (Sigma). RNase-free DNase was used for removing all genomic DNA contamination. The RNA was precipitated by Isopropanol (Sigma), washed by ice cold 75% ethanol (Sigma), and air dried prior to resuspension in 20 µl of DEPC-treated water. Purity and concentration of RNA was measured by NanoDrops (Thermo Scientific). The 260/280 ratio was 1.90–2.00 and the 260/230 ratio was 2.00–2.20 for all RNA Samples.
Directional polyA RNA-seq was performed by the Genomics, Epigenomics and Sequencing Core (GESC) at the University of Cincinnati. NEBNext Poly(A) mRNA Magnetic Isolation Module (New England BioLabs, Ipswich, MA) was used for polyA RNA purification with a total of 50 ng to 1 µg of good quality total RNA as input. The Core used Apollo 324 system (WaferGen, Fremont, CA) and ran PrepX PolyA script for automated ployA RNA isolation. NEBNext Ultra Directional RNA Library Prep Kit (New England BioLabs, Ipswich, MA) was used for library preparation, which used dUTP in cDNA synthesis to maintain strand specificity. In short, the isolated polyA RNA was Mg2+/heat fragmented (~200 bp), reverse transcribed to 1st strand cDNA, followed by 2nd strand cDNA synthesis labelled with dUTP. The purified cDNA was end repaired and dA tailed, and then ligated to adapter with a stem-loop structure. The dUTP-labelled 2nd strand cDNA was removed by USER enzyme to maintain strand specificity. After indexing via PCR (~12 cycles) enrichment, the amplified libraries together with library preparation negative control were cleaned up by AMPure XP beads for QC analysis. Libraries at the final concentration of 15.0 pM was clustered onto a single read (SR) flow cell using Illumina’s TruSeq SR Cluster kit v3, and sequenced for 50 bp using TruSeq SBS kit on Illumina HiSeq system.
The fastq files from RNA-seq data were used to quantify gene-level expression using RSEMCitation26 (Supp. Table 2). To obtain transcriptomic signatures (see )), the expression of each gene in each line was row-normalized by taking the log2-transform of the ratio of its expression to the average in all 5 cells.
Supplemental Material
Download Zip (2.3 MB)Acknowledgments
This work was in part supported by NCI (CA193549) award to KK. The genomic sequencing core at the University of Cincinnati is supported by P30-ES006096. GK is supported by the Ligue contre le Cancer (équipe labellisée); Agence National de la Recherche (ANR) – Projets blancs; ANR under the frame of E-Rare-2, the ERA-Net for Research on Rare Diseases; Association pour la recherche sur le cancer (ARC); Cancéropôle Ile-de-France; Chancelerie des universités de Paris (Legs Poix), Fondation pour la Recherche Médicale (FRM); a donation by Elior; European Research Area Network on Cardiovascular Diseases (ERA-CVD, MINOTAUR); the European Union Horizon 2020 Project Oncobiome; Fondation Carrefour; Institut National du Cancer (INCa); Inserm (HTE); Institut Universitaire de France; LeDucq Foundation; the LabEx Immuno-Oncology; the RHU Torino Lumière; the Seerave Foundation; the SIRIC Stratified Oncology Cell DNA Repair and Tumor Immune Elimination (SOCRATE); and the SIRIC Cancer Research and Personalized Medicine (CARPEM).
Supplementary material
Supplemental data for this article can be accessed on the publisher’s website.
Additional information
Funding
References
- Vesely MD, Kershaw MH, Schreiber RD, Smyth MJ. Natural innate and adaptive immunity to cancer. Annu Rev Immunol. 2011;29:1–11. doi:10.1146/annurev-immunol-031210-101324.
- Spranger S, Bao R, Gajewski TF. Melanoma-intrinsic beta-catenin signalling prevents anti-tumour immunity. Nature. 2015;523(7559):231–235. doi:10.1038/nature14404.
- Zitvogel L, Tesniere A, Kroemer G. Cancer despite immunosurveillance: immunoselection and immunosubversion. Nat Rev Immunol. 2006;6(10):715–727. doi:10.1038/nri1936.
- Sharma P, Allison JP. Immune checkpoint targeting in cancer therapy: toward combination strategies with curative potential. Cell. 2015;161(2):205–214. doi:10.1016/j.cell.2015.03.030.
- Van Allen EM, Miao D, Schilling B, Shukla SA, Blank C, Zimmer L, Sucker A, Hillen U, Foppen MHG, Goldinger SM, et al. Genomic correlates of response to CTLA-4 blockade in metastatic melanoma. Science. 2015;350(6257):207–211. doi:10.1126/science.aad0095.
- Tumeh PC, Harview CL, Yearley JH, Shintaku IP, Taylor EJM, Robert L, Chmielowski B, Spasic M, Henry G, Ciobanu V, et al. PD-1 blockade induces responses by inhibiting adaptive immune resistance. Nature. 2014;515(7528):568–571. doi:10.1038/nature13954.
- Riaz N, Havel JJ, Makarov V, Desrichard A, Urba WJ, Sims JS, Hodi FS, Martín-Algarra S, Mandal R, Sharfman WH, et al. Tumor and Microenvironment Evolution during Immunotherapy with Nivolumab. Cell. 2017;171(4):934–949. doi:10.1016/j.cell.2017.09.028.
- Rooney MS, Shukla SA, Wu CJ, Getz G, Hacohen N. Molecular and genetic properties of tumors associated with local immune cytolytic activity. Cell. 2015;160(1–2):48–61. doi:10.1016/j.cell.2014.12.033.
- Snyder A, Makarov V, Merghoub T, Yuan J, Zaretsky JM, Desrichard A, Walsh LA, Postow MA, Wong P, Ho TS, et al. Genetic basis for clinical response to CTLA-4 blockade in melanoma. N Engl J Med. 2014;371(23):2189–2199. doi:10.1056/NEJMoa1406498.
- Hugo W, Zaretsky JM, Sun L, Song C, Moreno BH, Hu-Lieskovan S, Berent-Maoz B, Pang J, Chmielowski B, Cherry G, et al. Genomic and Transcriptomic Features of Response to Anti-PD-1 Therapy in Metastatic Melanoma. Cell. 2016;165(1):35–44. doi:10.1016/j.cell.2016.02.065.
- Davoli T, Uno H, Wooten EC, Elledge SJ. Tumor aneuploidy correlates with markers of immune evasion and with reduced response to immunotherapy. Science. 2017;355(6322). doi:10.1126/science.aaf8399.
- Santaguida S, Richardson A, Iyer DR, M’Saad O, Zasadil L, Knouse KA, Wong YL, Rhind N, Desai A, Amon A. Chromosome mis-segregation generates cell-cycle-arrested cells with complex karyotypes that are eliminated by the Immune System. Dev Cell. 2017;41(6):638–651. doi:10.1016/j.devcel.2017.05.022.
- Harding SM, Benci JL, Irianto J, Discher DE, Minn AJ, Greenberg RA. Mitotic progression following DNA damage enables pattern recognition within micronuclei. Nature. 2017;548(7668):466–470. doi:10.1038/nature23470.
- Senovilla L, Vitale I, Martins I, Tailler M, Pailleret C, Michaud M, Galluzzi L, Adjemian S, Kepp O, Niso-Santano M, et al. An immunosurveillance mechanism controls cancer cell ploidy. Science. 2012;337(6102):1678–1684. doi:10.1126/science.1224922.
- Mackenzie KJ, Carroll P, Martin C-A, Murina O, Fluteau A, Simpson DJ, Olova N, Sutcliffe H, Rainger JK, Leitch A, et al. cGAS surveillance of micronuclei links genome instability to innate immunity. Nature. 2017;548(7668):461–465. doi:10.1038/nature23449.
- Yang L, Luquette LJ, Gehlenborg N, Xi R, Haseley PS, Hsieh C-H, Zhang C, Ren X, Protopopov A, Chin L, et al. Diverse mechanisms of somatic structural variations in human cancer genomes. Cell. 2013;153(4):919–929. doi:10.1016/j.cell.2013.04.010.
- Thorsson V, Gibbs DL, Brown SD, Wolf D, Bortone DS, Ou Yang T-H, Porta-Pardo E, Gao GF, Plaisier CL, Eddy JA, et al. The Immune Landscape of Cancer. Immunity. 2018;48(4):812–830. doi:10.1016/j.immuni.2018.03.023.
- Kline R. Principles and Practice of Structural Equation Modeling. New York, NY: The Guilford Press; 1998.
- Tirosh I, Izar B, Prakadan SM, Wadsworth MH, Treacy D, Trombetta JJ, Rotem A, Rodman C, Lian C, Murphy G, et al. Dissecting the multicellular ecosystem of metastatic melanoma by single-cell RNA-seq. Science. 2016;352(6282):189–196. doi:10.1126/science.aad0501.
- Li B, Li JZ. A general framework for analyzing tumor subclonality using SNP array and DNA sequencing data. Genome Biol. 2014;15(9):473. doi:10.1186/s13059-014-0473-4.
- Vanpouille-Box C, Demaria S, Formenti SC, Galluzzi L. Cytosolic DNA Sensing in Organismal Tumor Control. Cancer Cell. 2018;34(3):361–378. doi:10.1016/j.ccell.2018.05.013.
- Komurov K, Dursun S, Erdin S, Ram PT. NetWalker: a contextual network analysis tool for functional genomics. BMC Genomics. 2012;13:282. doi:10.1186/1471-2164-13-282.
- Komurov K, White MA, Ram PT. Use of data-biased random walks on graphs for the retrieval of context-specific networks from genomic data. PLoS Comput Biol. 2010;6(8). doi:10.1371/journal.pcbi.1000889.
- Chen DS, Mellman I. Oncology meets immunology: the cancer-immunity cycle. Immunity. 2013;39(1):1–10. doi:10.1016/j.immuni.2013.07.012.
- Garrido F, Aptsiauri N, Doorduijn EM, Garcia Lora AM, van Hall T. The urgent need to recover MHC class I in cancers for effective immunotherapy. Curr Opin Immunol. 2016;39:44–51. doi:10.1016/j.coi.2015.12.007.
- Li B, Dewey CN. RSEM: accurate transcript quantification from RNA-Seq data with or without a reference genome. BMC Bioinformatics. 2011;12:323. doi:10.1186/1471-2105-12-323.