
ABSTRACT
Macrophages are widely distributed innate immune cells that play an indispensable role in a variety of physiologic and pathologic processes, including organ development, host defense, acute and chronic inflammation, solid and hematopoietic cancers. Beyond their inextricable role as conveyors of programmed cell death, we have previously highlighted that caspases exert non-apoptotic functions, especially during the differentiation of monocyte-derived cells in response to CSF-1. Here, we found that non-canonic cleavages of caspases, reflecting their activation, are maintained during IL-4-induced monocyte-derived macrophages polarization. Moreover, Emricasan, a pan-caspase inhibitor that demonstrated promising preclinical activity in various diseases and safely entered clinical testing for the treatment of liver failure, prevents the generation and the anti-inflammatory polarization of monocyte-derived macrophages ex vivo. Interestingly, caspase inhibition also triggered the reprogramming of monocyte-derived cells evidenced by RNA sequencing. Taken together, our findings position Emricasan as a potential alternative to current therapies for reprogramming macrophages in diseases driven by monocyte-derived macrophages.
Introduction
Macrophages are widely distributed innate immune cells that play an indispensable role in a variety of physiologic and pathologic processes.Citation1 This broad spectrum of immune and non-immune activities is modulated by surrounding stimuli and signals. The sources of macrophages include tissue resident macrophages that originate from progenitor cells generated in the yolk sac and monocyte-derived macrophages (MDMs) which are issued from bone marrow hematopoietic stem cells.Citation2 Even if macrophages are essential components of mammal tissue homeostasis, the anti-inflammatory macrophage subset is consistently considered as deleterious in various pathological settings.Citation3 However, the versatility of macrophages can be envisioned as a promising opportunity to design novel therapies.Citation4 CSF-1 is one of the cytokines involved in the generation of MDMs. In primary monocytes, CSF-1 interaction with CSF-1 R generates waves of AKT activation with increasing amplitude, eventually leading to the formation of a death receptor independent, procaspase-8-containing multi-molecular complex that also includes FADD (Fas-associated with death domain), c-FLIP (FLICE-like inhibitory protein) and RIPK1 (Receptor-interacting serine/threonine kinase), which may prevent necroptosis.Citation5,Citation6 In turn, effector caspases 3 and 7 are activated and cleave several intracellular proteins such as nucleophosmin, thereby contributing to the differentiated cell phenotype.Citation7–10 Therefore we tested the effect of Emricasan, a pan-caspase inhibitor, on MDMs polarization. It’s ability to reprogram MDMs polarization suggests that targeting non-apoptotic activity of caspases could serve as an alternative therapeutic strategy in diseases involving anti-inflammatory MDMs and/or requiring a modulation of MDMs.
Methods
Reagents and antibodies
Human CSF-1 was purchased from Miltenyi (130–096-493). Emricasan (IDN-6556) was purchased from Euromedex (S7775-5 mg). Q-VD-OPh was from Clinisciences (A1901-5 mg). Caspase-3, Caspase-7 and HSP60 antibodies were purchased from Cell Signaling Technology (catalog numbers were 9662, 9492 and 12165 respectively). HRP-conjugated rabbit anti-rabbit was purchased from cell signaling (7074).
Human monocyte culture and differentiation
Human peripheral volunteers were obtained from healthy donors with informed consent following the Declaration of Helsinki according to recommendations of an independent scientific review board. The project has been validated by The Etablissement Français du Sang, the French national agency for blood collection (13-PP-11). Blood samples were collected using ethylene diamine tetraacetic acid–containing tubes. Mononucleated cells were first isolated using Ficoll Hypaque (Eurobio, CMSMSL0101). Then, we used the autoMACS® Pro Separator (Miltenyi, France) to perform cell enrichment. An initial positive selection, which included antibody targeting CD14, was used for monocyte enrichment (Miltenyi, 130–050-201). Purified monocytes from human were grown in RPMI 1640 medium with glutamax-I (Life Technologies, 61870044) supplemented with 10% (vol/vol) fetal bovine serum (Life Technologies). Macrophage differentiation was induced by adding into the culture medium 50 ng/mL CSF-1 and was visualized using standard optics (20x/0.35 Ph1) equipped with an AxioCam ERc camera (Zeiss, France). Phase images of the cultures were recorded with the Zen 2 software (Zeiss).
Flow cytometry
To analyze macrophagic differentiation of monocytes, cells were washed with ice-cold phosphate buffered saline (PBS, Life Technologies, 14190169), incubated at 4°C for 15 min in PBS/bovine serum albumin (BSA 0.5%, Dutscher, 871002) with anti-CD16, anti-CD71 and anti-CD163 or isotype controls (Miltenyi and BD Biosciences, catalog numbers were 130–113-396, 130–097-628 and 551374). Finally, cells were washed and fixed in 2% paraformaldehyde (EMS, 15710). To perform macrophage polarization, purified monocytes were plated at 0.8 × 10⁶ per mL in RPMI 1640 medium with glutamax-I supplemented with 10% (vol/vol) fetal bovine serum plus CSF-1 for 5 + 2 days to differentiate into M0 macrophages. 20 ng/mL IL-4 (Miltenyi, 130–094-117) was added after 5 days of differentiation for two days to polarize into M2-like macrophages. To analyze macrophage polarization, cells were detached using PBS/EDTA/BSA, washed with PBS, and incubated at 4°C for 15 min in PBS/ bovine serum albumin with anti-CD200R (Miltenyi, 130–111-291), anti-CD206 (Miltenyi, 130–127-809) and anti-CD163 (Miltenyi, 130–112-130), anti-CD209 (Miltenyi, 130–120-729) or isotype controls. Finally, cells were washed and fixed in 2% paraformaldehyde (EMS, 15710). Fluorescence was measured with a MACSQuant® Analyzer (Miltenyi, Paris, France). To analyze cell death, cells were washed with ice-cold PBS and incubated at 4°C for 15 min in a specific buffer (10 mM HEPES, 150 mM NaCl, 5 mM KCl, 1 mM MgCl2, 1 mM CaCl2) with AnnexinV-FITC (Miltenyi, 130–097-928) and DAPI (Sigma-Aldrich, D9542). Fluorescence was measured with a MACSQuant® Analyzer (Miltenyi, Paris, France). To detect caspase activity, we used FITC-DEVD-FMK or FITC-IETD-FMK according to the manufacturer’s instruction (Promocell, green caspase-3 or caspase-8 staining kits, PK-CA577-K183 or PK-CA57-188).
Immunoblot assays
Cells were lysed for 30 min at 4°C in lysis buffer [50 mM HEPES pH 7.4, 150 mM NaCl, 20 mM EDTA, PhosphoSTOP (Sigma, 04906837001), complete protease inhibitor mixture (Sigma, 11836153001), 1% Triton X-100 (Sigma, T9284)]. Lysates were centrifuged at 16 000 g (15 min, 4°C) and supernatants were supplemented with concentrated loading buffer (4X Laemmli buffer). 60 micrograms of proteins were separated and transferred following standard protocols before analysis with the chemiluminescence detection kit (GE Healthcare, RPN2105).
Whole-transcriptome RNA-seq
The RNA integrity (RNA Integrity Score≥7.0) was checked on the Agilent 2100 Bioanalyzer (Agilent) and quantity was determined using Qubit (Invitrogen). SureSelect Automated Strand Specific RNA Library Preparation Kit was used according to manufacturer’s instructions with the Bravo Platform. Briefly, 50 to 200ng of total RNA sample was used for poly-A mRNA selection using oligo(dT) beads and subjected to thermal mRNA fragmentation. The fragmented mRNA samples were subjected to cDNA synthesis and were further converted into double stranded DNA using the reagents supplied in the kit, and the resulting dsDNA was used for library preparation. The final libraries were bar-coded, purified, pooled together in equal concentrations and subjected to paired-end sequencing on Novaseq-6000 sequencer (Illumina) at Gustave Roussy.
RNA-sequencing analysis
Quantification. Quality of raw FastQ files was assessed with Fastqc v0.11.8 and Fastq-screen v0.13.0. Quality report was gathered with MultiQC v1.8. Abundance estimation was performed with Salmon v0.14.1 using following parameters: – libType A – validateMappings – numBootstraps 60. Salmon index was created using Human Gencode reference annotation release 33 and using following parameters: – gencode – keepDuplicates. Differential analysis. Statistical analysis was performed using R 3.6.1. Transcript expression levels were aggregated in gene expression levels using tximport v1.14.0 Bioconductor package. At this step only protein coding genes were considered. We also decided to keep only high quality annotations therefore genes annotated as “automated annotation” in GENCODE were discarded. DESeq2 v1.26.0 method was used to identify differentially expressed genes between groups with an adjusted p-value threshold of 0.05. Principal Component Analysis was performed with with DESeq2 plotPCA function using default parameters, and ploted with ggplot package. Venn diagrams were drawn using Eulerr package. The heatmap was ploted using ComplexHeatmap package. Unsupervised hierarchical clustering was performed using hclust function from the stats package on r, and using Euclidean distance and ward.D2 clustering method. Over-representation analysis was performed on gene sets from the KEGG database using clusterProfiler package enrichKEGG function, with adjusted p and q values cutoff of 0.05. Top gene sets enriched were represented using ggplot. Volcano plots were drawn using using EnhancedVolcano package.
Reverse-transcription and real-time polymerase chain reaction
RNA was prepared from 6 × 10⁶ cells using the RNeasy Mini Kit according to manufacturer’s protocol (Qiagen, 74104). Each cDNA sample was prepared using AMV RT and random primers (Promega, M510F and C1181). Real-time polymerase chain reaction (PCR) was performed using the SyBR Green detection protocol (Life Technologies, 4367659). Briefly, 5 ng of total cDNA, 500 nM (each) primers, and 5 µL SyBR Green mixture were used in a total volume of 10 µL. Detection of endogenous control L32 was used to normalize the results. Specific forward and reverse primers are accessible upon request.
Statistical analysis
Statistical analysis was performed using a one or two-way ANOVA test (according the experience) and significance was considered when P values were lower than 0.05. The results are expressed as the mean ± SEM.
Results and discussion
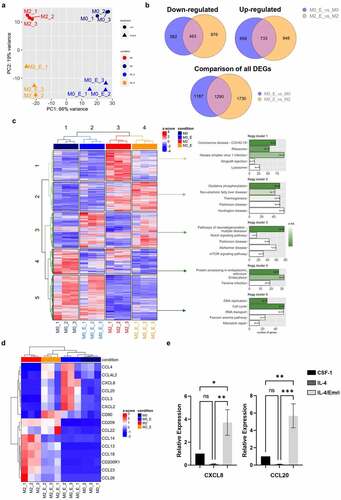
Ex vivo exposure of primary monocytes to CSF-1 for 2 days in liquid culture typically induces acquisition of a fibroblast-like shape (Fig. S1) and a robust increase in the expression of CD71/CD163 and CD16/CD163 antigens at the cell surface ( and Fig. S1). Emricasan added at day 0 triggered a dose-dependent inhibition of morphological changes and cell surface marker acquisition, starting at low micromolar concentrations. Emricasan was more efficient than Q-VD-OPh, which required to be added twice (100 µM, at day 0 and 1) to the culture medium to exert similar effect ( and Fig. S2A-B). At low micromolar concentrations, Emricasan showed limited effect on CSF1-treated monocyte viability, whereas higher concentrations induced cell death, as observed with Q-VD-OPh (Fig. S3A-B). To explore caspase activities in cellulo, human primary monocytes were cultured for 2 days in the absence or presence of CSF-1, without or with increasing concentrations of Emricasan at day 0 or with 100 µM Q-VD-OPh at day 0 and day 1. Fixation of the caspase substrate FITC-IETD-fmk or FITC-DEVD-fmk, reflecting caspase-8 and 3 activities respectively, was assessed by flow cytometry. Interestingly, most of CSF-1-treated monocytes exhibited high level of caspase-8 and 3 activations ( and Fig. S3C). Q-VD-OPh added twice at 100 μM induced a strong inhibition of caspase-8 activity, whereas Emricasan abrogated caspase-8 activity at the single dose of 2 μM, in agreement with its effect on monocyte differentiation (). Caspase inhibitors were initially developed to prevent excessive cell death but their toxicity and poor pharmacokinetic profile prevented further development.Citation11 Conversely, the pan-caspase inhibitor Emricasan demonstrated efficacy in attenuating reperfusion injury in human liver transplantsCitation12 and was administered safely to patients, although its efficacy in preventing liver cell death still remains a matter of debate.Citation12 Here, we show that, compared to the widely used pan-caspase inhibitor Q-VD-OPh, 100-fold lower concentrations of Emricasan durably impaired caspase-8 and −3 activities in CSF-1-treated monocytes. These results reinforce the interest of using this inhibitor to specifically blunts non apoptotic functions of caspases in CSF-1-treated monocytes. The differentiation-associated caspase activation can be accounted for by the unusual cleavage of caspase-3 and caspase-7 zymogens generating fragments at 26 and 30 kDa, respectively ( and Fig. S4A). This specific activation mode of caspases during CSF-1-mediated monocyte differentiation could explain the restricted number of protein substrates and the absence of cell death during CSF-1-mediated monocyte differentiation. Importantly, Q-VD-OPh and Emricasan impaired the cleavage of caspases at their specific differentiation cleavage sites indicating that both inhibitors can be used to target differentiation-associated caspase activation ( and Fig. S4B). We next analyzed the effect of these inhibitors during polarization of MDMs. Sorted human monocytes were incubated for 5 days with CSF-1, then cultured for two additional days, either in the presence of CSF-1 or IL-4, two conditions known to promote the generation of differentially polarized MDMs. Of note, the differentiation-associated cleavage of caspase-3 persisted in IL-4-induced MDMs polarization, but was strongly inhibited in Emricasan treated cells ( and Fig. S4C). Interestingly, Emricasan dampened the generation of CD200R+/CD206+ and CD200R+/CD163+ double-positive cells in IL4-polarized MDMs ( and Fig. S5A). Moreover, Emricasan thwarted the expression of anti-inflammatory markers and chemokines (Fig. S5B-C) even when IL-4-induced polarization was already engaged for two days. The inhibitory effect of Emricasan on IL4-induced anti-inflammatory cytokine expression was comforted using RT-qPCR (). The effects of Emricasan on MDMs were further explored by performing RNAseq comparing cells treated with CSF-1 (M0), CSF-1 + Emricasan (M0_E), to those treated with IL-4 (M2) or IL-4 + Emricasan (M2_E) ( and Fig. S6). Principal component analysis showed the segregation of the 4 tested conditions, indicating that Emricasan could reprogram both CSF-1 and IL-4-treated MDMs (). Comparison of monocytes treated with CSF1 to those treated with IL-4 identified 5,279 differentially expressed genes (up and down in M2 compared to M0, 2,621 and 2,658 genes, respectively (Fig. S6). Importantly, Emricasan treatment did not suppress the segregation between CSF-1 and IL-4-treated MDMs in comparison to M0_E and M2_E still identified 4,951 DEGs (up and down in M2_E compared to M0_E, 2,579 and 2,372 genes, respectively). Emricasan induced down-regulation of a slightly higher number of genes in IL-4-treated (M2_E) compared to CSF-1treated (M0_E) monocyte-derived cells (1,339 genes in M2_E compared to M2 cells, 1,045 genes in M0_E compared to M0 cells), of which 463 (24% of DEGs) were common to both conditions ( and Fig. S6). Similarly, Emricasan up-regulated a slightly higher number of genes in IL-4-treated compared to CSF-1-treated cells (1,681 genes in M2_E compared to M2 cells, 1,432 genes in M0_E compared to M0 cells), of which 733 (30.8% of DEGs) were common to both conditions ( and Fig. S6). We combined the DEGs from our four differential analyzes and generated a global heatmap of the expression of these genes in all samples. Unsupervised hierarchical clustering of the samples showed consistent grouping according to conditions. Unsupervised hierarchical clustering of the DEGs showed clusters of genes with contrasted patterns of expression across conditions, which led us to distinguish 5 clusters of genes with different patterns of expression on which we performed pathway analyses using the Kyoto Encyclopedia of Genes and Genomes (KEGG) database. The main pathway activated in cluster 2, which was defined by genes up-regulated in M2 compared to M0 that were not affected by Emricasan treatment in the two cell populations was oxidative phosphorylation, whereas cell cycle and DNA repair were mostly activated in cluster 5, defined by a higher expression in M0 compared to M2, without any significant effect of Emricasan. In contrast, genes that were up-regulated by Emricasan in both M0 and M2 (cluster 3) are involved in neurodegenerative diseases and cell signaling, those specifically down-regulated in M2 (cluster 1) in viral infections and those mostly down-regulated in M0 (cluster 4) in protein processing and endocytosis (). A focus on inflammatory molecules, pinpointed that IL-4 both induced anti-inflammatory and repressed pro-inflammatory markers, an effect that was counteracted by Emricasan (). This mirror effect was confirmed by analyzing the mRNA level of anti-inflammatory molecules such as CCL14, CCL17, CCL18, and CCL23 (), as well as pro-inflammatory molecules including CXCL8 and CCL20 (). This reprogramming of MDMs through caspase inhibition was also observed when Emricasan was added after a prior two days induction of polarization with IL-4 (Fig. S7). Altogether, these results illustrate the ability of Emricasan to modulate gene expression in differentially polarized MDMs and to prevent the up-regulation of anti-inflammatory actors at the benefit of pro-inflammatory molecules, thus orienting polarization of MDMs toward a pro-inflammatory phenotype. In conclusion, our study demonstrates that i) non-apoptotic functions of caspases are required for the generation and polarization of MDMs and ii) caspase targeting using Emricasan, a clinically available caspase inhibitor, reprograms MDMs toward a pro-inflammatory potential.
Figure 1. Emricasan is a strong inhibitor of CSF-1-induced monocyte differentiation and IL-4-mediated MDMs polarization. (a-d) Human blood monocytes were exposed for the indicated time to 50 ng/mL CSF-1 alone or in combination with the indicated concentrations (µM) of Emricasan or Q-VD-OPh (qVD) which were added 60 min before CSF-1 treatment. Q-VD-OPh was added again 24 hours after CSF-1 stimulation. (a) Macrophagic differentiation of monocytes from 3 different healthy donors was examined by 3-color flow cytometric analysis. The results are expressed as percentage of CD71/CD163 or CD16/CD163 double positive cells and represent the mean ± SD of 3 independent experiments. n.s. denotes not statistically significant according to a two-way ANOVA test (versus d2). *P < .05, **P < .01, ****P < .0001. (b) Caspase-8 and −3 were quantified by flow cytometry analysis using FITC-IETD-fmk and FITC-DEVD-fmk respectively. The results are expressed as percentage of IETD or DEVD positive cells and represent the mean ± SD of 3 independent experiments. n.s. denotes not statistically significant according to a two-way ANOVA test (versus d2). *P < .05, ****P < .0001. (c-d) Immunoblot analysis of indicated proteins. Actin and HSP60 were detected as the loading control. Asterisks indicate cleavage fragments. Each panel is representative of at least 3 independent experiments. (e-g) Human monocytes were differentiated during 5 days with 50 ng/mL CSF-1 and then treated with CSF-1 or polarized with IL-4 for 48 hours. Emricasan (3 µM) was added 16 h before the polarization. (e) Immunoblot analysis of indicated proteins. Actin was detected as the loading control. Asterisks indicate cleavage fragments. Each panel is representative of at least 3 independent experiments. (f) Macrophage polarization from 3 different healthy donors was examined by 3-color flow cytometric analysis. ****P < .0001 according to a two-way ANOVA test (versus M2-macrophages). (g) The expression of the indicated mRNA is analyzed by qPCR (mean ±SEM of 6 independent experiments). *P < .05, **P < .01 according to a one-way ANOVA test
Figure 2. Emricasan reprograms IL-4-mediated MDMs polarization. Human monocytes were differentiated during 5 days with 50 ng/mL CSF-1 and then treated with CSF-1 (M0) or polarized with IL-4 for 24 h (M2). Emricasan (E, 3 µM) was added 16 h before the polarization. (a) Four differential RNA seq analyses were performed comparing M2_E vs M2, M0_E vs M0, M2 vs M0, and M2_E vs M0_E. Unsupervised analysis of the transcriptome of the 12 samples represented through two-dimensional projection of Principal Component Analysis. Red: M2, dark blue: M0, Orange: M2_E, blue: M0_E (b) Venn diagram showing the overlap of genes differentially expressed in M2_E compared to M2 and M0_E compared to M0 (restricted to DEGs with an adjusted p value < .05). Right panel: genes that are down-regulated, left panel: genes that are up-regulated, and bottom panel: all differentially expressed genes. (c) Right panel: Heatmap of the DEGs from the four analyses performed. Unsupervised hierarchical clustering was performed on samples (columns) and genes (rows). Sample clustering separated the samples according to the four conditions. Genes clustering was partitioned into 5 clusters. Left panel: genes from each of the 5 clusters where extracted and over-representation analysis was performed on gene sets from the KEGG database. The 5 top gene sets enriched in each cluster are represented. Green shads according to padj, with the padj indicated in the bar. (d) Heatmap illustrating the differential expression of a selected panel of genes encoding pro or anti-inflammatory markers in M0, M2, M0_E and M2_E (e) The expression of the indicated mRNA is analyzed by qPCR (mean ±SEM of 6 independent experiments). *P < .05, **P < .01, ***P < .001 according to a two-way ANOVA test
At present, the therapeutic strategies aimed at targeting MDMs mainly include i) limiting monocyte recruitment (anti-CSF-1 R, anti-CCR2, anti-CCL2), ii) depletion strategies (clodronate-containing liposomes, anti-VEGF, Trabectedin, Zoledronic acid), iii) promoting macrophage phagocytic activity (anti-CD47) and iv) induction of macrophage reprogramming. Thus, reprogramming anti-inflammatory to pro-inflammatory macrophages can be achieved using RON inhibition, ANG-2 receptors inhibitors, CD40 agonists, TLR agonists or anti-MARCO antibody therapy in the cancer context.Citation13 While targeting anti-inflammatory macrophages proved to be a promising strategy pre-clinically, none of these drugs has reached the clinics so far. Therefore, a better understanding of the mechanisms involved in the generation of anti-inflammatory macrophages is crucial to generate innovative and alternative therapeutic opportunities. Here, we show that Emricasan, a clinically available caspase inhibitor, impairs ex vivo CSF-1-mediated monocyte differentiation and IL-4-induced MDMs polarization and reprograms these cells toward a pro-inflammatory phenotype. These observations highlighted the interest of targeting caspases to modulate the functions of MDMs, thus offering new therapeutic strategies in diseases, in which MDMs contribute to pathogenesis.Citation14
Author contributions statement
P.C. designed and performed the experimental work. F.E., V.G., C.S., N.F. contributed to some experiments. M.L.A., T.C., G.R. participated in helpful discussion. L.L. and N.D. were involved in whole-transcriptome RNAseq and RNA-sequencing analysis. E.S., P.A., A.J. directed the work, analyzed the results, and wrote the manuscript.
Supplemental Material
Download Zip (1.7 MB)Disclosure statement
No potential conflict of interest was reported by the author(s).
Supplementary material
Supplemental data for this article can be accessed on the publisher’s website.
Additional information
Funding
References
- Shapouri-Moghaddam A, Mohammadian S, Vazini H, Taghadosi M, Esmaeili SA, Mardani F, Seifi B, Mohammadi A, Afshari JT, Sahebkar A, et al. Macrophage plasticity, polarization, and function in health and disease. J Cell Physiol. 2018 Sep;233(9):6425–7. doi:10.1002/jcp.26429.
- Bleriot C, Chakarov S, Ginhoux F. Determinants of resident tissue macrophage identity and function. Immunity. 2020 Jun 16;52(6):957–970. doi:10.1016/j.immuni.2020.05.014.
- Zhang C, Yang M, Ericsson AC. Function of macrophages in disease: current understanding on molecular mechanisms. Front Immunol. 2021;12:620510. doi:10.3389/fimmu.2021.620510.
- Ricketts TD, Prieto-Dominguez N, Gowda PS, Ubil E. Mechanisms of macrophage plasticity in the tumor environment: manipulating activation state to improve outcomes. Front Immunol. 2021;12:642285. doi:10.3389/fimmu.2021.642285.
- Rebe C, Cathelin S, Launay S, Filomenko R, Prevotat L, L’Ollivier C, Gyan E, Micheau O, Grant S, Dubart-Kupperschmitt A, et al. Caspase-8 prevents sustained activation of NF-kappaB in monocytes undergoing macrophagic differentiation. Blood. 2007 Feb 15, 109(4):1442–1450. doi:10.1182/blood-2006-03-011585.
- Jacquel A, Benikhlef N, Paggetti J, Lalaoui N, Guery L, Dufour EK, Ciudad M, Racoeur C, Micheau O, Delva L, et al. Colony-stimulating factor-1-induced oscillations in phosphatidylinositol-3 kinase/AKT are required for caspase activation in monocytes undergoing differentiation into macrophages. Blood. 2009 Oct 22, 114(17):3633–3641. doi:10.1182/blood-2009-03-208843.
- Guery L, Benikhlef N, Gautier T, Paul C, Jego G, Dufour E, Jacquel A, Cally R, Manoury B, Vanden Berghe T, et al. Fine-tuning nucleophosmin in macrophage differentiation and activation. Blood. 2011 Oct 27, 118(17):4694–4704. doi:10.1182/blood-2011-03-341255.
- Cathelin S, Rebe C, Haddaoui L, Simioni N, Verdier F, Fontenay M, Launay S, Mayeux P, Solary E. Identification of proteins cleaved downstream of caspase activation in monocytes undergoing macrophage differentiation. J Biol Chem. 2006 Jun 30;281(26):17779–17788. doi:10.1074/jbc.M600537200.
- Jacquel A, Obba S, Boyer L, Dufies M, Robert G, Gounon P, Lemichez E, Luciano F, Solary E, Auberger P, et al. Autophagy is required for CSF-1-induced macrophagic differentiation and acquisition of phagocytic functions. Blood. 2012 May 10, 119(19):4527–4531. doi:10.1182/blood-2011-11-392167.
- Obba S, Hizir Z, Boyer L, Selimoglu-Buet D, Pfeifer A, Michel G, Hamouda M-A, Gonçalvès D, Cerezo M, Marchetti S, et al. The PRKAA1/AMPKalpha1 pathway triggers autophagy during CSF1-induced human monocyte differentiation and is a potential target in CMML. Autophagy. 2015;11(7):1114–1129. doi:10.1080/15548627.2015.1034406.
- Lee H, Shin EA, Lee JH, Ahn D, Kim CG, Kim JH, et al. Caspase inhibitors: a review of recently patented compounds (2013-2015). Expert Opin Ther Pat. 2018 Jan;28(1):47–59. doi:10.1080/13543776.2017.1378426.
- Baskin-Bey ES, Washburn K, Feng S, Oltersdorf T, Shapiro D, Huyghe M, Burgart L, Garrity-Park M, van Vilsteren FGI, Oliver LK, et al. Clinical Trial of the Pan-Caspase Inhibitor, IDN-6556, in human liver preservation injury. Am J Transplant. 2007 Jan;7(1):218–225. doi:10.1111/j.1600-6143.2006.01595.x.
- Chen Y, Jin H, Song Y, Huang T, Cao J, Tang Q, et al. Targeting tumor-associated macrophages: a potential treatment for solid tumors. J Cell Physiol. 2021 May;236(5):3445–3465. doi:10.1002/jcp.30139.
- Poltavets AS, Vishnyakova PA, Elchaninov AV, Sukhikh GT, Fatkhudinov TK. Macrophage modification strategies for efficient cell therapy. Cells. 2020 Jun 24;9(6):1535. doi:10.3390/cells9061535.